Free Statistics

of Irreproducible Research!

Author's title

Author*Unverified author*
R Software Modulerwasp_correlation.wasp
Title produced by softwarePearson Correlation
Date of computationSun, 19 Oct 2008 12:47:12 -0600
Cite this page as followsStatistical Computations at FreeStatistics.org, Office for Research Development and Education, URL https://freestatistics.org/blog/index.php?v=date/2008/Oct/19/t1224442134lwkfk7k0q3w582k.htm/, Retrieved Sun, 19 May 2024 16:09:12 +0000
Statistical Computations at FreeStatistics.org, Office for Research Development and Education, URL https://freestatistics.org/blog/index.php?pk=17045, Retrieved Sun, 19 May 2024 16:09:12 +0000
QR Codes:

Original text written by user:
IsPrivate?No (this computation is public)
User-defined keywords
Estimated Impact141
Family? (F = Feedback message, R = changed R code, M = changed R Module, P = changed Parameters, D = changed Data)
F       [Pearson Correlation] [Correlatieverband...] [2008-10-19 18:47:12] [701cc898ddafddb72d72f8df86ee2872] [Current]
Feedback Forum
2008-10-22 14:31:17 [Kim Wester] [reply
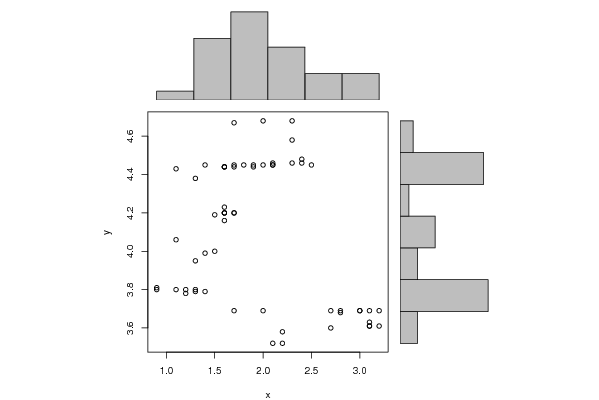
U geeft aan dat er sprake is van een zwak verband tussen de reeksen. Echter, het negatieve correlatiecoëfficiënt (-0,29) ligt dichter bij 0 dan bij -1. Er is sprake van geen verband (of negatief verband).
2008-10-27 08:30:27 [Siem Van Opstal] [reply
de student maakt een juiste berekening en trekt de juiste conclusie maar en ontbreekt een verklaring voor de tijdreeks.
2008-10-27 19:26:56 [Evelyne Slegers] [reply
Hier is sprake van dalende correlatie. Je kan een rechte door de punten tekenen dus er is wel een oorzakelijk verband tussen de twee datasets. Het is inderdaad wel een zwak verband. De correlatiecoëfficiënt moet tussen -1 en 1 liggen

Post a new message
Dataseries X:
2.1
2.2
2.2
2.7
3.1
3.2
3.1
3.1
2.8
3
2.8
2.7
3.2
3.1
3
2
1.7
1.2
1.4
1.3
1.3
1.1
0.9
1.2
0.9
1.3
1.4
1.5
1.1
1.6
1.5
1.6
1.7
1.6
1.7
1.6
1.6
1.3
1.1
1.6
1.9
1.6
1.7
1.6
1.4
2.1
1.9
1.7
1.8
2
2.5
2.1
2.1
2.3
2.4
2.4
2.3
1.7
2
2.3
Dataseries Y:
3.52
3.52
3.58
3.6
3.61
3.61
3.61
3.63
3.68
3.69
3.69
3.69
3.69
3.69
3.69
3.69
3.69
3.78
3.79
3.79
3.8
3.8
3.8
3.8
3.81
3.95
3.99
4
4.06
4.16
4.19
4.2
4.2
4.2
4.2
4.2
4.23
4.38
4.43
4.44
4.44
4.44
4.44
4.44
4.45
4.45
4.45
4.45
4.45
4.45
4.45
4.45
4.46
4.46
4.46
4.48
4.58
4.67
4.68
4.68


Summary of computational transaction
Raw Inputview raw input (R code)
Raw Outputview raw output of R engine
Computing time2 seconds
R Server'George Udny Yule' @ 72.249.76.132

\begin{tabular}{lllllllll}
\hline
Summary of computational transaction \tabularnewline
Raw Input & view raw input (R code)  \tabularnewline
Raw Output & view raw output of R engine  \tabularnewline
Computing time & 2 seconds \tabularnewline
R Server & 'George Udny Yule' @ 72.249.76.132 \tabularnewline
\hline
\end{tabular}
%Source: https://freestatistics.org/blog/index.php?pk=17045&T=0

[TABLE]
[ROW][C]Summary of computational transaction[/C][/ROW]
[ROW][C]Raw Input[/C][C]view raw input (R code) [/C][/ROW]
[ROW][C]Raw Output[/C][C]view raw output of R engine [/C][/ROW]
[ROW][C]Computing time[/C][C]2 seconds[/C][/ROW]
[ROW][C]R Server[/C][C]'George Udny Yule' @ 72.249.76.132[/C][/ROW]
[/TABLE]
Source: https://freestatistics.org/blog/index.php?pk=17045&T=0

Globally Unique Identifier (entire table): ba.freestatistics.org/blog/index.php?pk=17045&T=0

As an alternative you can also use a QR Code:  

The GUIDs for individual cells are displayed in the table below:

Summary of computational transaction
Raw Inputview raw input (R code)
Raw Outputview raw output of R engine
Computing time2 seconds
R Server'George Udny Yule' @ 72.249.76.132


Pearson Product Moment Correlation - Ungrouped Data
StatisticVariable XVariable Y
Mean1.9554.08183333333333
Biased Variance0.4061416666666670.133431638888889
Biased Standard Deviation0.6372924498742050.365282957293232
Covariance-0.069356779661017
Correlation-0.292968884693547
Determination0.0858307673985807
T-Test-2.33357731480322
p-value (2 sided)0.0231055033940909
p-value (1 sided)0.0115527516970454
Degrees of Freedom58
Number of Observations60

\begin{tabular}{lllllllll}
\hline
Pearson Product Moment Correlation - Ungrouped Data \tabularnewline
Statistic & Variable X & Variable Y \tabularnewline
Mean & 1.955 & 4.08183333333333 \tabularnewline
Biased Variance & 0.406141666666667 & 0.133431638888889 \tabularnewline
Biased Standard Deviation & 0.637292449874205 & 0.365282957293232 \tabularnewline
Covariance & -0.069356779661017 \tabularnewline
Correlation & -0.292968884693547 \tabularnewline
Determination & 0.0858307673985807 \tabularnewline
T-Test & -2.33357731480322 \tabularnewline
p-value (2 sided) & 0.0231055033940909 \tabularnewline
p-value (1 sided) & 0.0115527516970454 \tabularnewline
Degrees of Freedom & 58 \tabularnewline
Number of Observations & 60 \tabularnewline
\hline
\end{tabular}
%Source: https://freestatistics.org/blog/index.php?pk=17045&T=1

[TABLE]
[ROW][C]Pearson Product Moment Correlation - Ungrouped Data[/C][/ROW]
[ROW][C]Statistic[/C][C]Variable X[/C][C]Variable Y[/C][/ROW]
[ROW][C]Mean[/C][C]1.955[/C][C]4.08183333333333[/C][/ROW]
[ROW][C]Biased Variance[/C][C]0.406141666666667[/C][C]0.133431638888889[/C][/ROW]
[ROW][C]Biased Standard Deviation[/C][C]0.637292449874205[/C][C]0.365282957293232[/C][/ROW]
[ROW][C]Covariance[/C][C]-0.069356779661017[/C][/ROW]
[ROW][C]Correlation[/C][C]-0.292968884693547[/C][/ROW]
[ROW][C]Determination[/C][C]0.0858307673985807[/C][/ROW]
[ROW][C]T-Test[/C][C]-2.33357731480322[/C][/ROW]
[ROW][C]p-value (2 sided)[/C][C]0.0231055033940909[/C][/ROW]
[ROW][C]p-value (1 sided)[/C][C]0.0115527516970454[/C][/ROW]
[ROW][C]Degrees of Freedom[/C][C]58[/C][/ROW]
[ROW][C]Number of Observations[/C][C]60[/C][/ROW]
[/TABLE]
Source: https://freestatistics.org/blog/index.php?pk=17045&T=1

Globally Unique Identifier (entire table): ba.freestatistics.org/blog/index.php?pk=17045&T=1

As an alternative you can also use a QR Code:  

The GUIDs for individual cells are displayed in the table below:

Pearson Product Moment Correlation - Ungrouped Data
StatisticVariable XVariable Y
Mean1.9554.08183333333333
Biased Variance0.4061416666666670.133431638888889
Biased Standard Deviation0.6372924498742050.365282957293232
Covariance-0.069356779661017
Correlation-0.292968884693547
Determination0.0858307673985807
T-Test-2.33357731480322
p-value (2 sided)0.0231055033940909
p-value (1 sided)0.0115527516970454
Degrees of Freedom58
Number of Observations60


Parameters (Session):
Parameters (R input):
R code (references can be found in the software module):
bitmap(file='test1.png')
histx <- hist(x, plot=FALSE)
histy <- hist(y, plot=FALSE)
maxcounts <- max(c(histx$counts, histx$counts))
xrange <- c(min(x),max(x))
yrange <- c(min(y),max(y))
nf <- layout(matrix(c(2,0,1,3),2,2,byrow=TRUE), c(3,1), c(1,3), TRUE)
par(mar=c(4,4,1,1))
plot(x, y, xlim=xrange, ylim=yrange, xlab=xlab, ylab=ylab)
par(mar=c(0,4,1,1))
barplot(histx$counts, axes=FALSE, ylim=c(0, maxcounts), space=0)
par(mar=c(4,0,1,1))
barplot(histy$counts, axes=FALSE, xlim=c(0, maxcounts), space=0, horiz=TRUE)
dev.off()
lx = length(x)
makebiased = (lx-1)/lx
varx = var(x)*makebiased
vary = var(y)*makebiased
corxy <- cor.test(x,y,method='pearson')
cxy <- as.matrix(corxy$estimate)[1,1]
load(file='createtable')
a<-table.start()
a<-table.row.start(a)
a<-table.element(a,'Pearson Product Moment Correlation - Ungrouped Data',3,TRUE)
a<-table.row.end(a)
a<-table.row.start(a)
a<-table.element(a,'Statistic',1,TRUE)
a<-table.element(a,'Variable X',1,TRUE)
a<-table.element(a,'Variable Y',1,TRUE)
a<-table.row.end(a)
a<-table.row.start(a)
a<-table.element(a,hyperlink('arithmetic_mean.htm','Mean',''),header=TRUE)
a<-table.element(a,mean(x))
a<-table.element(a,mean(y))
a<-table.row.end(a)
a<-table.row.start(a)
a<-table.element(a,hyperlink('biased.htm','Biased Variance',''),header=TRUE)
a<-table.element(a,varx)
a<-table.element(a,vary)
a<-table.row.end(a)
a<-table.row.start(a)
a<-table.element(a,hyperlink('biased1.htm','Biased Standard Deviation',''),header=TRUE)
a<-table.element(a,sqrt(varx))
a<-table.element(a,sqrt(vary))
a<-table.row.end(a)
a<-table.row.start(a)
a<-table.element(a,hyperlink('covariance.htm','Covariance',''),header=TRUE)
a<-table.element(a,cov(x,y),2)
a<-table.row.end(a)
a<-table.row.start(a)
a<-table.element(a,hyperlink('pearson_correlation.htm','Correlation',''),header=TRUE)
a<-table.element(a,cxy,2)
a<-table.row.end(a)
a<-table.row.start(a)
a<-table.element(a,hyperlink('coeff_of_determination.htm','Determination',''),header=TRUE)
a<-table.element(a,cxy*cxy,2)
a<-table.row.end(a)
a<-table.row.start(a)
a<-table.element(a,hyperlink('ttest_statistic.htm','T-Test',''),header=TRUE)
a<-table.element(a,as.matrix(corxy$statistic)[1,1],2)
a<-table.row.end(a)
a<-table.row.start(a)
a<-table.element(a,'p-value (2 sided)',header=TRUE)
a<-table.element(a,(p2 <- as.matrix(corxy$p.value)[1,1]),2)
a<-table.row.end(a)
a<-table.row.start(a)
a<-table.element(a,'p-value (1 sided)',header=TRUE)
a<-table.element(a,p2/2,2)
a<-table.row.end(a)
a<-table.row.start(a)
a<-table.element(a,'Degrees of Freedom',header=TRUE)
a<-table.element(a,lx-2,2)
a<-table.row.end(a)
a<-table.row.start(a)
a<-table.element(a,'Number of Observations',header=TRUE)
a<-table.element(a,lx,2)
a<-table.row.end(a)
a<-table.end(a)
table.save(a,file='mytable.tab')