Free Statistics

of Irreproducible Research!

Author's title

Author*Unverified author*
R Software Modulerwasp_centraltendency.wasp
Title produced by softwareCentral Tendency
Date of computationSun, 19 Oct 2008 12:20:29 -0600
Cite this page as followsStatistical Computations at FreeStatistics.org, Office for Research Development and Education, URL https://freestatistics.org/blog/index.php?v=date/2008/Oct/19/t1224440459e6kqm5ig9o4vvtc.htm/, Retrieved Sun, 19 May 2024 14:42:07 +0000
Statistical Computations at FreeStatistics.org, Office for Research Development and Education, URL https://freestatistics.org/blog/index.php?pk=17027, Retrieved Sun, 19 May 2024 14:42:07 +0000
QR Codes:

Original text written by user:
IsPrivate?No (this computation is public)
User-defined keywords
Estimated Impact183
Family? (F = Feedback message, R = changed R code, M = changed R Module, P = changed Parameters, D = changed Data)
F     [Univariate Data Series] [] [2008-10-13 23:08:02] [e6c4428cda034f2790871b3ffa59aa02]
-   PD  [Univariate Data Series] [] [2008-10-19 17:39:13] [7c33e759a6f7358dc2f6505c3a7a1eae]
-   PD    [Univariate Data Series] [] [2008-10-19 17:42:24] [7c33e759a6f7358dc2f6505c3a7a1eae]
-   PD      [Univariate Data Series] [] [2008-10-19 17:44:18] [7c33e759a6f7358dc2f6505c3a7a1eae]
- RMPD        [Central Tendency] [] [2008-10-19 18:11:56] [7c33e759a6f7358dc2f6505c3a7a1eae]
F    D            [Central Tendency] [] [2008-10-19 18:20:29] [1e28c3a908c2cc51d131d1d2a5af4149] [Current]
-    D              [Central Tendency] [] [2008-10-19 18:24:39] [7c33e759a6f7358dc2f6505c3a7a1eae]
-    D                [Central Tendency] [] [2008-10-19 18:29:07] [7c33e759a6f7358dc2f6505c3a7a1eae]
- RM D                  [Percentiles] [] [2008-10-19 19:17:11] [7c33e759a6f7358dc2f6505c3a7a1eae]
- RMP                     [Harrell-Davis Quantiles] [] [2008-10-19 19:18:05] [7c33e759a6f7358dc2f6505c3a7a1eae]
- RMP                       [Stem-and-leaf Plot] [] [2008-10-19 19:20:57] [7c33e759a6f7358dc2f6505c3a7a1eae]
- RMPD                [Harrell-Davis Quantiles] [] [2008-10-19 19:12:58] [7c33e759a6f7358dc2f6505c3a7a1eae]
- RMP                   [Stem-and-leaf Plot] [] [2008-10-19 19:14:10] [7c33e759a6f7358dc2f6505c3a7a1eae]
- RMP                     [Percentiles] [] [2008-10-19 19:15:08] [7c33e759a6f7358dc2f6505c3a7a1eae]
- RMPD              [Stem-and-leaf Plot] [] [2008-10-19 19:05:16] [e6c4428cda034f2790871b3ffa59aa02]
- RMP                 [Percentiles] [] [2008-10-19 19:07:03] [e6c4428cda034f2790871b3ffa59aa02]
- RMP                   [Harrell-Davis Quantiles] [] [2008-10-19 19:09:20] [e6c4428cda034f2790871b3ffa59aa02]
Feedback Forum
2008-10-22 22:00:49 [Michaël De Kuyer] [reply
Je hebt inderdaad de analyse uitgevoerd. Maar in je document staat spijtig genoeg geen motivatie of besluiten. Eén van de besluiten zou kunnen zijn dat de mediaan en de midrange zeer sterk verschillen. Dit wijst erop dat de er zeer extrme waarden (minimum en maximum) in de reeks zitten.

Post a new message
Dataseries X:
89,6
92,8
107,6
104,6
103,0
106,9
56,3
93,4
109,1
113,8
97,4
72,5
82,7
88,9
105,9
100,8
94,0
105,0
58,5
87,6
113,1
112,5
89,6
74,5
82,7
90,1
109,4
96,0
89,2
109,1
49,1
92,9
107,7
103,5
91,1
79,8
71,9
82,9
90,1
100,7
90,7
108,8
44,1
93,6
107,4
96,5
93,6
76,5
76,7
84,0
103,3
88,5
99,0
105,9
44,7
94,0
107,1
104,8
102,5
77,7
85,2
91,3
106,5
92,4
97,5
107,0
51,1
98,6
102,2
114,3
99,4
72,5
92,3
99,4
85,9
109,4
97,6
104,7
56,5


Summary of computational transaction
Raw Inputview raw input (R code)
Raw Outputview raw output of R engine
Computing time1 seconds
R Server'Gwilym Jenkins' @ 72.249.127.135

\begin{tabular}{lllllllll}
\hline
Summary of computational transaction \tabularnewline
Raw Input & view raw input (R code)  \tabularnewline
Raw Output & view raw output of R engine  \tabularnewline
Computing time & 1 seconds \tabularnewline
R Server & 'Gwilym Jenkins' @ 72.249.127.135 \tabularnewline
\hline
\end{tabular}
%Source: https://freestatistics.org/blog/index.php?pk=17027&T=0

[TABLE]
[ROW][C]Summary of computational transaction[/C][/ROW]
[ROW][C]Raw Input[/C][C]view raw input (R code) [/C][/ROW]
[ROW][C]Raw Output[/C][C]view raw output of R engine [/C][/ROW]
[ROW][C]Computing time[/C][C]1 seconds[/C][/ROW]
[ROW][C]R Server[/C][C]'Gwilym Jenkins' @ 72.249.127.135[/C][/ROW]
[/TABLE]
Source: https://freestatistics.org/blog/index.php?pk=17027&T=0

Globally Unique Identifier (entire table): ba.freestatistics.org/blog/index.php?pk=17027&T=0

As an alternative you can also use a QR Code:  

The GUIDs for individual cells are displayed in the table below:

Summary of computational transaction
Raw Inputview raw input (R code)
Raw Outputview raw output of R engine
Computing time1 seconds
R Server'Gwilym Jenkins' @ 72.249.127.135


Central Tendency - Ungrouped Data
MeasureValueS.E.Value/S.E.
Arithmetic Mean92.01898734177211.8692554114965649.2276158602104
Geometric Mean90.1959033501267
Harmonic Mean87.9244181776314
Quadratic Mean93.4881546683383
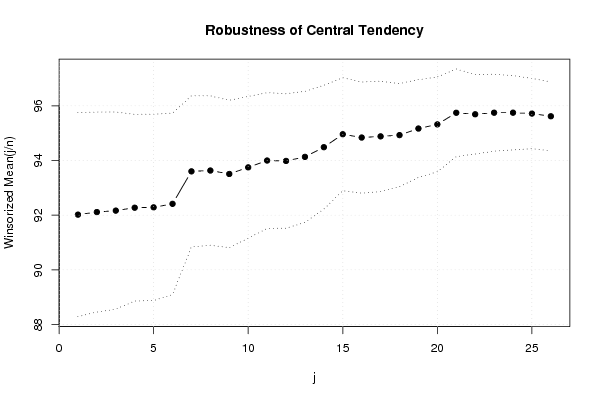
Winsorized Mean ( 1 / 26 )92.0202531645571.8658153861861349.3190558111182
Winsorized Mean ( 2 / 26 )92.1139240506331.8282624990921250.3833142649784
Winsorized Mean ( 3 / 26 )92.1670886075951.8023882615495551.1360901387347
Winsorized Mean ( 4 / 26 )92.2734177215191.7068011317697454.0621962359746
Winsorized Mean ( 5 / 26 )92.2860759493671.7033862204326454.1780101555168
Winsorized Mean ( 6 / 26 )92.41518987341771.6600945611585855.6686299899213
Winsorized Mean ( 7 / 26 )93.60253164556961.3817679321262167.741137617471
Winsorized Mean ( 8 / 26 )93.6329113924051.3652735375224168.5817961156139
Winsorized Mean ( 9 / 26 )93.50759493670891.3478880689868369.3734124429161
Winsorized Mean ( 10 / 26 )93.74810126582281.296762579077772.293959417382
Winsorized Mean ( 11 / 26 )93.99873417721521.2412360656596475.7299411270821
Winsorized Mean ( 12 / 26 )93.98354430379751.2294826116325876.4415400548044
Winsorized Mean ( 13 / 26 )94.13164556962031.1979216887151178.579131220661
Winsorized Mean ( 14 / 26 )94.4860759493671.1317261465046683.4884625058698
Winsorized Mean ( 15 / 26 )94.96075949367091.0330790136121591.920132189736
Winsorized Mean ( 16 / 26 )94.83924050632911.0158951229095793.3553458104077
Winsorized Mean ( 17 / 26 )94.88227848101271.0093232369285594.0058397642233
Winsorized Mean ( 18 / 26 )94.92784810126580.943224246365472100.641865884016
Winsorized Mean ( 19 / 26 )95.16835443037980.89454066425866106.387957789766
Winsorized Mean ( 20 / 26 )95.3202531645570.866014871897362110.067686200029
Winsorized Mean ( 21 / 26 )95.74556962025320.801248209672421119.495517699063
Winsorized Mean ( 22 / 26 )95.68987341772150.726137413613452131.779290839104
Winsorized Mean ( 23 / 26 )95.74810126582280.703454776828491136.111239015962
Winsorized Mean ( 24 / 26 )95.74810126582280.679630989761636140.882482859418
Winsorized Mean ( 25 / 26 )95.71645569620250.642552597765344148.962833593831
Winsorized Mean ( 26 / 26 )95.61772151898740.629249614919425151.955153013850
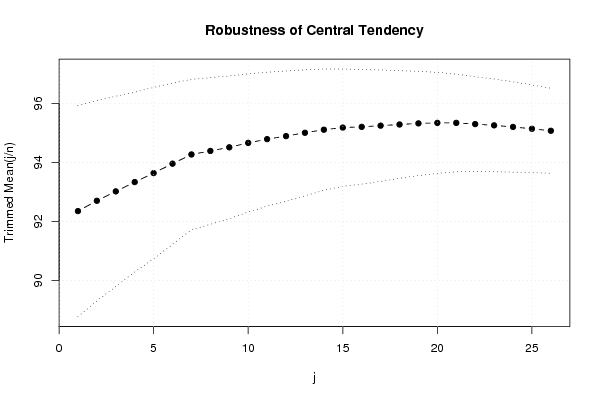
Trimmed Mean ( 1 / 26 )92.3519480519481.7890039790756151.6219914165127
Trimmed Mean ( 2 / 26 )92.70133333333331.6973561777052054.6151329644108
Trimmed Mean ( 3 / 26 )93.01917808219181.6124216469279757.6891151637752
Trimmed Mean ( 4 / 26 )93.33521126760561.522552260740661.301811224664
Trimmed Mean ( 5 / 26 )93.63913043478261.4514907194237764.512386597936
Trimmed Mean ( 6 / 26 )93.95820895522391.3659524491773268.7858563537936
Trimmed Mean ( 7 / 26 )94.27076923076921.2745450226621773.9642519915571
Trimmed Mean ( 8 / 26 )94.39047619047621.2431599115653175.9278635936915
Trimmed Mean ( 9 / 26 )94.51311475409841.2088889253912278.1818021233939
Trimmed Mean ( 10 / 26 )94.66271186440681.1705745922945680.8685858103662
Trimmed Mean ( 11 / 26 )94.78947368421051.135295232297383.4932368141822
Trimmed Mean ( 12 / 26 )94.89272727272731.1040234179476485.9517341118822
Trimmed Mean ( 13 / 26 )95.00566037735851.0672877575581689.0159750306903
Trimmed Mean ( 14 / 26 )95.10980392156861.0281270040641792.5078356522113
Trimmed Mean ( 15 / 26 )95.18163265306120.99356207190395895.7983757075842
Trimmed Mean ( 16 / 26 )95.20638297872340.97087276916532498.062677214208
Trimmed Mean ( 17 / 26 )95.24666666666670.944695985516243100.822558925788
Trimmed Mean ( 18 / 26 )95.2860465116280.911672682924157104.517825636720
Trimmed Mean ( 19 / 26 )95.32439024390240.883195283268578107.931271882613
Trimmed Mean ( 20 / 26 )95.34102564102560.856409650334743111.326426090318
Trimmed Mean ( 21 / 26 )95.34102564102560.826653775514684115.333684385177
Trimmed Mean ( 22 / 26 )95.30.801532146275248118.897289950082
Trimmed Mean ( 23 / 26 )95.25757575757580.785148971377121.324206271980
Trimmed Mean ( 24 / 26 )95.20322580645160.766074814153962124.274057895497
Trimmed Mean ( 25 / 26 )95.14137931034480.743485951868027127.966613318382
Trimmed Mean ( 26 / 26 )95.0740740740740.719955534251203132.055480583196
Median94
Midrange79.2
Midmean - Weighted Average at Xnp95.0875
Midmean - Weighted Average at X(n+1)p95.3243902439024
Midmean - Empirical Distribution Function95.3243902439024
Midmean - Empirical Distribution Function - Averaging95.3243902439024
Midmean - Empirical Distribution Function - Interpolation95.3410256410257
Midmean - Closest Observation95.0875
Midmean - True Basic - Statistics Graphics Toolkit95.3243902439024
Midmean - MS Excel (old versions)95.3243902439024
Number of observations79

\begin{tabular}{lllllllll}
\hline
Central Tendency - Ungrouped Data \tabularnewline
Measure & Value & S.E. & Value/S.E. \tabularnewline
Arithmetic Mean & 92.0189873417721 & 1.86925541149656 & 49.2276158602104 \tabularnewline
Geometric Mean & 90.1959033501267 &  &  \tabularnewline
Harmonic Mean & 87.9244181776314 &  &  \tabularnewline
Quadratic Mean & 93.4881546683383 &  &  \tabularnewline
Winsorized Mean ( 1 / 26 ) & 92.020253164557 & 1.86581538618613 & 49.3190558111182 \tabularnewline
Winsorized Mean ( 2 / 26 ) & 92.113924050633 & 1.82826249909212 & 50.3833142649784 \tabularnewline
Winsorized Mean ( 3 / 26 ) & 92.167088607595 & 1.80238826154955 & 51.1360901387347 \tabularnewline
Winsorized Mean ( 4 / 26 ) & 92.273417721519 & 1.70680113176974 & 54.0621962359746 \tabularnewline
Winsorized Mean ( 5 / 26 ) & 92.286075949367 & 1.70338622043264 & 54.1780101555168 \tabularnewline
Winsorized Mean ( 6 / 26 ) & 92.4151898734177 & 1.66009456115858 & 55.6686299899213 \tabularnewline
Winsorized Mean ( 7 / 26 ) & 93.6025316455696 & 1.38176793212621 & 67.741137617471 \tabularnewline
Winsorized Mean ( 8 / 26 ) & 93.632911392405 & 1.36527353752241 & 68.5817961156139 \tabularnewline
Winsorized Mean ( 9 / 26 ) & 93.5075949367089 & 1.34788806898683 & 69.3734124429161 \tabularnewline
Winsorized Mean ( 10 / 26 ) & 93.7481012658228 & 1.2967625790777 & 72.293959417382 \tabularnewline
Winsorized Mean ( 11 / 26 ) & 93.9987341772152 & 1.24123606565964 & 75.7299411270821 \tabularnewline
Winsorized Mean ( 12 / 26 ) & 93.9835443037975 & 1.22948261163258 & 76.4415400548044 \tabularnewline
Winsorized Mean ( 13 / 26 ) & 94.1316455696203 & 1.19792168871511 & 78.579131220661 \tabularnewline
Winsorized Mean ( 14 / 26 ) & 94.486075949367 & 1.13172614650466 & 83.4884625058698 \tabularnewline
Winsorized Mean ( 15 / 26 ) & 94.9607594936709 & 1.03307901361215 & 91.920132189736 \tabularnewline
Winsorized Mean ( 16 / 26 ) & 94.8392405063291 & 1.01589512290957 & 93.3553458104077 \tabularnewline
Winsorized Mean ( 17 / 26 ) & 94.8822784810127 & 1.00932323692855 & 94.0058397642233 \tabularnewline
Winsorized Mean ( 18 / 26 ) & 94.9278481012658 & 0.943224246365472 & 100.641865884016 \tabularnewline
Winsorized Mean ( 19 / 26 ) & 95.1683544303798 & 0.89454066425866 & 106.387957789766 \tabularnewline
Winsorized Mean ( 20 / 26 ) & 95.320253164557 & 0.866014871897362 & 110.067686200029 \tabularnewline
Winsorized Mean ( 21 / 26 ) & 95.7455696202532 & 0.801248209672421 & 119.495517699063 \tabularnewline
Winsorized Mean ( 22 / 26 ) & 95.6898734177215 & 0.726137413613452 & 131.779290839104 \tabularnewline
Winsorized Mean ( 23 / 26 ) & 95.7481012658228 & 0.703454776828491 & 136.111239015962 \tabularnewline
Winsorized Mean ( 24 / 26 ) & 95.7481012658228 & 0.679630989761636 & 140.882482859418 \tabularnewline
Winsorized Mean ( 25 / 26 ) & 95.7164556962025 & 0.642552597765344 & 148.962833593831 \tabularnewline
Winsorized Mean ( 26 / 26 ) & 95.6177215189874 & 0.629249614919425 & 151.955153013850 \tabularnewline
Trimmed Mean ( 1 / 26 ) & 92.351948051948 & 1.78900397907561 & 51.6219914165127 \tabularnewline
Trimmed Mean ( 2 / 26 ) & 92.7013333333333 & 1.69735617770520 & 54.6151329644108 \tabularnewline
Trimmed Mean ( 3 / 26 ) & 93.0191780821918 & 1.61242164692797 & 57.6891151637752 \tabularnewline
Trimmed Mean ( 4 / 26 ) & 93.3352112676056 & 1.5225522607406 & 61.301811224664 \tabularnewline
Trimmed Mean ( 5 / 26 ) & 93.6391304347826 & 1.45149071942377 & 64.512386597936 \tabularnewline
Trimmed Mean ( 6 / 26 ) & 93.9582089552239 & 1.36595244917732 & 68.7858563537936 \tabularnewline
Trimmed Mean ( 7 / 26 ) & 94.2707692307692 & 1.27454502266217 & 73.9642519915571 \tabularnewline
Trimmed Mean ( 8 / 26 ) & 94.3904761904762 & 1.24315991156531 & 75.9278635936915 \tabularnewline
Trimmed Mean ( 9 / 26 ) & 94.5131147540984 & 1.20888892539122 & 78.1818021233939 \tabularnewline
Trimmed Mean ( 10 / 26 ) & 94.6627118644068 & 1.17057459229456 & 80.8685858103662 \tabularnewline
Trimmed Mean ( 11 / 26 ) & 94.7894736842105 & 1.1352952322973 & 83.4932368141822 \tabularnewline
Trimmed Mean ( 12 / 26 ) & 94.8927272727273 & 1.10402341794764 & 85.9517341118822 \tabularnewline
Trimmed Mean ( 13 / 26 ) & 95.0056603773585 & 1.06728775755816 & 89.0159750306903 \tabularnewline
Trimmed Mean ( 14 / 26 ) & 95.1098039215686 & 1.02812700406417 & 92.5078356522113 \tabularnewline
Trimmed Mean ( 15 / 26 ) & 95.1816326530612 & 0.993562071903958 & 95.7983757075842 \tabularnewline
Trimmed Mean ( 16 / 26 ) & 95.2063829787234 & 0.970872769165324 & 98.062677214208 \tabularnewline
Trimmed Mean ( 17 / 26 ) & 95.2466666666667 & 0.944695985516243 & 100.822558925788 \tabularnewline
Trimmed Mean ( 18 / 26 ) & 95.286046511628 & 0.911672682924157 & 104.517825636720 \tabularnewline
Trimmed Mean ( 19 / 26 ) & 95.3243902439024 & 0.883195283268578 & 107.931271882613 \tabularnewline
Trimmed Mean ( 20 / 26 ) & 95.3410256410256 & 0.856409650334743 & 111.326426090318 \tabularnewline
Trimmed Mean ( 21 / 26 ) & 95.3410256410256 & 0.826653775514684 & 115.333684385177 \tabularnewline
Trimmed Mean ( 22 / 26 ) & 95.3 & 0.801532146275248 & 118.897289950082 \tabularnewline
Trimmed Mean ( 23 / 26 ) & 95.2575757575758 & 0.785148971377 & 121.324206271980 \tabularnewline
Trimmed Mean ( 24 / 26 ) & 95.2032258064516 & 0.766074814153962 & 124.274057895497 \tabularnewline
Trimmed Mean ( 25 / 26 ) & 95.1413793103448 & 0.743485951868027 & 127.966613318382 \tabularnewline
Trimmed Mean ( 26 / 26 ) & 95.074074074074 & 0.719955534251203 & 132.055480583196 \tabularnewline
Median & 94 &  &  \tabularnewline
Midrange & 79.2 &  &  \tabularnewline
Midmean - Weighted Average at Xnp & 95.0875 &  &  \tabularnewline
Midmean - Weighted Average at X(n+1)p & 95.3243902439024 &  &  \tabularnewline
Midmean - Empirical Distribution Function & 95.3243902439024 &  &  \tabularnewline
Midmean - Empirical Distribution Function - Averaging & 95.3243902439024 &  &  \tabularnewline
Midmean - Empirical Distribution Function - Interpolation & 95.3410256410257 &  &  \tabularnewline
Midmean - Closest Observation & 95.0875 &  &  \tabularnewline
Midmean - True Basic - Statistics Graphics Toolkit & 95.3243902439024 &  &  \tabularnewline
Midmean - MS Excel (old versions) & 95.3243902439024 &  &  \tabularnewline
Number of observations & 79 &  &  \tabularnewline
\hline
\end{tabular}
%Source: https://freestatistics.org/blog/index.php?pk=17027&T=1

[TABLE]
[ROW][C]Central Tendency - Ungrouped Data[/C][/ROW]
[ROW][C]Measure[/C][C]Value[/C][C]S.E.[/C][C]Value/S.E.[/C][/ROW]
[ROW][C]Arithmetic Mean[/C][C]92.0189873417721[/C][C]1.86925541149656[/C][C]49.2276158602104[/C][/ROW]
[ROW][C]Geometric Mean[/C][C]90.1959033501267[/C][C][/C][C][/C][/ROW]
[ROW][C]Harmonic Mean[/C][C]87.9244181776314[/C][C][/C][C][/C][/ROW]
[ROW][C]Quadratic Mean[/C][C]93.4881546683383[/C][C][/C][C][/C][/ROW]
[ROW][C]Winsorized Mean ( 1 / 26 )[/C][C]92.020253164557[/C][C]1.86581538618613[/C][C]49.3190558111182[/C][/ROW]
[ROW][C]Winsorized Mean ( 2 / 26 )[/C][C]92.113924050633[/C][C]1.82826249909212[/C][C]50.3833142649784[/C][/ROW]
[ROW][C]Winsorized Mean ( 3 / 26 )[/C][C]92.167088607595[/C][C]1.80238826154955[/C][C]51.1360901387347[/C][/ROW]
[ROW][C]Winsorized Mean ( 4 / 26 )[/C][C]92.273417721519[/C][C]1.70680113176974[/C][C]54.0621962359746[/C][/ROW]
[ROW][C]Winsorized Mean ( 5 / 26 )[/C][C]92.286075949367[/C][C]1.70338622043264[/C][C]54.1780101555168[/C][/ROW]
[ROW][C]Winsorized Mean ( 6 / 26 )[/C][C]92.4151898734177[/C][C]1.66009456115858[/C][C]55.6686299899213[/C][/ROW]
[ROW][C]Winsorized Mean ( 7 / 26 )[/C][C]93.6025316455696[/C][C]1.38176793212621[/C][C]67.741137617471[/C][/ROW]
[ROW][C]Winsorized Mean ( 8 / 26 )[/C][C]93.632911392405[/C][C]1.36527353752241[/C][C]68.5817961156139[/C][/ROW]
[ROW][C]Winsorized Mean ( 9 / 26 )[/C][C]93.5075949367089[/C][C]1.34788806898683[/C][C]69.3734124429161[/C][/ROW]
[ROW][C]Winsorized Mean ( 10 / 26 )[/C][C]93.7481012658228[/C][C]1.2967625790777[/C][C]72.293959417382[/C][/ROW]
[ROW][C]Winsorized Mean ( 11 / 26 )[/C][C]93.9987341772152[/C][C]1.24123606565964[/C][C]75.7299411270821[/C][/ROW]
[ROW][C]Winsorized Mean ( 12 / 26 )[/C][C]93.9835443037975[/C][C]1.22948261163258[/C][C]76.4415400548044[/C][/ROW]
[ROW][C]Winsorized Mean ( 13 / 26 )[/C][C]94.1316455696203[/C][C]1.19792168871511[/C][C]78.579131220661[/C][/ROW]
[ROW][C]Winsorized Mean ( 14 / 26 )[/C][C]94.486075949367[/C][C]1.13172614650466[/C][C]83.4884625058698[/C][/ROW]
[ROW][C]Winsorized Mean ( 15 / 26 )[/C][C]94.9607594936709[/C][C]1.03307901361215[/C][C]91.920132189736[/C][/ROW]
[ROW][C]Winsorized Mean ( 16 / 26 )[/C][C]94.8392405063291[/C][C]1.01589512290957[/C][C]93.3553458104077[/C][/ROW]
[ROW][C]Winsorized Mean ( 17 / 26 )[/C][C]94.8822784810127[/C][C]1.00932323692855[/C][C]94.0058397642233[/C][/ROW]
[ROW][C]Winsorized Mean ( 18 / 26 )[/C][C]94.9278481012658[/C][C]0.943224246365472[/C][C]100.641865884016[/C][/ROW]
[ROW][C]Winsorized Mean ( 19 / 26 )[/C][C]95.1683544303798[/C][C]0.89454066425866[/C][C]106.387957789766[/C][/ROW]
[ROW][C]Winsorized Mean ( 20 / 26 )[/C][C]95.320253164557[/C][C]0.866014871897362[/C][C]110.067686200029[/C][/ROW]
[ROW][C]Winsorized Mean ( 21 / 26 )[/C][C]95.7455696202532[/C][C]0.801248209672421[/C][C]119.495517699063[/C][/ROW]
[ROW][C]Winsorized Mean ( 22 / 26 )[/C][C]95.6898734177215[/C][C]0.726137413613452[/C][C]131.779290839104[/C][/ROW]
[ROW][C]Winsorized Mean ( 23 / 26 )[/C][C]95.7481012658228[/C][C]0.703454776828491[/C][C]136.111239015962[/C][/ROW]
[ROW][C]Winsorized Mean ( 24 / 26 )[/C][C]95.7481012658228[/C][C]0.679630989761636[/C][C]140.882482859418[/C][/ROW]
[ROW][C]Winsorized Mean ( 25 / 26 )[/C][C]95.7164556962025[/C][C]0.642552597765344[/C][C]148.962833593831[/C][/ROW]
[ROW][C]Winsorized Mean ( 26 / 26 )[/C][C]95.6177215189874[/C][C]0.629249614919425[/C][C]151.955153013850[/C][/ROW]
[ROW][C]Trimmed Mean ( 1 / 26 )[/C][C]92.351948051948[/C][C]1.78900397907561[/C][C]51.6219914165127[/C][/ROW]
[ROW][C]Trimmed Mean ( 2 / 26 )[/C][C]92.7013333333333[/C][C]1.69735617770520[/C][C]54.6151329644108[/C][/ROW]
[ROW][C]Trimmed Mean ( 3 / 26 )[/C][C]93.0191780821918[/C][C]1.61242164692797[/C][C]57.6891151637752[/C][/ROW]
[ROW][C]Trimmed Mean ( 4 / 26 )[/C][C]93.3352112676056[/C][C]1.5225522607406[/C][C]61.301811224664[/C][/ROW]
[ROW][C]Trimmed Mean ( 5 / 26 )[/C][C]93.6391304347826[/C][C]1.45149071942377[/C][C]64.512386597936[/C][/ROW]
[ROW][C]Trimmed Mean ( 6 / 26 )[/C][C]93.9582089552239[/C][C]1.36595244917732[/C][C]68.7858563537936[/C][/ROW]
[ROW][C]Trimmed Mean ( 7 / 26 )[/C][C]94.2707692307692[/C][C]1.27454502266217[/C][C]73.9642519915571[/C][/ROW]
[ROW][C]Trimmed Mean ( 8 / 26 )[/C][C]94.3904761904762[/C][C]1.24315991156531[/C][C]75.9278635936915[/C][/ROW]
[ROW][C]Trimmed Mean ( 9 / 26 )[/C][C]94.5131147540984[/C][C]1.20888892539122[/C][C]78.1818021233939[/C][/ROW]
[ROW][C]Trimmed Mean ( 10 / 26 )[/C][C]94.6627118644068[/C][C]1.17057459229456[/C][C]80.8685858103662[/C][/ROW]
[ROW][C]Trimmed Mean ( 11 / 26 )[/C][C]94.7894736842105[/C][C]1.1352952322973[/C][C]83.4932368141822[/C][/ROW]
[ROW][C]Trimmed Mean ( 12 / 26 )[/C][C]94.8927272727273[/C][C]1.10402341794764[/C][C]85.9517341118822[/C][/ROW]
[ROW][C]Trimmed Mean ( 13 / 26 )[/C][C]95.0056603773585[/C][C]1.06728775755816[/C][C]89.0159750306903[/C][/ROW]
[ROW][C]Trimmed Mean ( 14 / 26 )[/C][C]95.1098039215686[/C][C]1.02812700406417[/C][C]92.5078356522113[/C][/ROW]
[ROW][C]Trimmed Mean ( 15 / 26 )[/C][C]95.1816326530612[/C][C]0.993562071903958[/C][C]95.7983757075842[/C][/ROW]
[ROW][C]Trimmed Mean ( 16 / 26 )[/C][C]95.2063829787234[/C][C]0.970872769165324[/C][C]98.062677214208[/C][/ROW]
[ROW][C]Trimmed Mean ( 17 / 26 )[/C][C]95.2466666666667[/C][C]0.944695985516243[/C][C]100.822558925788[/C][/ROW]
[ROW][C]Trimmed Mean ( 18 / 26 )[/C][C]95.286046511628[/C][C]0.911672682924157[/C][C]104.517825636720[/C][/ROW]
[ROW][C]Trimmed Mean ( 19 / 26 )[/C][C]95.3243902439024[/C][C]0.883195283268578[/C][C]107.931271882613[/C][/ROW]
[ROW][C]Trimmed Mean ( 20 / 26 )[/C][C]95.3410256410256[/C][C]0.856409650334743[/C][C]111.326426090318[/C][/ROW]
[ROW][C]Trimmed Mean ( 21 / 26 )[/C][C]95.3410256410256[/C][C]0.826653775514684[/C][C]115.333684385177[/C][/ROW]
[ROW][C]Trimmed Mean ( 22 / 26 )[/C][C]95.3[/C][C]0.801532146275248[/C][C]118.897289950082[/C][/ROW]
[ROW][C]Trimmed Mean ( 23 / 26 )[/C][C]95.2575757575758[/C][C]0.785148971377[/C][C]121.324206271980[/C][/ROW]
[ROW][C]Trimmed Mean ( 24 / 26 )[/C][C]95.2032258064516[/C][C]0.766074814153962[/C][C]124.274057895497[/C][/ROW]
[ROW][C]Trimmed Mean ( 25 / 26 )[/C][C]95.1413793103448[/C][C]0.743485951868027[/C][C]127.966613318382[/C][/ROW]
[ROW][C]Trimmed Mean ( 26 / 26 )[/C][C]95.074074074074[/C][C]0.719955534251203[/C][C]132.055480583196[/C][/ROW]
[ROW][C]Median[/C][C]94[/C][C][/C][C][/C][/ROW]
[ROW][C]Midrange[/C][C]79.2[/C][C][/C][C][/C][/ROW]
[ROW][C]Midmean - Weighted Average at Xnp[/C][C]95.0875[/C][C][/C][C][/C][/ROW]
[ROW][C]Midmean - Weighted Average at X(n+1)p[/C][C]95.3243902439024[/C][C][/C][C][/C][/ROW]
[ROW][C]Midmean - Empirical Distribution Function[/C][C]95.3243902439024[/C][C][/C][C][/C][/ROW]
[ROW][C]Midmean - Empirical Distribution Function - Averaging[/C][C]95.3243902439024[/C][C][/C][C][/C][/ROW]
[ROW][C]Midmean - Empirical Distribution Function - Interpolation[/C][C]95.3410256410257[/C][C][/C][C][/C][/ROW]
[ROW][C]Midmean - Closest Observation[/C][C]95.0875[/C][C][/C][C][/C][/ROW]
[ROW][C]Midmean - True Basic - Statistics Graphics Toolkit[/C][C]95.3243902439024[/C][C][/C][C][/C][/ROW]
[ROW][C]Midmean - MS Excel (old versions)[/C][C]95.3243902439024[/C][C][/C][C][/C][/ROW]
[ROW][C]Number of observations[/C][C]79[/C][C][/C][C][/C][/ROW]
[/TABLE]
Source: https://freestatistics.org/blog/index.php?pk=17027&T=1

Globally Unique Identifier (entire table): ba.freestatistics.org/blog/index.php?pk=17027&T=1

As an alternative you can also use a QR Code:  

The GUIDs for individual cells are displayed in the table below:

Central Tendency - Ungrouped Data
MeasureValueS.E.Value/S.E.
Arithmetic Mean92.01898734177211.8692554114965649.2276158602104
Geometric Mean90.1959033501267
Harmonic Mean87.9244181776314
Quadratic Mean93.4881546683383
Winsorized Mean ( 1 / 26 )92.0202531645571.8658153861861349.3190558111182
Winsorized Mean ( 2 / 26 )92.1139240506331.8282624990921250.3833142649784
Winsorized Mean ( 3 / 26 )92.1670886075951.8023882615495551.1360901387347
Winsorized Mean ( 4 / 26 )92.2734177215191.7068011317697454.0621962359746
Winsorized Mean ( 5 / 26 )92.2860759493671.7033862204326454.1780101555168
Winsorized Mean ( 6 / 26 )92.41518987341771.6600945611585855.6686299899213
Winsorized Mean ( 7 / 26 )93.60253164556961.3817679321262167.741137617471
Winsorized Mean ( 8 / 26 )93.6329113924051.3652735375224168.5817961156139
Winsorized Mean ( 9 / 26 )93.50759493670891.3478880689868369.3734124429161
Winsorized Mean ( 10 / 26 )93.74810126582281.296762579077772.293959417382
Winsorized Mean ( 11 / 26 )93.99873417721521.2412360656596475.7299411270821
Winsorized Mean ( 12 / 26 )93.98354430379751.2294826116325876.4415400548044
Winsorized Mean ( 13 / 26 )94.13164556962031.1979216887151178.579131220661
Winsorized Mean ( 14 / 26 )94.4860759493671.1317261465046683.4884625058698
Winsorized Mean ( 15 / 26 )94.96075949367091.0330790136121591.920132189736
Winsorized Mean ( 16 / 26 )94.83924050632911.0158951229095793.3553458104077
Winsorized Mean ( 17 / 26 )94.88227848101271.0093232369285594.0058397642233
Winsorized Mean ( 18 / 26 )94.92784810126580.943224246365472100.641865884016
Winsorized Mean ( 19 / 26 )95.16835443037980.89454066425866106.387957789766
Winsorized Mean ( 20 / 26 )95.3202531645570.866014871897362110.067686200029
Winsorized Mean ( 21 / 26 )95.74556962025320.801248209672421119.495517699063
Winsorized Mean ( 22 / 26 )95.68987341772150.726137413613452131.779290839104
Winsorized Mean ( 23 / 26 )95.74810126582280.703454776828491136.111239015962
Winsorized Mean ( 24 / 26 )95.74810126582280.679630989761636140.882482859418
Winsorized Mean ( 25 / 26 )95.71645569620250.642552597765344148.962833593831
Winsorized Mean ( 26 / 26 )95.61772151898740.629249614919425151.955153013850
Trimmed Mean ( 1 / 26 )92.3519480519481.7890039790756151.6219914165127
Trimmed Mean ( 2 / 26 )92.70133333333331.6973561777052054.6151329644108
Trimmed Mean ( 3 / 26 )93.01917808219181.6124216469279757.6891151637752
Trimmed Mean ( 4 / 26 )93.33521126760561.522552260740661.301811224664
Trimmed Mean ( 5 / 26 )93.63913043478261.4514907194237764.512386597936
Trimmed Mean ( 6 / 26 )93.95820895522391.3659524491773268.7858563537936
Trimmed Mean ( 7 / 26 )94.27076923076921.2745450226621773.9642519915571
Trimmed Mean ( 8 / 26 )94.39047619047621.2431599115653175.9278635936915
Trimmed Mean ( 9 / 26 )94.51311475409841.2088889253912278.1818021233939
Trimmed Mean ( 10 / 26 )94.66271186440681.1705745922945680.8685858103662
Trimmed Mean ( 11 / 26 )94.78947368421051.135295232297383.4932368141822
Trimmed Mean ( 12 / 26 )94.89272727272731.1040234179476485.9517341118822
Trimmed Mean ( 13 / 26 )95.00566037735851.0672877575581689.0159750306903
Trimmed Mean ( 14 / 26 )95.10980392156861.0281270040641792.5078356522113
Trimmed Mean ( 15 / 26 )95.18163265306120.99356207190395895.7983757075842
Trimmed Mean ( 16 / 26 )95.20638297872340.97087276916532498.062677214208
Trimmed Mean ( 17 / 26 )95.24666666666670.944695985516243100.822558925788
Trimmed Mean ( 18 / 26 )95.2860465116280.911672682924157104.517825636720
Trimmed Mean ( 19 / 26 )95.32439024390240.883195283268578107.931271882613
Trimmed Mean ( 20 / 26 )95.34102564102560.856409650334743111.326426090318
Trimmed Mean ( 21 / 26 )95.34102564102560.826653775514684115.333684385177
Trimmed Mean ( 22 / 26 )95.30.801532146275248118.897289950082
Trimmed Mean ( 23 / 26 )95.25757575757580.785148971377121.324206271980
Trimmed Mean ( 24 / 26 )95.20322580645160.766074814153962124.274057895497
Trimmed Mean ( 25 / 26 )95.14137931034480.743485951868027127.966613318382
Trimmed Mean ( 26 / 26 )95.0740740740740.719955534251203132.055480583196
Median94
Midrange79.2
Midmean - Weighted Average at Xnp95.0875
Midmean - Weighted Average at X(n+1)p95.3243902439024
Midmean - Empirical Distribution Function95.3243902439024
Midmean - Empirical Distribution Function - Averaging95.3243902439024
Midmean - Empirical Distribution Function - Interpolation95.3410256410257
Midmean - Closest Observation95.0875
Midmean - True Basic - Statistics Graphics Toolkit95.3243902439024
Midmean - MS Excel (old versions)95.3243902439024
Number of observations79


Parameters (Session):
Parameters (R input):
R code (references can be found in the software module):
geomean <- function(x) {
return(exp(mean(log(x))))
}
harmean <- function(x) {
return(1/mean(1/x))
}
quamean <- function(x) {
return(sqrt(mean(x*x)))
}
winmean <- function(x) {
x <-sort(x[!is.na(x)])
n<-length(x)
denom <- 3
nodenom <- n/denom
if (nodenom>40) denom <- n/40
sqrtn = sqrt(n)
roundnodenom = floor(nodenom)
win <- array(NA,dim=c(roundnodenom,2))
for (j in 1:roundnodenom) {
win[j,1] <- (j*x[j+1]+sum(x[(j+1):(n-j)])+j*x[n-j])/n
win[j,2] <- sd(c(rep(x[j+1],j),x[(j+1):(n-j)],rep(x[n-j],j)))/sqrtn
}
return(win)
}
trimean <- function(x) {
x <-sort(x[!is.na(x)])
n<-length(x)
denom <- 3
nodenom <- n/denom
if (nodenom>40) denom <- n/40
sqrtn = sqrt(n)
roundnodenom = floor(nodenom)
tri <- array(NA,dim=c(roundnodenom,2))
for (j in 1:roundnodenom) {
tri[j,1] <- mean(x,trim=j/n)
tri[j,2] <- sd(x[(j+1):(n-j)]) / sqrt(n-j*2)
}
return(tri)
}
midrange <- function(x) {
return((max(x)+min(x))/2)
}
q1 <- function(data,n,p,i,f) {
np <- n*p;
i <<- floor(np)
f <<- np - i
qvalue <- (1-f)*data[i] + f*data[i+1]
}
q2 <- function(data,n,p,i,f) {
np <- (n+1)*p
i <<- floor(np)
f <<- np - i
qvalue <- (1-f)*data[i] + f*data[i+1]
}
q3 <- function(data,n,p,i,f) {
np <- n*p
i <<- floor(np)
f <<- np - i
if (f==0) {
qvalue <- data[i]
} else {
qvalue <- data[i+1]
}
}
q4 <- function(data,n,p,i,f) {
np <- n*p
i <<- floor(np)
f <<- np - i
if (f==0) {
qvalue <- (data[i]+data[i+1])/2
} else {
qvalue <- data[i+1]
}
}
q5 <- function(data,n,p,i,f) {
np <- (n-1)*p
i <<- floor(np)
f <<- np - i
if (f==0) {
qvalue <- data[i+1]
} else {
qvalue <- data[i+1] + f*(data[i+2]-data[i+1])
}
}
q6 <- function(data,n,p,i,f) {
np <- n*p+0.5
i <<- floor(np)
f <<- np - i
qvalue <- data[i]
}
q7 <- function(data,n,p,i,f) {
np <- (n+1)*p
i <<- floor(np)
f <<- np - i
if (f==0) {
qvalue <- data[i]
} else {
qvalue <- f*data[i] + (1-f)*data[i+1]
}
}
q8 <- function(data,n,p,i,f) {
np <- (n+1)*p
i <<- floor(np)
f <<- np - i
if (f==0) {
qvalue <- data[i]
} else {
if (f == 0.5) {
qvalue <- (data[i]+data[i+1])/2
} else {
if (f < 0.5) {
qvalue <- data[i]
} else {
qvalue <- data[i+1]
}
}
}
}
midmean <- function(x,def) {
x <-sort(x[!is.na(x)])
n<-length(x)
if (def==1) {
qvalue1 <- q1(x,n,0.25,i,f)
qvalue3 <- q1(x,n,0.75,i,f)
}
if (def==2) {
qvalue1 <- q2(x,n,0.25,i,f)
qvalue3 <- q2(x,n,0.75,i,f)
}
if (def==3) {
qvalue1 <- q3(x,n,0.25,i,f)
qvalue3 <- q3(x,n,0.75,i,f)
}
if (def==4) {
qvalue1 <- q4(x,n,0.25,i,f)
qvalue3 <- q4(x,n,0.75,i,f)
}
if (def==5) {
qvalue1 <- q5(x,n,0.25,i,f)
qvalue3 <- q5(x,n,0.75,i,f)
}
if (def==6) {
qvalue1 <- q6(x,n,0.25,i,f)
qvalue3 <- q6(x,n,0.75,i,f)
}
if (def==7) {
qvalue1 <- q7(x,n,0.25,i,f)
qvalue3 <- q7(x,n,0.75,i,f)
}
if (def==8) {
qvalue1 <- q8(x,n,0.25,i,f)
qvalue3 <- q8(x,n,0.75,i,f)
}
midm <- 0
myn <- 0
roundno4 <- round(n/4)
round3no4 <- round(3*n/4)
for (i in 1:n) {
if ((x[i]>=qvalue1) & (x[i]<=qvalue3)){
midm = midm + x[i]
myn = myn + 1
}
}
midm = midm / myn
return(midm)
}
(arm <- mean(x))
sqrtn <- sqrt(length(x))
(armse <- sd(x) / sqrtn)
(armose <- arm / armse)
(geo <- geomean(x))
(har <- harmean(x))
(qua <- quamean(x))
(win <- winmean(x))
(tri <- trimean(x))
(midr <- midrange(x))
midm <- array(NA,dim=8)
for (j in 1:8) midm[j] <- midmean(x,j)
midm
bitmap(file='test1.png')
lb <- win[,1] - 2*win[,2]
ub <- win[,1] + 2*win[,2]
if ((ylimmin == '') | (ylimmax == '')) plot(win[,1],type='b',main=main, xlab='j', pch=19, ylab='Winsorized Mean(j/n)', ylim=c(min(lb),max(ub))) else plot(win[,1],type='l',main=main, xlab='j', pch=19, ylab='Winsorized Mean(j/n)', ylim=c(ylimmin,ylimmax))
lines(ub,lty=3)
lines(lb,lty=3)
grid()
dev.off()
bitmap(file='test2.png')
lb <- tri[,1] - 2*tri[,2]
ub <- tri[,1] + 2*tri[,2]
if ((ylimmin == '') | (ylimmax == '')) plot(tri[,1],type='b',main=main, xlab='j', pch=19, ylab='Trimmed Mean(j/n)', ylim=c(min(lb),max(ub))) else plot(tri[,1],type='l',main=main, xlab='j', pch=19, ylab='Trimmed Mean(j/n)', ylim=c(ylimmin,ylimmax))
lines(ub,lty=3)
lines(lb,lty=3)
grid()
dev.off()
load(file='createtable')
a<-table.start()
a<-table.row.start(a)
a<-table.element(a,'Central Tendency - Ungrouped Data',4,TRUE)
a<-table.row.end(a)
a<-table.row.start(a)
a<-table.element(a,'Measure',header=TRUE)
a<-table.element(a,'Value',header=TRUE)
a<-table.element(a,'S.E.',header=TRUE)
a<-table.element(a,'Value/S.E.',header=TRUE)
a<-table.row.end(a)
a<-table.row.start(a)
a<-table.element(a,hyperlink('arithmetic_mean.htm', 'Arithmetic Mean', 'click to view the definition of the Arithmetic Mean'),header=TRUE)
a<-table.element(a,arm)
a<-table.element(a,hyperlink('arithmetic_mean_standard_error.htm', armse, 'click to view the definition of the Standard Error of the Arithmetic Mean'))
a<-table.element(a,armose)
a<-table.row.end(a)
a<-table.row.start(a)
a<-table.element(a,hyperlink('geometric_mean.htm', 'Geometric Mean', 'click to view the definition of the Geometric Mean'),header=TRUE)
a<-table.element(a,geo)
a<-table.element(a,'')
a<-table.row.end(a)
a<-table.row.start(a)
a<-table.element(a,hyperlink('harmonic_mean.htm', 'Harmonic Mean', 'click to view the definition of the Harmonic Mean'),header=TRUE)
a<-table.element(a,har)
a<-table.element(a,'')
a<-table.row.end(a)
a<-table.row.start(a)
a<-table.element(a,hyperlink('quadratic_mean.htm', 'Quadratic Mean', 'click to view the definition of the Quadratic Mean'),header=TRUE)
a<-table.element(a,qua)
a<-table.element(a,'')
a<-table.row.end(a)
for (j in 1:length(win[,1])) {
a<-table.row.start(a)
mylabel <- paste('Winsorized Mean (',j)
mylabel <- paste(mylabel,'/')
mylabel <- paste(mylabel,length(win[,1]))
mylabel <- paste(mylabel,')')
a<-table.element(a,hyperlink('winsorized_mean.htm', mylabel, 'click to view the definition of the Winsorized Mean'),header=TRUE)
a<-table.element(a,win[j,1])
a<-table.element(a,win[j,2])
a<-table.element(a,win[j,1]/win[j,2])
a<-table.row.end(a)
}
for (j in 1:length(tri[,1])) {
a<-table.row.start(a)
mylabel <- paste('Trimmed Mean (',j)
mylabel <- paste(mylabel,'/')
mylabel <- paste(mylabel,length(tri[,1]))
mylabel <- paste(mylabel,')')
a<-table.element(a,hyperlink('arithmetic_mean.htm', mylabel, 'click to view the definition of the Trimmed Mean'),header=TRUE)
a<-table.element(a,tri[j,1])
a<-table.element(a,tri[j,2])
a<-table.element(a,tri[j,1]/tri[j,2])
a<-table.row.end(a)
}
a<-table.row.start(a)
a<-table.element(a,hyperlink('median_1.htm', 'Median', 'click to view the definition of the Median'),header=TRUE)
a<-table.element(a,median(x))
a<-table.element(a,'')
a<-table.row.end(a)
a<-table.row.start(a)
a<-table.element(a,hyperlink('midrange.htm', 'Midrange', 'click to view the definition of the Midrange'),header=TRUE)
a<-table.element(a,midr)
a<-table.element(a,'')
a<-table.row.end(a)
a<-table.row.start(a)
mymid <- hyperlink('midmean.htm', 'Midmean', 'click to view the definition of the Midmean')
mylabel <- paste(mymid,hyperlink('method_1.htm','Weighted Average at Xnp',''),sep=' - ')
a<-table.element(a,mylabel,header=TRUE)
a<-table.element(a,midm[1])
a<-table.element(a,'')
a<-table.row.end(a)
a<-table.row.start(a)
mymid <- hyperlink('midmean.htm', 'Midmean', 'click to view the definition of the Midmean')
mylabel <- paste(mymid,hyperlink('method_2.htm','Weighted Average at X(n+1)p',''),sep=' - ')
a<-table.element(a,mylabel,header=TRUE)
a<-table.element(a,midm[2])
a<-table.element(a,'')
a<-table.row.end(a)
a<-table.row.start(a)
mymid <- hyperlink('midmean.htm', 'Midmean', 'click to view the definition of the Midmean')
mylabel <- paste(mymid,hyperlink('method_3.htm','Empirical Distribution Function',''),sep=' - ')
a<-table.element(a,mylabel,header=TRUE)
a<-table.element(a,midm[3])
a<-table.element(a,'')
a<-table.row.end(a)
a<-table.row.start(a)
mymid <- hyperlink('midmean.htm', 'Midmean', 'click to view the definition of the Midmean')
mylabel <- paste(mymid,hyperlink('method_4.htm','Empirical Distribution Function - Averaging',''),sep=' - ')
a<-table.element(a,mylabel,header=TRUE)
a<-table.element(a,midm[4])
a<-table.element(a,'')
a<-table.row.end(a)
a<-table.row.start(a)
mymid <- hyperlink('midmean.htm', 'Midmean', 'click to view the definition of the Midmean')
mylabel <- paste(mymid,hyperlink('method_5.htm','Empirical Distribution Function - Interpolation',''),sep=' - ')
a<-table.element(a,mylabel,header=TRUE)
a<-table.element(a,midm[5])
a<-table.element(a,'')
a<-table.row.end(a)
a<-table.row.start(a)
mymid <- hyperlink('midmean.htm', 'Midmean', 'click to view the definition of the Midmean')
mylabel <- paste(mymid,hyperlink('method_6.htm','Closest Observation',''),sep=' - ')
a<-table.element(a,mylabel,header=TRUE)
a<-table.element(a,midm[6])
a<-table.element(a,'')
a<-table.row.end(a)
a<-table.row.start(a)
mymid <- hyperlink('midmean.htm', 'Midmean', 'click to view the definition of the Midmean')
mylabel <- paste(mymid,hyperlink('method_7.htm','True Basic - Statistics Graphics Toolkit',''),sep=' - ')
a<-table.element(a,mylabel,header=TRUE)
a<-table.element(a,midm[7])
a<-table.element(a,'')
a<-table.row.end(a)
a<-table.row.start(a)
mymid <- hyperlink('midmean.htm', 'Midmean', 'click to view the definition of the Midmean')
mylabel <- paste(mymid,hyperlink('method_8.htm','MS Excel (old versions)',''),sep=' - ')
a<-table.element(a,mylabel,header=TRUE)
a<-table.element(a,midm[8])
a<-table.element(a,'')
a<-table.row.end(a)
a<-table.row.start(a)
a<-table.element(a,'Number of observations',header=TRUE)
a<-table.element(a,length(x))
a<-table.element(a,'')
a<-table.row.end(a)
a<-table.end(a)
table.save(a,file='mytable.tab')