Free Statistics

of Irreproducible Research!

Author's title

Author*Unverified author*
R Software Modulerwasp_correlation.wasp
Title produced by softwarePearson Correlation
Date of computationSun, 19 Oct 2008 12:07:25 -0600
Cite this page as followsStatistical Computations at FreeStatistics.org, Office for Research Development and Education, URL https://freestatistics.org/blog/index.php?v=date/2008/Oct/19/t1224439672e6wvxazezod188o.htm/, Retrieved Sun, 19 May 2024 13:37:02 +0000
Statistical Computations at FreeStatistics.org, Office for Research Development and Education, URL https://freestatistics.org/blog/index.php?pk=17018, Retrieved Sun, 19 May 2024 13:37:02 +0000
QR Codes:

Original text written by user:
IsPrivate?No (this computation is public)
User-defined keywords
Estimated Impact127
Family? (F = Feedback message, R = changed R code, M = changed R Module, P = changed Parameters, D = changed Data)
F       [Pearson Correlation] [Correlatie inflat...] [2008-10-19 18:07:25] [7f3f68cb5622d7511b280fd3e248ef1b] [Current]
Feedback Forum
2008-10-23 10:10:46 [Ellen Smolders] [reply
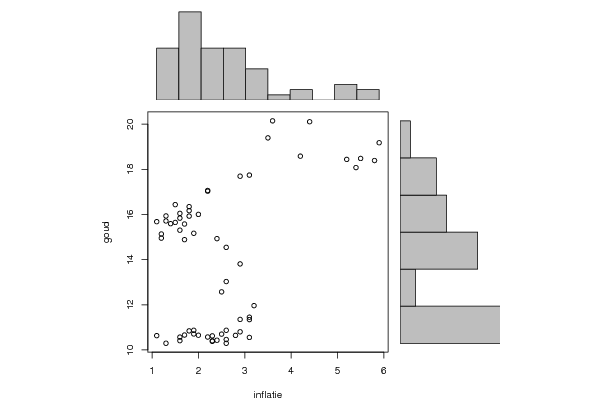
De student heeft juist geantwoord. De correlatie bedraagt inderdaad 41%, dit ligt eerder bij het nulpunt, dus de correlatie is zeer klein of bijna nihil. Dit kunnen we ook zien op de correlatiegrafiek waar de waarden geen lijn vormen en zich overal op het veld bevinden.
2008-10-24 14:13:25 [Stijn Van de Velde] [reply
Met genoeg verbeeldingskracht kan je op de grafiek inderdaad een schuine rechte zien, wat wijst op een positieve correlatie. Hier bedraagt deze positieve correlatie 41%, wat toch bijna de helft is.

De prijs van goud zal dus zeker voor bijna de helft geassocieerd worden met de inflatie.
2008-10-26 13:49:47 [Natascha Meeus] [reply
de student bekomt hier een correlatie van 0,41. Dit wil zeggen dat er een matig verband is tussen inflatie en goud.
2008-10-27 16:15:15 [Bonifer Spillemaeckers] [reply
Er valt inderdaad slechts een matige correlatie op te merken.

Post a new message
Dataseries X:
1,80
1,60
1,90
1,70
1,60
1,30
1,10
1,90
2,60
2,30
2,40
2,20
2,00
2,90
2,60
2,30
2,30
2,60
3,10
2,80
2,50
2,90
3,10
3,10
3,20
2,50
2,60
2,90
2,60
2,40
1,70
2,00
2,20
1,90
1,60
1,60
1,20
1,20
1,50
1,60
1,70
1,80
1,80
1,80
1,30
1,30
1,40
1,10
1,50
2,20
2,90
3,10
3,50
3,60
4,40
4,20
5,20
5,80
5,90
5,40
5,50
Dataseries Y:
10.846
10.413
10.709
10.662
10.570
10.297
10.635
10.872
10.296
10.383
10.431
10.574
10.653
10.805
10.872
10.625
10.407
10.463
10.556
10.646
10.702
11.353
11.346
11.451
11.964
12.574
13.031
13.812
14.544
14.931
14.886
16.005
17.064
15.168
16.050
15.839
15.137
14.954
15.648
15.305
15.579
16.348
15.928
16.171
15.937
15.713
15.594
15.683
16.438
17.032
17.696
17.745
19.394
20.148
20.108
18.584
18.441
18.391
19.178
18.079
18.483


Summary of computational transaction
Raw Inputview raw input (R code)
Raw Outputview raw output of R engine
Computing time1 seconds
R Server'Gwilym Jenkins' @ 72.249.127.135

\begin{tabular}{lllllllll}
\hline
Summary of computational transaction \tabularnewline
Raw Input & view raw input (R code)  \tabularnewline
Raw Output & view raw output of R engine  \tabularnewline
Computing time & 1 seconds \tabularnewline
R Server & 'Gwilym Jenkins' @ 72.249.127.135 \tabularnewline
\hline
\end{tabular}
%Source: https://freestatistics.org/blog/index.php?pk=17018&T=0

[TABLE]
[ROW][C]Summary of computational transaction[/C][/ROW]
[ROW][C]Raw Input[/C][C]view raw input (R code) [/C][/ROW]
[ROW][C]Raw Output[/C][C]view raw output of R engine [/C][/ROW]
[ROW][C]Computing time[/C][C]1 seconds[/C][/ROW]
[ROW][C]R Server[/C][C]'Gwilym Jenkins' @ 72.249.127.135[/C][/ROW]
[/TABLE]
Source: https://freestatistics.org/blog/index.php?pk=17018&T=0

Globally Unique Identifier (entire table): ba.freestatistics.org/blog/index.php?pk=17018&T=0

As an alternative you can also use a QR Code:  

The GUIDs for individual cells are displayed in the table below:

Summary of computational transaction
Raw Inputview raw input (R code)
Raw Outputview raw output of R engine
Computing time1 seconds
R Server'Gwilym Jenkins' @ 72.249.127.135


Pearson Product Moment Correlation - Ungrouped Data
StatisticVariable XVariable Y
Mean2.5032786885245914.1008032786885
Biased Variance1.365890889545829.86446887933351
Biased Standard Deviation1.168713347894093.14077520356576
Covariance1.54682398907104
Correlation0.414493244251956
Determination0.171804649530511
T-Test3.49846125297798
p-value (2 sided)0.000896735048512287
p-value (1 sided)0.000448367524256144
Degrees of Freedom59
Number of Observations61

\begin{tabular}{lllllllll}
\hline
Pearson Product Moment Correlation - Ungrouped Data \tabularnewline
Statistic & Variable X & Variable Y \tabularnewline
Mean & 2.50327868852459 & 14.1008032786885 \tabularnewline
Biased Variance & 1.36589088954582 & 9.86446887933351 \tabularnewline
Biased Standard Deviation & 1.16871334789409 & 3.14077520356576 \tabularnewline
Covariance & 1.54682398907104 \tabularnewline
Correlation & 0.414493244251956 \tabularnewline
Determination & 0.171804649530511 \tabularnewline
T-Test & 3.49846125297798 \tabularnewline
p-value (2 sided) & 0.000896735048512287 \tabularnewline
p-value (1 sided) & 0.000448367524256144 \tabularnewline
Degrees of Freedom & 59 \tabularnewline
Number of Observations & 61 \tabularnewline
\hline
\end{tabular}
%Source: https://freestatistics.org/blog/index.php?pk=17018&T=1

[TABLE]
[ROW][C]Pearson Product Moment Correlation - Ungrouped Data[/C][/ROW]
[ROW][C]Statistic[/C][C]Variable X[/C][C]Variable Y[/C][/ROW]
[ROW][C]Mean[/C][C]2.50327868852459[/C][C]14.1008032786885[/C][/ROW]
[ROW][C]Biased Variance[/C][C]1.36589088954582[/C][C]9.86446887933351[/C][/ROW]
[ROW][C]Biased Standard Deviation[/C][C]1.16871334789409[/C][C]3.14077520356576[/C][/ROW]
[ROW][C]Covariance[/C][C]1.54682398907104[/C][/ROW]
[ROW][C]Correlation[/C][C]0.414493244251956[/C][/ROW]
[ROW][C]Determination[/C][C]0.171804649530511[/C][/ROW]
[ROW][C]T-Test[/C][C]3.49846125297798[/C][/ROW]
[ROW][C]p-value (2 sided)[/C][C]0.000896735048512287[/C][/ROW]
[ROW][C]p-value (1 sided)[/C][C]0.000448367524256144[/C][/ROW]
[ROW][C]Degrees of Freedom[/C][C]59[/C][/ROW]
[ROW][C]Number of Observations[/C][C]61[/C][/ROW]
[/TABLE]
Source: https://freestatistics.org/blog/index.php?pk=17018&T=1

Globally Unique Identifier (entire table): ba.freestatistics.org/blog/index.php?pk=17018&T=1

As an alternative you can also use a QR Code:  

The GUIDs for individual cells are displayed in the table below:

Pearson Product Moment Correlation - Ungrouped Data
StatisticVariable XVariable Y
Mean2.5032786885245914.1008032786885
Biased Variance1.365890889545829.86446887933351
Biased Standard Deviation1.168713347894093.14077520356576
Covariance1.54682398907104
Correlation0.414493244251956
Determination0.171804649530511
T-Test3.49846125297798
p-value (2 sided)0.000896735048512287
p-value (1 sided)0.000448367524256144
Degrees of Freedom59
Number of Observations61


Parameters (Session):
Parameters (R input):
R code (references can be found in the software module):
bitmap(file='test1.png')
histx <- hist(x, plot=FALSE)
histy <- hist(y, plot=FALSE)
maxcounts <- max(c(histx$counts, histx$counts))
xrange <- c(min(x),max(x))
yrange <- c(min(y),max(y))
nf <- layout(matrix(c(2,0,1,3),2,2,byrow=TRUE), c(3,1), c(1,3), TRUE)
par(mar=c(4,4,1,1))
plot(x, y, xlim=xrange, ylim=yrange, xlab=xlab, ylab=ylab)
par(mar=c(0,4,1,1))
barplot(histx$counts, axes=FALSE, ylim=c(0, maxcounts), space=0)
par(mar=c(4,0,1,1))
barplot(histy$counts, axes=FALSE, xlim=c(0, maxcounts), space=0, horiz=TRUE)
dev.off()
lx = length(x)
makebiased = (lx-1)/lx
varx = var(x)*makebiased
vary = var(y)*makebiased
corxy <- cor.test(x,y,method='pearson')
cxy <- as.matrix(corxy$estimate)[1,1]
load(file='createtable')
a<-table.start()
a<-table.row.start(a)
a<-table.element(a,'Pearson Product Moment Correlation - Ungrouped Data',3,TRUE)
a<-table.row.end(a)
a<-table.row.start(a)
a<-table.element(a,'Statistic',1,TRUE)
a<-table.element(a,'Variable X',1,TRUE)
a<-table.element(a,'Variable Y',1,TRUE)
a<-table.row.end(a)
a<-table.row.start(a)
a<-table.element(a,hyperlink('arithmetic_mean.htm','Mean',''),header=TRUE)
a<-table.element(a,mean(x))
a<-table.element(a,mean(y))
a<-table.row.end(a)
a<-table.row.start(a)
a<-table.element(a,hyperlink('biased.htm','Biased Variance',''),header=TRUE)
a<-table.element(a,varx)
a<-table.element(a,vary)
a<-table.row.end(a)
a<-table.row.start(a)
a<-table.element(a,hyperlink('biased1.htm','Biased Standard Deviation',''),header=TRUE)
a<-table.element(a,sqrt(varx))
a<-table.element(a,sqrt(vary))
a<-table.row.end(a)
a<-table.row.start(a)
a<-table.element(a,hyperlink('covariance.htm','Covariance',''),header=TRUE)
a<-table.element(a,cov(x,y),2)
a<-table.row.end(a)
a<-table.row.start(a)
a<-table.element(a,hyperlink('pearson_correlation.htm','Correlation',''),header=TRUE)
a<-table.element(a,cxy,2)
a<-table.row.end(a)
a<-table.row.start(a)
a<-table.element(a,hyperlink('coeff_of_determination.htm','Determination',''),header=TRUE)
a<-table.element(a,cxy*cxy,2)
a<-table.row.end(a)
a<-table.row.start(a)
a<-table.element(a,hyperlink('ttest_statistic.htm','T-Test',''),header=TRUE)
a<-table.element(a,as.matrix(corxy$statistic)[1,1],2)
a<-table.row.end(a)
a<-table.row.start(a)
a<-table.element(a,'p-value (2 sided)',header=TRUE)
a<-table.element(a,(p2 <- as.matrix(corxy$p.value)[1,1]),2)
a<-table.row.end(a)
a<-table.row.start(a)
a<-table.element(a,'p-value (1 sided)',header=TRUE)
a<-table.element(a,p2/2,2)
a<-table.row.end(a)
a<-table.row.start(a)
a<-table.element(a,'Degrees of Freedom',header=TRUE)
a<-table.element(a,lx-2,2)
a<-table.row.end(a)
a<-table.row.start(a)
a<-table.element(a,'Number of Observations',header=TRUE)
a<-table.element(a,lx,2)
a<-table.row.end(a)
a<-table.end(a)
table.save(a,file='mytable.tab')