Free Statistics

of Irreproducible Research!

Author's title

Author*Unverified author*
R Software Modulerwasp_correlation.wasp
Title produced by softwarePearson Correlation
Date of computationSun, 19 Oct 2008 12:03:26 -0600
Cite this page as followsStatistical Computations at FreeStatistics.org, Office for Research Development and Education, URL https://freestatistics.org/blog/index.php?v=date/2008/Oct/19/t1224439450obxxqyk3dva8wi0.htm/, Retrieved Sun, 19 May 2024 14:55:14 +0000
Statistical Computations at FreeStatistics.org, Office for Research Development and Education, URL https://freestatistics.org/blog/index.php?pk=17015, Retrieved Sun, 19 May 2024 14:55:14 +0000
QR Codes:

Original text written by user:
IsPrivate?No (this computation is public)
User-defined keywords
Estimated Impact156
Family? (F = Feedback message, R = changed R code, M = changed R Module, P = changed Parameters, D = changed Data)
F       [Pearson Correlation] [Correlatie inflat...] [2008-10-19 18:03:26] [7f3f68cb5622d7511b280fd3e248ef1b] [Current]
Feedback Forum
2008-10-23 10:07:16 [Ellen Smolders] [reply
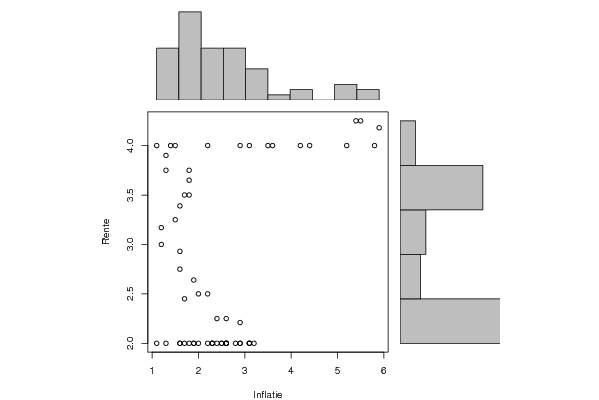
Het antwoord van de student is correct maar niet volledig. De correlatie bedraagt inderdaad slechts 34%, dit betekent dat er nauwelijks een verband bestaat tussen de twee datasets, inflatie en rente. Wat de student er bij kon vermelden is dat dit duidelijk te zien is op de correlatiegrafiek. We kunnen geen stijgende (positieve correlatie) of dalende (negatieve correlatie) afleiden uit de grafiek. We kunnen eerder visueel vaststellen dat de correlatie een evenwijdige rechte met de x-as bedraagt, dit duidt op weinig correlatie.
2008-10-24 14:10:27 [Stijn Van de Velde] [reply
De student heeft gelijk als hij zegt dat er slechts 34% correlatie is, en dat dat dus wil zeggen dat er bijna geen associatie is tussen de rente en inflatie.
Het is echter verwonderlijk dat er nog zo'n relatief hoog cijfer uit de bus komt, omdat er op de grafiek eerder een horizontale rechte, die duid op geen correlatie, tot stand komt.
2008-10-26 13:48:26 [Natascha Meeus] [reply
De student kwam uit op een correlatie van 0,34. Deze ligt zeer dicht bij 0. Hierdoor kunnen we zeggen dat er een zwak verband is tussen inflatie en rente.
2008-10-27 16:13:22 [Bonifer Spillemaeckers] [reply
Ik ga akkoord met bovenstaande opmerkingen. Veel valt er niet meer aan toe te voegen.

Post a new message
Dataseries X:
1,80
1,60
1,90
1,70
1,60
1,30
1,10
1,90
2,60
2,30
2,40
2,20
2,00
2,90
2,60
2,30
2,30
2,60
3,10
2,80
2,50
2,90
3,10
3,10
3,20
2,50
2,60
2,90
2,60
2,40
1,70
2,00
2,20
1,90
1,60
1,60
1,20
1,20
1,50
1,60
1,70
1,80
1,80
1,80
1,30
1,30
1,40
1,10
1,50
2,20
2,90
3,10
3,50
3,60
4,40
4,20
5,20
5,80
5,90
5,40
5,50
Dataseries Y:
2,00
2,00
2,00
2,00
2,00
2,00
2,00
2,00
2,00
2,00
2,00
2,00
2,00
2,00
2,00
2,00
2,00
2,00
2,00
2,00
2,00
2,00
2,00
2,00
2,00
2,00
2,00
2,21
2,25
2,25
2,45
2,50
2,50
2,64
2,75
2,93
3,00
3,17
3,25
3,39
3,50
3,50
3,65
3,75
3,75
3,90
4,00
4,00
4,00
4,00
4,00
4,00
4,00
4,00
4,00
4,00
4,00
4,00
4,18
4,25
4,25


Summary of computational transaction
Raw Inputview raw input (R code)
Raw Outputview raw output of R engine
Computing time1 seconds
R Server'Gwilym Jenkins' @ 72.249.127.135

\begin{tabular}{lllllllll}
\hline
Summary of computational transaction \tabularnewline
Raw Input & view raw input (R code)  \tabularnewline
Raw Output & view raw output of R engine  \tabularnewline
Computing time & 1 seconds \tabularnewline
R Server & 'Gwilym Jenkins' @ 72.249.127.135 \tabularnewline
\hline
\end{tabular}
%Source: https://freestatistics.org/blog/index.php?pk=17015&T=0

[TABLE]
[ROW][C]Summary of computational transaction[/C][/ROW]
[ROW][C]Raw Input[/C][C]view raw input (R code) [/C][/ROW]
[ROW][C]Raw Output[/C][C]view raw output of R engine [/C][/ROW]
[ROW][C]Computing time[/C][C]1 seconds[/C][/ROW]
[ROW][C]R Server[/C][C]'Gwilym Jenkins' @ 72.249.127.135[/C][/ROW]
[/TABLE]
Source: https://freestatistics.org/blog/index.php?pk=17015&T=0

Globally Unique Identifier (entire table): ba.freestatistics.org/blog/index.php?pk=17015&T=0

As an alternative you can also use a QR Code:  

The GUIDs for individual cells are displayed in the table below:

Summary of computational transaction
Raw Inputview raw input (R code)
Raw Outputview raw output of R engine
Computing time1 seconds
R Server'Gwilym Jenkins' @ 72.249.127.135


Pearson Product Moment Correlation - Ungrouped Data
StatisticVariable XVariable Y
Mean2.503278688524592.82
Biased Variance1.365890889545820.776895081967213
Biased Standard Deviation1.168713347894090.881416520135182
Covariance0.356983333333333
Correlation0.340863238270547
Determination0.116187747204284
T-Test2.78500617420313
p-value (2 sided)0.0071844300553423
p-value (1 sided)0.00359221502767115
Degrees of Freedom59
Number of Observations61

\begin{tabular}{lllllllll}
\hline
Pearson Product Moment Correlation - Ungrouped Data \tabularnewline
Statistic & Variable X & Variable Y \tabularnewline
Mean & 2.50327868852459 & 2.82 \tabularnewline
Biased Variance & 1.36589088954582 & 0.776895081967213 \tabularnewline
Biased Standard Deviation & 1.16871334789409 & 0.881416520135182 \tabularnewline
Covariance & 0.356983333333333 \tabularnewline
Correlation & 0.340863238270547 \tabularnewline
Determination & 0.116187747204284 \tabularnewline
T-Test & 2.78500617420313 \tabularnewline
p-value (2 sided) & 0.0071844300553423 \tabularnewline
p-value (1 sided) & 0.00359221502767115 \tabularnewline
Degrees of Freedom & 59 \tabularnewline
Number of Observations & 61 \tabularnewline
\hline
\end{tabular}
%Source: https://freestatistics.org/blog/index.php?pk=17015&T=1

[TABLE]
[ROW][C]Pearson Product Moment Correlation - Ungrouped Data[/C][/ROW]
[ROW][C]Statistic[/C][C]Variable X[/C][C]Variable Y[/C][/ROW]
[ROW][C]Mean[/C][C]2.50327868852459[/C][C]2.82[/C][/ROW]
[ROW][C]Biased Variance[/C][C]1.36589088954582[/C][C]0.776895081967213[/C][/ROW]
[ROW][C]Biased Standard Deviation[/C][C]1.16871334789409[/C][C]0.881416520135182[/C][/ROW]
[ROW][C]Covariance[/C][C]0.356983333333333[/C][/ROW]
[ROW][C]Correlation[/C][C]0.340863238270547[/C][/ROW]
[ROW][C]Determination[/C][C]0.116187747204284[/C][/ROW]
[ROW][C]T-Test[/C][C]2.78500617420313[/C][/ROW]
[ROW][C]p-value (2 sided)[/C][C]0.0071844300553423[/C][/ROW]
[ROW][C]p-value (1 sided)[/C][C]0.00359221502767115[/C][/ROW]
[ROW][C]Degrees of Freedom[/C][C]59[/C][/ROW]
[ROW][C]Number of Observations[/C][C]61[/C][/ROW]
[/TABLE]
Source: https://freestatistics.org/blog/index.php?pk=17015&T=1

Globally Unique Identifier (entire table): ba.freestatistics.org/blog/index.php?pk=17015&T=1

As an alternative you can also use a QR Code:  

The GUIDs for individual cells are displayed in the table below:

Pearson Product Moment Correlation - Ungrouped Data
StatisticVariable XVariable Y
Mean2.503278688524592.82
Biased Variance1.365890889545820.776895081967213
Biased Standard Deviation1.168713347894090.881416520135182
Covariance0.356983333333333
Correlation0.340863238270547
Determination0.116187747204284
T-Test2.78500617420313
p-value (2 sided)0.0071844300553423
p-value (1 sided)0.00359221502767115
Degrees of Freedom59
Number of Observations61


Parameters (Session):
Parameters (R input):
R code (references can be found in the software module):
bitmap(file='test1.png')
histx <- hist(x, plot=FALSE)
histy <- hist(y, plot=FALSE)
maxcounts <- max(c(histx$counts, histx$counts))
xrange <- c(min(x),max(x))
yrange <- c(min(y),max(y))
nf <- layout(matrix(c(2,0,1,3),2,2,byrow=TRUE), c(3,1), c(1,3), TRUE)
par(mar=c(4,4,1,1))
plot(x, y, xlim=xrange, ylim=yrange, xlab=xlab, ylab=ylab)
par(mar=c(0,4,1,1))
barplot(histx$counts, axes=FALSE, ylim=c(0, maxcounts), space=0)
par(mar=c(4,0,1,1))
barplot(histy$counts, axes=FALSE, xlim=c(0, maxcounts), space=0, horiz=TRUE)
dev.off()
lx = length(x)
makebiased = (lx-1)/lx
varx = var(x)*makebiased
vary = var(y)*makebiased
corxy <- cor.test(x,y,method='pearson')
cxy <- as.matrix(corxy$estimate)[1,1]
load(file='createtable')
a<-table.start()
a<-table.row.start(a)
a<-table.element(a,'Pearson Product Moment Correlation - Ungrouped Data',3,TRUE)
a<-table.row.end(a)
a<-table.row.start(a)
a<-table.element(a,'Statistic',1,TRUE)
a<-table.element(a,'Variable X',1,TRUE)
a<-table.element(a,'Variable Y',1,TRUE)
a<-table.row.end(a)
a<-table.row.start(a)
a<-table.element(a,hyperlink('arithmetic_mean.htm','Mean',''),header=TRUE)
a<-table.element(a,mean(x))
a<-table.element(a,mean(y))
a<-table.row.end(a)
a<-table.row.start(a)
a<-table.element(a,hyperlink('biased.htm','Biased Variance',''),header=TRUE)
a<-table.element(a,varx)
a<-table.element(a,vary)
a<-table.row.end(a)
a<-table.row.start(a)
a<-table.element(a,hyperlink('biased1.htm','Biased Standard Deviation',''),header=TRUE)
a<-table.element(a,sqrt(varx))
a<-table.element(a,sqrt(vary))
a<-table.row.end(a)
a<-table.row.start(a)
a<-table.element(a,hyperlink('covariance.htm','Covariance',''),header=TRUE)
a<-table.element(a,cov(x,y),2)
a<-table.row.end(a)
a<-table.row.start(a)
a<-table.element(a,hyperlink('pearson_correlation.htm','Correlation',''),header=TRUE)
a<-table.element(a,cxy,2)
a<-table.row.end(a)
a<-table.row.start(a)
a<-table.element(a,hyperlink('coeff_of_determination.htm','Determination',''),header=TRUE)
a<-table.element(a,cxy*cxy,2)
a<-table.row.end(a)
a<-table.row.start(a)
a<-table.element(a,hyperlink('ttest_statistic.htm','T-Test',''),header=TRUE)
a<-table.element(a,as.matrix(corxy$statistic)[1,1],2)
a<-table.row.end(a)
a<-table.row.start(a)
a<-table.element(a,'p-value (2 sided)',header=TRUE)
a<-table.element(a,(p2 <- as.matrix(corxy$p.value)[1,1]),2)
a<-table.row.end(a)
a<-table.row.start(a)
a<-table.element(a,'p-value (1 sided)',header=TRUE)
a<-table.element(a,p2/2,2)
a<-table.row.end(a)
a<-table.row.start(a)
a<-table.element(a,'Degrees of Freedom',header=TRUE)
a<-table.element(a,lx-2,2)
a<-table.row.end(a)
a<-table.row.start(a)
a<-table.element(a,'Number of Observations',header=TRUE)
a<-table.element(a,lx,2)
a<-table.row.end(a)
a<-table.end(a)
table.save(a,file='mytable.tab')