Free Statistics

of Irreproducible Research!

Author's title

Author*Unverified author*
R Software Modulerwasp_correlation.wasp
Title produced by softwarePearson Correlation
Date of computationSun, 19 Oct 2008 11:45:57 -0600
Cite this page as followsStatistical Computations at FreeStatistics.org, Office for Research Development and Education, URL https://freestatistics.org/blog/index.php?v=date/2008/Oct/19/t12244384269zibx8mzfv38uzp.htm/, Retrieved Sun, 19 May 2024 13:04:50 +0000
Statistical Computations at FreeStatistics.org, Office for Research Development and Education, URL https://freestatistics.org/blog/index.php?pk=17005, Retrieved Sun, 19 May 2024 13:04:50 +0000
QR Codes:

Original text written by user:
IsPrivate?No (this computation is public)
User-defined keywords
Estimated Impact142
Family? (F = Feedback message, R = changed R code, M = changed R Module, P = changed Parameters, D = changed Data)
F       [Pearson Correlation] [Correlatieverband...] [2008-10-19 17:45:57] [701cc898ddafddb72d72f8df86ee2872] [Current]
Feedback Forum
2008-10-22 14:32:03 [Kim Wester] [reply
Correct.
2008-10-24 15:31:39 [Matthieu Blondeau] [reply
Ik zet hier mijn commentaar voor alle vergelijkingen. De student heeft alle reeksen met elkaar vergeleken wat een goed overzicht geeft. Hij heeft hiervoor telkens de correlatie vermeldt. Er ontbreekt misschien wel een verklaring waarom dit het geval is.
2008-10-25 18:45:30 [Kevin Neelen] [reply
De student heeft alle tijdreeksen met elkaar vergeleken en telkens de correllation berekend om te kijken hoe groot het verband tussen de vergeleken reeksen is. Dit is telkens correct gebeurd maar de uitleg is telkens zeer kort. Er staat gewoon wat de correlatie is met vermelding van sterk/zwak verband. Het had beter geweest als er telkens had bijgestaan waaromp het verband sterk of zwak is om zo duidelijk te zien dat de student de betekenis van verschillende correlaties kent (en niet zomaar een gokje waagt of er een sterk of zwak verband bestaat tussen verschillende reeksen).
2008-10-27 08:29:03 [Siem Van Opstal] [reply
de student maakt een juiste berekening en trekt de juiste conclusie maar en ontbreekt een verklaring voor de tijdreeks.
2008-10-27 19:16:52 [Evelyne Slegers] [reply
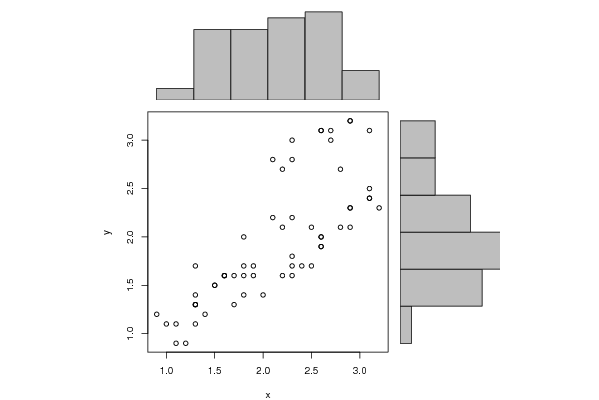
De juiste techniek werd gebruikt en de correcte berekening gemaakt. Er hadden nog wel enkele extra dingen vermeld kunnen worden. Bijvoorbeeld dat er sprake is van stijgende correlatie. De meeste punten vallen op een rechte. De twee datasets hebben een oorzakelijk verband.

Post a new message
Dataseries X:
2.2
2.3
2.1
2.8
3.1
2.9
2.6
2.7
2.3
2.3
2.1
2.2
2.9
2.6
2.7
1.8
1.3
0.9
1.3
1.3
1.3
1.3
1.1
1.4
1.2
1.7
1.8
1.5
1
1.6
1.5
1.8
1.8
1.6
1.9
1.7
1.6
1.3
1.1
1.9
2.6
2.3
2.4
2.2
2
2.9
2.6
2.3
2.3
2.6
3.1
2.8
2.5
2.9
3.1
3.1
3.2
2.5
2.6
2.9
Dataseries Y:
2.1
2.2
2.2
2.7
3.1
3.2
3.1
3.1
2.8
3
2.8
2.7
3.2
3.1
3
2
1.7
1.2
1.4
1.3
1.3
1.1
0.9
1.2
0.9
1.3
1.4
1.5
1.1
1.6
1.5
1.6
1.7
1.6
1.7
1.6
1.6
1.3
1.1
1.6
1.9
1.6
1.7
1.6
1.4
2.1
1.9
1.7
1.8
2
2.5
2.1
2.1
2.3
2.4
2.4
2.3
1.7
2
2.3


Summary of computational transaction
Raw Inputview raw input (R code)
Raw Outputview raw output of R engine
Computing time1 seconds
R Server'George Udny Yule' @ 72.249.76.132

\begin{tabular}{lllllllll}
\hline
Summary of computational transaction \tabularnewline
Raw Input & view raw input (R code)  \tabularnewline
Raw Output & view raw output of R engine  \tabularnewline
Computing time & 1 seconds \tabularnewline
R Server & 'George Udny Yule' @ 72.249.76.132 \tabularnewline
\hline
\end{tabular}
%Source: https://freestatistics.org/blog/index.php?pk=17005&T=0

[TABLE]
[ROW][C]Summary of computational transaction[/C][/ROW]
[ROW][C]Raw Input[/C][C]view raw input (R code) [/C][/ROW]
[ROW][C]Raw Output[/C][C]view raw output of R engine [/C][/ROW]
[ROW][C]Computing time[/C][C]1 seconds[/C][/ROW]
[ROW][C]R Server[/C][C]'George Udny Yule' @ 72.249.76.132[/C][/ROW]
[/TABLE]
Source: https://freestatistics.org/blog/index.php?pk=17005&T=0

Globally Unique Identifier (entire table): ba.freestatistics.org/blog/index.php?pk=17005&T=0

As an alternative you can also use a QR Code:  

The GUIDs for individual cells are displayed in the table below:

Summary of computational transaction
Raw Inputview raw input (R code)
Raw Outputview raw output of R engine
Computing time1 seconds
R Server'George Udny Yule' @ 72.249.76.132


Pearson Product Moment Correlation - Ungrouped Data
StatisticVariable XVariable Y
Mean2.123333333333331.955
Biased Variance0.4047888888888890.406141666666667
Biased Standard Deviation0.6362302168939230.637292449874205
Covariance0.322593220338983
Correlation0.78235332451912
Determination0.612076724386120
T-Test9.5663003030846
p-value (2 sided)1.56319401867222e-13
p-value (1 sided)7.8159700933611e-14
Degrees of Freedom58
Number of Observations60

\begin{tabular}{lllllllll}
\hline
Pearson Product Moment Correlation - Ungrouped Data \tabularnewline
Statistic & Variable X & Variable Y \tabularnewline
Mean & 2.12333333333333 & 1.955 \tabularnewline
Biased Variance & 0.404788888888889 & 0.406141666666667 \tabularnewline
Biased Standard Deviation & 0.636230216893923 & 0.637292449874205 \tabularnewline
Covariance & 0.322593220338983 \tabularnewline
Correlation & 0.78235332451912 \tabularnewline
Determination & 0.612076724386120 \tabularnewline
T-Test & 9.5663003030846 \tabularnewline
p-value (2 sided) & 1.56319401867222e-13 \tabularnewline
p-value (1 sided) & 7.8159700933611e-14 \tabularnewline
Degrees of Freedom & 58 \tabularnewline
Number of Observations & 60 \tabularnewline
\hline
\end{tabular}
%Source: https://freestatistics.org/blog/index.php?pk=17005&T=1

[TABLE]
[ROW][C]Pearson Product Moment Correlation - Ungrouped Data[/C][/ROW]
[ROW][C]Statistic[/C][C]Variable X[/C][C]Variable Y[/C][/ROW]
[ROW][C]Mean[/C][C]2.12333333333333[/C][C]1.955[/C][/ROW]
[ROW][C]Biased Variance[/C][C]0.404788888888889[/C][C]0.406141666666667[/C][/ROW]
[ROW][C]Biased Standard Deviation[/C][C]0.636230216893923[/C][C]0.637292449874205[/C][/ROW]
[ROW][C]Covariance[/C][C]0.322593220338983[/C][/ROW]
[ROW][C]Correlation[/C][C]0.78235332451912[/C][/ROW]
[ROW][C]Determination[/C][C]0.612076724386120[/C][/ROW]
[ROW][C]T-Test[/C][C]9.5663003030846[/C][/ROW]
[ROW][C]p-value (2 sided)[/C][C]1.56319401867222e-13[/C][/ROW]
[ROW][C]p-value (1 sided)[/C][C]7.8159700933611e-14[/C][/ROW]
[ROW][C]Degrees of Freedom[/C][C]58[/C][/ROW]
[ROW][C]Number of Observations[/C][C]60[/C][/ROW]
[/TABLE]
Source: https://freestatistics.org/blog/index.php?pk=17005&T=1

Globally Unique Identifier (entire table): ba.freestatistics.org/blog/index.php?pk=17005&T=1

As an alternative you can also use a QR Code:  

The GUIDs for individual cells are displayed in the table below:

Pearson Product Moment Correlation - Ungrouped Data
StatisticVariable XVariable Y
Mean2.123333333333331.955
Biased Variance0.4047888888888890.406141666666667
Biased Standard Deviation0.6362302168939230.637292449874205
Covariance0.322593220338983
Correlation0.78235332451912
Determination0.612076724386120
T-Test9.5663003030846
p-value (2 sided)1.56319401867222e-13
p-value (1 sided)7.8159700933611e-14
Degrees of Freedom58
Number of Observations60


Parameters (Session):
Parameters (R input):
R code (references can be found in the software module):
bitmap(file='test1.png')
histx <- hist(x, plot=FALSE)
histy <- hist(y, plot=FALSE)
maxcounts <- max(c(histx$counts, histx$counts))
xrange <- c(min(x),max(x))
yrange <- c(min(y),max(y))
nf <- layout(matrix(c(2,0,1,3),2,2,byrow=TRUE), c(3,1), c(1,3), TRUE)
par(mar=c(4,4,1,1))
plot(x, y, xlim=xrange, ylim=yrange, xlab=xlab, ylab=ylab)
par(mar=c(0,4,1,1))
barplot(histx$counts, axes=FALSE, ylim=c(0, maxcounts), space=0)
par(mar=c(4,0,1,1))
barplot(histy$counts, axes=FALSE, xlim=c(0, maxcounts), space=0, horiz=TRUE)
dev.off()
lx = length(x)
makebiased = (lx-1)/lx
varx = var(x)*makebiased
vary = var(y)*makebiased
corxy <- cor.test(x,y,method='pearson')
cxy <- as.matrix(corxy$estimate)[1,1]
load(file='createtable')
a<-table.start()
a<-table.row.start(a)
a<-table.element(a,'Pearson Product Moment Correlation - Ungrouped Data',3,TRUE)
a<-table.row.end(a)
a<-table.row.start(a)
a<-table.element(a,'Statistic',1,TRUE)
a<-table.element(a,'Variable X',1,TRUE)
a<-table.element(a,'Variable Y',1,TRUE)
a<-table.row.end(a)
a<-table.row.start(a)
a<-table.element(a,hyperlink('arithmetic_mean.htm','Mean',''),header=TRUE)
a<-table.element(a,mean(x))
a<-table.element(a,mean(y))
a<-table.row.end(a)
a<-table.row.start(a)
a<-table.element(a,hyperlink('biased.htm','Biased Variance',''),header=TRUE)
a<-table.element(a,varx)
a<-table.element(a,vary)
a<-table.row.end(a)
a<-table.row.start(a)
a<-table.element(a,hyperlink('biased1.htm','Biased Standard Deviation',''),header=TRUE)
a<-table.element(a,sqrt(varx))
a<-table.element(a,sqrt(vary))
a<-table.row.end(a)
a<-table.row.start(a)
a<-table.element(a,hyperlink('covariance.htm','Covariance',''),header=TRUE)
a<-table.element(a,cov(x,y),2)
a<-table.row.end(a)
a<-table.row.start(a)
a<-table.element(a,hyperlink('pearson_correlation.htm','Correlation',''),header=TRUE)
a<-table.element(a,cxy,2)
a<-table.row.end(a)
a<-table.row.start(a)
a<-table.element(a,hyperlink('coeff_of_determination.htm','Determination',''),header=TRUE)
a<-table.element(a,cxy*cxy,2)
a<-table.row.end(a)
a<-table.row.start(a)
a<-table.element(a,hyperlink('ttest_statistic.htm','T-Test',''),header=TRUE)
a<-table.element(a,as.matrix(corxy$statistic)[1,1],2)
a<-table.row.end(a)
a<-table.row.start(a)
a<-table.element(a,'p-value (2 sided)',header=TRUE)
a<-table.element(a,(p2 <- as.matrix(corxy$p.value)[1,1]),2)
a<-table.row.end(a)
a<-table.row.start(a)
a<-table.element(a,'p-value (1 sided)',header=TRUE)
a<-table.element(a,p2/2,2)
a<-table.row.end(a)
a<-table.row.start(a)
a<-table.element(a,'Degrees of Freedom',header=TRUE)
a<-table.element(a,lx-2,2)
a<-table.row.end(a)
a<-table.row.start(a)
a<-table.element(a,'Number of Observations',header=TRUE)
a<-table.element(a,lx,2)
a<-table.row.end(a)
a<-table.end(a)
table.save(a,file='mytable.tab')