Free Statistics
of Irreproducible Research!
Description of Statistical Computation | |||||||||||||||||||||||||||||||||||||||||
|---|---|---|---|---|---|---|---|---|---|---|---|---|---|---|---|---|---|---|---|---|---|---|---|---|---|---|---|---|---|---|---|---|---|---|---|---|---|---|---|---|---|
| Author's title | |||||||||||||||||||||||||||||||||||||||||
| Author | *The author of this computation has been verified* | ||||||||||||||||||||||||||||||||||||||||
| R Software Module | rwasp_univariatedataseries.wasp | ||||||||||||||||||||||||||||||||||||||||
| Title produced by software | Univariate Data Series | ||||||||||||||||||||||||||||||||||||||||
| Date of computation | Sun, 19 Oct 2008 11:21:24 -0600 | ||||||||||||||||||||||||||||||||||||||||
| Cite this page as follows | Statistical Computations at FreeStatistics.org, Office for Research Development and Education, URL https://freestatistics.org/blog/index.php?v=date/2008/Oct/19/t1224437143vvux8s6uc2n2q3s.htm/, Retrieved Sun, 19 May 2024 14:54:13 +0000 | ||||||||||||||||||||||||||||||||||||||||
| Statistical Computations at FreeStatistics.org, Office for Research Development and Education, URL https://freestatistics.org/blog/index.php?pk=16979, Retrieved Sun, 19 May 2024 14:54:13 +0000 | |||||||||||||||||||||||||||||||||||||||||
| QR Codes: | |||||||||||||||||||||||||||||||||||||||||
|
| |||||||||||||||||||||||||||||||||||||||||
| Original text written by user: | Algemene Directie Statistiek en Economische Informatie van de FOD Economie | ||||||||||||||||||||||||||||||||||||||||
| IsPrivate? | No (this computation is public) | ||||||||||||||||||||||||||||||||||||||||
| User-defined keywords | |||||||||||||||||||||||||||||||||||||||||
| Estimated Impact | 169 | ||||||||||||||||||||||||||||||||||||||||
Tree of Dependent Computations | |||||||||||||||||||||||||||||||||||||||||
| Family? (F = Feedback message, R = changed R code, M = changed R Module, P = changed Parameters, D = changed Data) | |||||||||||||||||||||||||||||||||||||||||
| F [Univariate Data Series] [blog 1e tijdreeks...] [2008-10-13 19:23:31] [7173087adebe3e3a714c80ea2417b3eb] - PD [Univariate Data Series] [tijdreeksen opnie...] [2008-10-19 17:21:24] [95d95b0e883740fcbc85e18ec42dcafb] [Current] - RMP [Central Tendency] [tijdreeks 3 centr...] [2008-10-19 17:36:46] [7173087adebe3e3a714c80ea2417b3eb] - RMP [Stem-and-leaf Plot] [tijdreeks 3 stem ...] [2008-10-19 18:12:34] [7173087adebe3e3a714c80ea2417b3eb] - RMPD [Percentiles] [percentiles reeks 3] [2008-10-19 18:52:57] [7173087adebe3e3a714c80ea2417b3eb] - PD [Univariate Data Series] [tijdreeksen opnie...] [2008-10-19 19:01:42] [7173087adebe3e3a714c80ea2417b3eb] - RM [Harrell-Davis Quantiles] [harrel and davis ...] [2008-10-19 19:18:10] [7173087adebe3e3a714c80ea2417b3eb] - RMP [Mean Plot] [mean plot reeks 3] [2008-11-02 16:28:53] [7173087adebe3e3a714c80ea2417b3eb] - RMPD [Central Tendency] [back to back reek...] [2008-12-12 12:50:01] [7173087adebe3e3a714c80ea2417b3eb] - RMPD [Central Tendency] [central tendency ...] [2008-10-19 19:04:35] [7173087adebe3e3a714c80ea2417b3eb] - RMPD [Stem-and-leaf Plot] [stem and leaf ree...] [2008-10-19 19:07:31] [7173087adebe3e3a714c80ea2417b3eb] | |||||||||||||||||||||||||||||||||||||||||
| Feedback Forum | |||||||||||||||||||||||||||||||||||||||||
Post a new message | |||||||||||||||||||||||||||||||||||||||||
Dataset | |||||||||||||||||||||||||||||||||||||||||
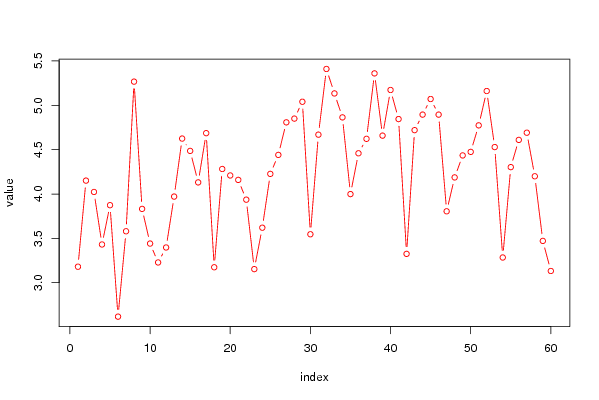
| Dataseries X: | |||||||||||||||||||||||||||||||||||||||||
3.180 4.151 4.023 3.431 3.874 2.617 3.580 5.267 3.832 3.441 3.228 3.397 3.971 4.625 4.486 4.131 4.686 3.174 4.282 4.209 4.159 3.936 3.153 3.620 4.227 4.441 4.808 4.850 5.040 3.546 4.669 5.410 5.134 4.864 3.999 4.459 4.622 5.360 4.658 5.173 4.845 3.325 4.720 4.895 5.071 4.895 3.805 4.187 4.435 4.475 4.774 5.161 4.529 3.284 4.303 4.610 4.691 4.200 3.471 3.132 | |||||||||||||||||||||||||||||||||||||||||
Tables (Output of Computation) | |||||||||||||||||||||||||||||||||||||||||
| |||||||||||||||||||||||||||||||||||||||||
Figures (Output of Computation) | |||||||||||||||||||||||||||||||||||||||||
Input Parameters & R Code | |||||||||||||||||||||||||||||||||||||||||
| Parameters (Session): | |||||||||||||||||||||||||||||||||||||||||
| par1 = Werkelijk begonnen woongebouwen - koninkrijk, Aantal woningen ; par2 = Algemene Directie Statistiek en Economische Informatie van de FOD Economie ; | |||||||||||||||||||||||||||||||||||||||||
| Parameters (R input): | |||||||||||||||||||||||||||||||||||||||||
| par1 = Werkelijk begonnen woongebouwen - koninkrijk, Aantal woningen ; par2 = Algemene Directie Statistiek en Economische Informatie van de FOD Economie ; par3 = ; | |||||||||||||||||||||||||||||||||||||||||
| R code (references can be found in the software module): | |||||||||||||||||||||||||||||||||||||||||
bitmap(file='test1.png') | |||||||||||||||||||||||||||||||||||||||||