Free Statistics
of Irreproducible Research!
Description of Statistical Computation | |||||||||||||||||||||
|---|---|---|---|---|---|---|---|---|---|---|---|---|---|---|---|---|---|---|---|---|---|
| Author's title | |||||||||||||||||||||
| Author | *Unverified author* | ||||||||||||||||||||
| R Software Module | rwasp_backtobackhist.wasp | ||||||||||||||||||||
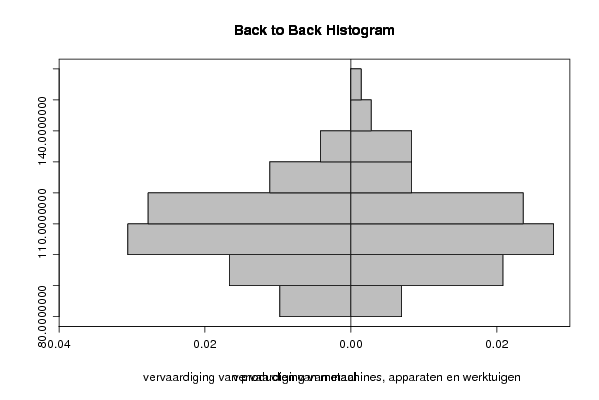
| Title produced by software | Back to Back Histogram | ||||||||||||||||||||
| Date of computation | Sun, 19 Oct 2008 10:56:36 -0600 | ||||||||||||||||||||
| Cite this page as follows | Statistical Computations at FreeStatistics.org, Office for Research Development and Education, URL https://freestatistics.org/blog/index.php?v=date/2008/Oct/19/t1224435467gwcb11y8qgx9ang.htm/, Retrieved Sun, 19 May 2024 15:36:20 +0000 | ||||||||||||||||||||
| Statistical Computations at FreeStatistics.org, Office for Research Development and Education, URL https://freestatistics.org/blog/index.php?pk=16955, Retrieved Sun, 19 May 2024 15:36:20 +0000 | |||||||||||||||||||||
| QR Codes: | |||||||||||||||||||||
|
| |||||||||||||||||||||
| Original text written by user: | |||||||||||||||||||||
| IsPrivate? | No (this computation is public) | ||||||||||||||||||||
| User-defined keywords | q8, back-to-back histogram | ||||||||||||||||||||
| Estimated Impact | 144 | ||||||||||||||||||||
Tree of Dependent Computations | |||||||||||||||||||||
| Family? (F = Feedback message, R = changed R code, M = changed R Module, P = changed Parameters, D = changed Data) | |||||||||||||||||||||
| F [Back to Back Histogram] [Investigating ass...] [2008-10-19 16:56:36] [c577d4c76516de948d1234ed72fcf120] [Current] | |||||||||||||||||||||
| Feedback Forum | |||||||||||||||||||||
Post a new message | |||||||||||||||||||||
Dataset | |||||||||||||||||||||
| Dataseries X: | |||||||||||||||||||||
97.3 101 113.2 101 105.7 113.9 86.4 96.5 103.3 114.9 105.8 94.2 98.4 99.4 108.8 112.6 104.4 112.2 81.1 97.1 112.6 113.8 107.8 103.2 103.3 101.2 107.7 110.4 101.9 115.9 89.9 88.6 117.2 123.9 100 103.6 94.1 98.7 119.5 112.7 104.4 124.7 89.1 97 121.6 118.8 114 111.5 97.2 102.5 113.4 109.8 104.9 126.1 80 96.8 117.2 112.3 117.3 111.1 102.2 104.3 122.9 107.6 121.3 131.5 89 104.4 128.9 135.9 133.3 121.3 | |||||||||||||||||||||
| Dataseries Y: | |||||||||||||||||||||
93.5 94.7 112.9 99.2 105.6 113 83.1 81.1 96.9 104.3 97.7 102.6 89.9 96 112.7 107.1 106.2 121 101.2 83.2 105.1 113.3 99.1 100.3 93.5 98.8 106.2 98.3 102.1 117.1 101.5 80.5 105.9 109.5 97.2 114.5 93.5 100.9 121.1 116.5 109.3 118.1 108.3 105.4 116.2 111.2 105.8 122.7 99.5 107.9 124.6 115 110.3 132.7 99.7 96.5 118.7 112.9 130.5 137.9 115 116.8 140.9 120.7 134.2 147.3 112.4 107.1 128.4 137.7 135 151 | |||||||||||||||||||||
Tables (Output of Computation) | |||||||||||||||||||||
| |||||||||||||||||||||
Figures (Output of Computation) | |||||||||||||||||||||
Input Parameters & R Code | |||||||||||||||||||||
| Parameters (Session): | |||||||||||||||||||||
| par1 = grey ; par2 = grey ; par3 = TRUE ; par4 = vervaardiging van producten van metaal ; par5 = vervaardiging van machines, apparaten en werktuigen ; | |||||||||||||||||||||
| Parameters (R input): | |||||||||||||||||||||
| par1 = grey ; par2 = grey ; par3 = TRUE ; par4 = vervaardiging van producten van metaal ; par5 = vervaardiging van machines, apparaten en werktuigen ; | |||||||||||||||||||||
| R code (references can be found in the software module): | |||||||||||||||||||||
if (par3 == 'TRUE') par3 <- TRUE | |||||||||||||||||||||