Free Statistics

of Irreproducible Research!

Author's title

Author*The author of this computation has been verified*
R Software Modulerwasp_percentiles.wasp
Title produced by softwarePercentiles
Date of computationSun, 19 Oct 2008 10:54:16 -0600
Cite this page as followsStatistical Computations at FreeStatistics.org, Office for Research Development and Education, URL https://freestatistics.org/blog/index.php?v=date/2008/Oct/19/t1224435395p61ourk868e4iuw.htm/, Retrieved Sun, 19 May 2024 15:37:20 +0000
Statistical Computations at FreeStatistics.org, Office for Research Development and Education, URL https://freestatistics.org/blog/index.php?pk=16954, Retrieved Sun, 19 May 2024 15:37:20 +0000
QR Codes:

Original text written by user:
IsPrivate?No (this computation is public)
User-defined keywords
Estimated Impact131
Family? (F = Feedback message, R = changed R code, M = changed R Module, P = changed Parameters, D = changed Data)
F       [Percentiles] [Investigating ass...] [2008-10-19 16:54:16] [708e5cce6cfef15b7edd0dea71956401] [Current]
Feedback Forum
2008-10-24 08:53:45 [Ellen Smolders] [reply
Het antwoord van de student is correct maar te beknopt. Om de 80% - betrouwbaarheidsinterval te kunnen formuleren laten we 10% wegvallen in elke staart. Er is bijgevolg 80% kans dat de waarden van de totale productie tussen 89,98 (tabel: eerste kolom, cijfer bij 0,10 = 10%) en 111,67 (tabel: eerste kolom, cijfer bij 0,90 = 90%) liggen.
2008-10-26 13:45:44 [Kevin Neelen] [reply
Een correct maar zeer beknopt anwtoord van de studente. Als er gewerkt wordt met een betrouwbaarheidsinterval van 80%, betekent dit concreet dat aan begin en uitiende van de reekse 10% wordt weggelaten. De grenzen van dit interval zijn 89,98 en 111,67 wat erip duidt dat 80% van de waarden tussen deze twee grenzen zal liggen (en dus binnen het 80%-betrouwbaarheidsinterval ligt).

Post a new message
Dataseries X:
110,40
96,40
101,90
106,20
81,00
94,70
101,00
109,40
102,30
90,70
96,20
96,10
106,00
103,10
102,00
104,70
86,00
92,10
106,90
112,60
101,70
92,00
97,40
97,00
105,40
102,70
98,10
104,50
87,40
89,90
109,80
111,70
98,60
96,90
95,10
97,00
112,70
102,90
97,40
111,40
87,40
96,80
114,10
110,30
103,90
101,60
94,60
95,90
104,70
102,80
98,10
113,90
80,90
95,70
113,20
105,90
108,80
102,30
99,00
100,70
115,50


Summary of computational transaction
Raw Inputview raw input (R code)
Raw Outputview raw output of R engine
Computing time2 seconds
R Server'Gwilym Jenkins' @ 72.249.127.135

\begin{tabular}{lllllllll}
\hline
Summary of computational transaction \tabularnewline
Raw Input & view raw input (R code)  \tabularnewline
Raw Output & view raw output of R engine  \tabularnewline
Computing time & 2 seconds \tabularnewline
R Server & 'Gwilym Jenkins' @ 72.249.127.135 \tabularnewline
\hline
\end{tabular}
%Source: https://freestatistics.org/blog/index.php?pk=16954&T=0

[TABLE]
[ROW][C]Summary of computational transaction[/C][/ROW]
[ROW][C]Raw Input[/C][C]view raw input (R code) [/C][/ROW]
[ROW][C]Raw Output[/C][C]view raw output of R engine [/C][/ROW]
[ROW][C]Computing time[/C][C]2 seconds[/C][/ROW]
[ROW][C]R Server[/C][C]'Gwilym Jenkins' @ 72.249.127.135[/C][/ROW]
[/TABLE]
Source: https://freestatistics.org/blog/index.php?pk=16954&T=0

Globally Unique Identifier (entire table): ba.freestatistics.org/blog/index.php?pk=16954&T=0

As an alternative you can also use a QR Code:  

The GUIDs for individual cells are displayed in the table below:

Summary of computational transaction
Raw Inputview raw input (R code)
Raw Outputview raw output of R engine
Computing time2 seconds
R Server'Gwilym Jenkins' @ 72.249.127.135


Percentiles - Ungrouped Data
pWeighted Average at XnpWeighted Average at X(n+1)pEmpirical Distribution FunctionEmpirical Distribution Function - AveragingEmpirical Distribution Function - InterpolationClosest ObservationTrue Basic - Statistics Graphics ToolkitMS Excel (old versions)
0.0280.92280.92481818280.980.97680.9
0.0483.283.4868686.568183.681
0.0686.92487.00887.487.487.487.486.39287.4
0.0887.487.487.487.489.487.487.487.4
0.189.9890.0690.790.790.789.990.5489.9
0.1291.11691.272929292.0290.791.42890.7
0.1492.05492.06892.192.193.192.192.03292.1
0.169494.494.694.694.6694.692.394.6
0.1894.69894.76494.794.795.0294.795.03694.7
0.295.2295.3495.795.795.795.195.4695.1
0.2295.78495.82895.995.995.9495.795.77295.9
0.2496.02896.07696.196.196.1496.195.92496.1
0.2696.18696.22496.296.296.3296.296.37696.2
0.2896.43296.54496.896.896.7296.496.65696.4
0.396.8396.8696.996.996.996.896.8496.9
0.3296.95296.9849797979796.91697
0.349797.032979797.169797.36897
0.3697.38497.497.497.497.497.497.497.4
0.3897.52697.79298.198.197.9697.497.70898.1
0.498.198.198.198.198.198.198.198.1
0.4298.4198.61698.698.698.6898.698.98498.6
0.4498.93699.476999999.6899100.22499
0.46100.718100.856101101100.88100.7100.844101
0.48101.168101.456101.6101.6101.48101101.144101.6
0.5101.65101.7101.7101.7101.7101.7101.7101.7
0.52101.844101.924101.9101.9101.92101.9101.976101.9
0.54101.994102.144102102102.12102102.156102
0.56102.3102.3102.3102.3102.3102.3102.3102.3
0.58102.452102.684102.7102.7102.62102.3102.316102.7
0.6102.76102.82102.8102.8102.8102.8102.88102.8
0.62102.882102.988102.9102.9102.94102.9103.012102.9
0.64103.132103.644103.9103.9103.42103.1103.356103.9
0.66104.056104.452104.5104.5104.26103.9103.948104.5
0.68104.596104.7104.7104.7104.66104.5104.7104.7
0.7104.7104.98104.7104.7104.7104.7105.12104.7
0.72105.344105.72105.4105.4105.5105.4105.58105.9
0.74105.914105.988106106105.94105.9105.912106
0.76106.072106.284106.2106.2106.12106106.816106.2
0.78106.606107.584106.9106.9106.76106.9108.116106.9
0.8108.42109.16108.8108.8108.8108.8109.04109.4
0.82109.408109.736109.8109.8109.48109.4109.464109.8
0.84109.92110.308110.3110.3110109.8110.392110.3
0.86110.346110.72110.4110.4110.36110.3111.08110.4
0.88111.08111.568111.4111.4111.2111.4111.532111.7
0.9111.67112.42111.7111.7111.7111.7111.88112.6
0.92112.612112.72112.7112.7112.62112.6113.18112.7
0.94112.87113.396113.2113.2112.9112.7113.704113.2
0.96113.592114.004113.9113.9113.62113.9113.996114.1
0.98114.056115.164114.1114.1114.06114.1114.436115.5

\begin{tabular}{lllllllll}
\hline
Percentiles - Ungrouped Data \tabularnewline
p & Weighted Average at Xnp & Weighted Average at X(n+1)p & Empirical Distribution Function & Empirical Distribution Function - Averaging & Empirical Distribution Function - Interpolation & Closest Observation & True Basic - Statistics Graphics Toolkit & MS Excel (old versions) \tabularnewline
0.02 & 80.922 & 80.924 & 81 & 81 & 82 & 80.9 & 80.976 & 80.9 \tabularnewline
0.04 & 83.2 & 83.4 & 86 & 86 & 86.56 & 81 & 83.6 & 81 \tabularnewline
0.06 & 86.924 & 87.008 & 87.4 & 87.4 & 87.4 & 87.4 & 86.392 & 87.4 \tabularnewline
0.08 & 87.4 & 87.4 & 87.4 & 87.4 & 89.4 & 87.4 & 87.4 & 87.4 \tabularnewline
0.1 & 89.98 & 90.06 & 90.7 & 90.7 & 90.7 & 89.9 & 90.54 & 89.9 \tabularnewline
0.12 & 91.116 & 91.272 & 92 & 92 & 92.02 & 90.7 & 91.428 & 90.7 \tabularnewline
0.14 & 92.054 & 92.068 & 92.1 & 92.1 & 93.1 & 92.1 & 92.032 & 92.1 \tabularnewline
0.16 & 94 & 94.4 & 94.6 & 94.6 & 94.66 & 94.6 & 92.3 & 94.6 \tabularnewline
0.18 & 94.698 & 94.764 & 94.7 & 94.7 & 95.02 & 94.7 & 95.036 & 94.7 \tabularnewline
0.2 & 95.22 & 95.34 & 95.7 & 95.7 & 95.7 & 95.1 & 95.46 & 95.1 \tabularnewline
0.22 & 95.784 & 95.828 & 95.9 & 95.9 & 95.94 & 95.7 & 95.772 & 95.9 \tabularnewline
0.24 & 96.028 & 96.076 & 96.1 & 96.1 & 96.14 & 96.1 & 95.924 & 96.1 \tabularnewline
0.26 & 96.186 & 96.224 & 96.2 & 96.2 & 96.32 & 96.2 & 96.376 & 96.2 \tabularnewline
0.28 & 96.432 & 96.544 & 96.8 & 96.8 & 96.72 & 96.4 & 96.656 & 96.4 \tabularnewline
0.3 & 96.83 & 96.86 & 96.9 & 96.9 & 96.9 & 96.8 & 96.84 & 96.9 \tabularnewline
0.32 & 96.952 & 96.984 & 97 & 97 & 97 & 97 & 96.916 & 97 \tabularnewline
0.34 & 97 & 97.032 & 97 & 97 & 97.16 & 97 & 97.368 & 97 \tabularnewline
0.36 & 97.384 & 97.4 & 97.4 & 97.4 & 97.4 & 97.4 & 97.4 & 97.4 \tabularnewline
0.38 & 97.526 & 97.792 & 98.1 & 98.1 & 97.96 & 97.4 & 97.708 & 98.1 \tabularnewline
0.4 & 98.1 & 98.1 & 98.1 & 98.1 & 98.1 & 98.1 & 98.1 & 98.1 \tabularnewline
0.42 & 98.41 & 98.616 & 98.6 & 98.6 & 98.68 & 98.6 & 98.984 & 98.6 \tabularnewline
0.44 & 98.936 & 99.476 & 99 & 99 & 99.68 & 99 & 100.224 & 99 \tabularnewline
0.46 & 100.718 & 100.856 & 101 & 101 & 100.88 & 100.7 & 100.844 & 101 \tabularnewline
0.48 & 101.168 & 101.456 & 101.6 & 101.6 & 101.48 & 101 & 101.144 & 101.6 \tabularnewline
0.5 & 101.65 & 101.7 & 101.7 & 101.7 & 101.7 & 101.7 & 101.7 & 101.7 \tabularnewline
0.52 & 101.844 & 101.924 & 101.9 & 101.9 & 101.92 & 101.9 & 101.976 & 101.9 \tabularnewline
0.54 & 101.994 & 102.144 & 102 & 102 & 102.12 & 102 & 102.156 & 102 \tabularnewline
0.56 & 102.3 & 102.3 & 102.3 & 102.3 & 102.3 & 102.3 & 102.3 & 102.3 \tabularnewline
0.58 & 102.452 & 102.684 & 102.7 & 102.7 & 102.62 & 102.3 & 102.316 & 102.7 \tabularnewline
0.6 & 102.76 & 102.82 & 102.8 & 102.8 & 102.8 & 102.8 & 102.88 & 102.8 \tabularnewline
0.62 & 102.882 & 102.988 & 102.9 & 102.9 & 102.94 & 102.9 & 103.012 & 102.9 \tabularnewline
0.64 & 103.132 & 103.644 & 103.9 & 103.9 & 103.42 & 103.1 & 103.356 & 103.9 \tabularnewline
0.66 & 104.056 & 104.452 & 104.5 & 104.5 & 104.26 & 103.9 & 103.948 & 104.5 \tabularnewline
0.68 & 104.596 & 104.7 & 104.7 & 104.7 & 104.66 & 104.5 & 104.7 & 104.7 \tabularnewline
0.7 & 104.7 & 104.98 & 104.7 & 104.7 & 104.7 & 104.7 & 105.12 & 104.7 \tabularnewline
0.72 & 105.344 & 105.72 & 105.4 & 105.4 & 105.5 & 105.4 & 105.58 & 105.9 \tabularnewline
0.74 & 105.914 & 105.988 & 106 & 106 & 105.94 & 105.9 & 105.912 & 106 \tabularnewline
0.76 & 106.072 & 106.284 & 106.2 & 106.2 & 106.12 & 106 & 106.816 & 106.2 \tabularnewline
0.78 & 106.606 & 107.584 & 106.9 & 106.9 & 106.76 & 106.9 & 108.116 & 106.9 \tabularnewline
0.8 & 108.42 & 109.16 & 108.8 & 108.8 & 108.8 & 108.8 & 109.04 & 109.4 \tabularnewline
0.82 & 109.408 & 109.736 & 109.8 & 109.8 & 109.48 & 109.4 & 109.464 & 109.8 \tabularnewline
0.84 & 109.92 & 110.308 & 110.3 & 110.3 & 110 & 109.8 & 110.392 & 110.3 \tabularnewline
0.86 & 110.346 & 110.72 & 110.4 & 110.4 & 110.36 & 110.3 & 111.08 & 110.4 \tabularnewline
0.88 & 111.08 & 111.568 & 111.4 & 111.4 & 111.2 & 111.4 & 111.532 & 111.7 \tabularnewline
0.9 & 111.67 & 112.42 & 111.7 & 111.7 & 111.7 & 111.7 & 111.88 & 112.6 \tabularnewline
0.92 & 112.612 & 112.72 & 112.7 & 112.7 & 112.62 & 112.6 & 113.18 & 112.7 \tabularnewline
0.94 & 112.87 & 113.396 & 113.2 & 113.2 & 112.9 & 112.7 & 113.704 & 113.2 \tabularnewline
0.96 & 113.592 & 114.004 & 113.9 & 113.9 & 113.62 & 113.9 & 113.996 & 114.1 \tabularnewline
0.98 & 114.056 & 115.164 & 114.1 & 114.1 & 114.06 & 114.1 & 114.436 & 115.5 \tabularnewline
\hline
\end{tabular}
%Source: https://freestatistics.org/blog/index.php?pk=16954&T=1

[TABLE]
[ROW][C]Percentiles - Ungrouped Data[/C][/ROW]
[ROW][C]p[/C][C]Weighted Average at Xnp[/C][C]Weighted Average at X(n+1)p[/C][C]Empirical Distribution Function[/C][C]Empirical Distribution Function - Averaging[/C][C]Empirical Distribution Function - Interpolation[/C][C]Closest Observation[/C][C]True Basic - Statistics Graphics Toolkit[/C][C]MS Excel (old versions)[/C][/ROW]
[ROW][C]0.02[/C][C]80.922[/C][C]80.924[/C][C]81[/C][C]81[/C][C]82[/C][C]80.9[/C][C]80.976[/C][C]80.9[/C][/ROW]
[ROW][C]0.04[/C][C]83.2[/C][C]83.4[/C][C]86[/C][C]86[/C][C]86.56[/C][C]81[/C][C]83.6[/C][C]81[/C][/ROW]
[ROW][C]0.06[/C][C]86.924[/C][C]87.008[/C][C]87.4[/C][C]87.4[/C][C]87.4[/C][C]87.4[/C][C]86.392[/C][C]87.4[/C][/ROW]
[ROW][C]0.08[/C][C]87.4[/C][C]87.4[/C][C]87.4[/C][C]87.4[/C][C]89.4[/C][C]87.4[/C][C]87.4[/C][C]87.4[/C][/ROW]
[ROW][C]0.1[/C][C]89.98[/C][C]90.06[/C][C]90.7[/C][C]90.7[/C][C]90.7[/C][C]89.9[/C][C]90.54[/C][C]89.9[/C][/ROW]
[ROW][C]0.12[/C][C]91.116[/C][C]91.272[/C][C]92[/C][C]92[/C][C]92.02[/C][C]90.7[/C][C]91.428[/C][C]90.7[/C][/ROW]
[ROW][C]0.14[/C][C]92.054[/C][C]92.068[/C][C]92.1[/C][C]92.1[/C][C]93.1[/C][C]92.1[/C][C]92.032[/C][C]92.1[/C][/ROW]
[ROW][C]0.16[/C][C]94[/C][C]94.4[/C][C]94.6[/C][C]94.6[/C][C]94.66[/C][C]94.6[/C][C]92.3[/C][C]94.6[/C][/ROW]
[ROW][C]0.18[/C][C]94.698[/C][C]94.764[/C][C]94.7[/C][C]94.7[/C][C]95.02[/C][C]94.7[/C][C]95.036[/C][C]94.7[/C][/ROW]
[ROW][C]0.2[/C][C]95.22[/C][C]95.34[/C][C]95.7[/C][C]95.7[/C][C]95.7[/C][C]95.1[/C][C]95.46[/C][C]95.1[/C][/ROW]
[ROW][C]0.22[/C][C]95.784[/C][C]95.828[/C][C]95.9[/C][C]95.9[/C][C]95.94[/C][C]95.7[/C][C]95.772[/C][C]95.9[/C][/ROW]
[ROW][C]0.24[/C][C]96.028[/C][C]96.076[/C][C]96.1[/C][C]96.1[/C][C]96.14[/C][C]96.1[/C][C]95.924[/C][C]96.1[/C][/ROW]
[ROW][C]0.26[/C][C]96.186[/C][C]96.224[/C][C]96.2[/C][C]96.2[/C][C]96.32[/C][C]96.2[/C][C]96.376[/C][C]96.2[/C][/ROW]
[ROW][C]0.28[/C][C]96.432[/C][C]96.544[/C][C]96.8[/C][C]96.8[/C][C]96.72[/C][C]96.4[/C][C]96.656[/C][C]96.4[/C][/ROW]
[ROW][C]0.3[/C][C]96.83[/C][C]96.86[/C][C]96.9[/C][C]96.9[/C][C]96.9[/C][C]96.8[/C][C]96.84[/C][C]96.9[/C][/ROW]
[ROW][C]0.32[/C][C]96.952[/C][C]96.984[/C][C]97[/C][C]97[/C][C]97[/C][C]97[/C][C]96.916[/C][C]97[/C][/ROW]
[ROW][C]0.34[/C][C]97[/C][C]97.032[/C][C]97[/C][C]97[/C][C]97.16[/C][C]97[/C][C]97.368[/C][C]97[/C][/ROW]
[ROW][C]0.36[/C][C]97.384[/C][C]97.4[/C][C]97.4[/C][C]97.4[/C][C]97.4[/C][C]97.4[/C][C]97.4[/C][C]97.4[/C][/ROW]
[ROW][C]0.38[/C][C]97.526[/C][C]97.792[/C][C]98.1[/C][C]98.1[/C][C]97.96[/C][C]97.4[/C][C]97.708[/C][C]98.1[/C][/ROW]
[ROW][C]0.4[/C][C]98.1[/C][C]98.1[/C][C]98.1[/C][C]98.1[/C][C]98.1[/C][C]98.1[/C][C]98.1[/C][C]98.1[/C][/ROW]
[ROW][C]0.42[/C][C]98.41[/C][C]98.616[/C][C]98.6[/C][C]98.6[/C][C]98.68[/C][C]98.6[/C][C]98.984[/C][C]98.6[/C][/ROW]
[ROW][C]0.44[/C][C]98.936[/C][C]99.476[/C][C]99[/C][C]99[/C][C]99.68[/C][C]99[/C][C]100.224[/C][C]99[/C][/ROW]
[ROW][C]0.46[/C][C]100.718[/C][C]100.856[/C][C]101[/C][C]101[/C][C]100.88[/C][C]100.7[/C][C]100.844[/C][C]101[/C][/ROW]
[ROW][C]0.48[/C][C]101.168[/C][C]101.456[/C][C]101.6[/C][C]101.6[/C][C]101.48[/C][C]101[/C][C]101.144[/C][C]101.6[/C][/ROW]
[ROW][C]0.5[/C][C]101.65[/C][C]101.7[/C][C]101.7[/C][C]101.7[/C][C]101.7[/C][C]101.7[/C][C]101.7[/C][C]101.7[/C][/ROW]
[ROW][C]0.52[/C][C]101.844[/C][C]101.924[/C][C]101.9[/C][C]101.9[/C][C]101.92[/C][C]101.9[/C][C]101.976[/C][C]101.9[/C][/ROW]
[ROW][C]0.54[/C][C]101.994[/C][C]102.144[/C][C]102[/C][C]102[/C][C]102.12[/C][C]102[/C][C]102.156[/C][C]102[/C][/ROW]
[ROW][C]0.56[/C][C]102.3[/C][C]102.3[/C][C]102.3[/C][C]102.3[/C][C]102.3[/C][C]102.3[/C][C]102.3[/C][C]102.3[/C][/ROW]
[ROW][C]0.58[/C][C]102.452[/C][C]102.684[/C][C]102.7[/C][C]102.7[/C][C]102.62[/C][C]102.3[/C][C]102.316[/C][C]102.7[/C][/ROW]
[ROW][C]0.6[/C][C]102.76[/C][C]102.82[/C][C]102.8[/C][C]102.8[/C][C]102.8[/C][C]102.8[/C][C]102.88[/C][C]102.8[/C][/ROW]
[ROW][C]0.62[/C][C]102.882[/C][C]102.988[/C][C]102.9[/C][C]102.9[/C][C]102.94[/C][C]102.9[/C][C]103.012[/C][C]102.9[/C][/ROW]
[ROW][C]0.64[/C][C]103.132[/C][C]103.644[/C][C]103.9[/C][C]103.9[/C][C]103.42[/C][C]103.1[/C][C]103.356[/C][C]103.9[/C][/ROW]
[ROW][C]0.66[/C][C]104.056[/C][C]104.452[/C][C]104.5[/C][C]104.5[/C][C]104.26[/C][C]103.9[/C][C]103.948[/C][C]104.5[/C][/ROW]
[ROW][C]0.68[/C][C]104.596[/C][C]104.7[/C][C]104.7[/C][C]104.7[/C][C]104.66[/C][C]104.5[/C][C]104.7[/C][C]104.7[/C][/ROW]
[ROW][C]0.7[/C][C]104.7[/C][C]104.98[/C][C]104.7[/C][C]104.7[/C][C]104.7[/C][C]104.7[/C][C]105.12[/C][C]104.7[/C][/ROW]
[ROW][C]0.72[/C][C]105.344[/C][C]105.72[/C][C]105.4[/C][C]105.4[/C][C]105.5[/C][C]105.4[/C][C]105.58[/C][C]105.9[/C][/ROW]
[ROW][C]0.74[/C][C]105.914[/C][C]105.988[/C][C]106[/C][C]106[/C][C]105.94[/C][C]105.9[/C][C]105.912[/C][C]106[/C][/ROW]
[ROW][C]0.76[/C][C]106.072[/C][C]106.284[/C][C]106.2[/C][C]106.2[/C][C]106.12[/C][C]106[/C][C]106.816[/C][C]106.2[/C][/ROW]
[ROW][C]0.78[/C][C]106.606[/C][C]107.584[/C][C]106.9[/C][C]106.9[/C][C]106.76[/C][C]106.9[/C][C]108.116[/C][C]106.9[/C][/ROW]
[ROW][C]0.8[/C][C]108.42[/C][C]109.16[/C][C]108.8[/C][C]108.8[/C][C]108.8[/C][C]108.8[/C][C]109.04[/C][C]109.4[/C][/ROW]
[ROW][C]0.82[/C][C]109.408[/C][C]109.736[/C][C]109.8[/C][C]109.8[/C][C]109.48[/C][C]109.4[/C][C]109.464[/C][C]109.8[/C][/ROW]
[ROW][C]0.84[/C][C]109.92[/C][C]110.308[/C][C]110.3[/C][C]110.3[/C][C]110[/C][C]109.8[/C][C]110.392[/C][C]110.3[/C][/ROW]
[ROW][C]0.86[/C][C]110.346[/C][C]110.72[/C][C]110.4[/C][C]110.4[/C][C]110.36[/C][C]110.3[/C][C]111.08[/C][C]110.4[/C][/ROW]
[ROW][C]0.88[/C][C]111.08[/C][C]111.568[/C][C]111.4[/C][C]111.4[/C][C]111.2[/C][C]111.4[/C][C]111.532[/C][C]111.7[/C][/ROW]
[ROW][C]0.9[/C][C]111.67[/C][C]112.42[/C][C]111.7[/C][C]111.7[/C][C]111.7[/C][C]111.7[/C][C]111.88[/C][C]112.6[/C][/ROW]
[ROW][C]0.92[/C][C]112.612[/C][C]112.72[/C][C]112.7[/C][C]112.7[/C][C]112.62[/C][C]112.6[/C][C]113.18[/C][C]112.7[/C][/ROW]
[ROW][C]0.94[/C][C]112.87[/C][C]113.396[/C][C]113.2[/C][C]113.2[/C][C]112.9[/C][C]112.7[/C][C]113.704[/C][C]113.2[/C][/ROW]
[ROW][C]0.96[/C][C]113.592[/C][C]114.004[/C][C]113.9[/C][C]113.9[/C][C]113.62[/C][C]113.9[/C][C]113.996[/C][C]114.1[/C][/ROW]
[ROW][C]0.98[/C][C]114.056[/C][C]115.164[/C][C]114.1[/C][C]114.1[/C][C]114.06[/C][C]114.1[/C][C]114.436[/C][C]115.5[/C][/ROW]
[/TABLE]
Source: https://freestatistics.org/blog/index.php?pk=16954&T=1

Globally Unique Identifier (entire table): ba.freestatistics.org/blog/index.php?pk=16954&T=1

As an alternative you can also use a QR Code:  

The GUIDs for individual cells are displayed in the table below:

Percentiles - Ungrouped Data
pWeighted Average at XnpWeighted Average at X(n+1)pEmpirical Distribution FunctionEmpirical Distribution Function - AveragingEmpirical Distribution Function - InterpolationClosest ObservationTrue Basic - Statistics Graphics ToolkitMS Excel (old versions)
0.0280.92280.92481818280.980.97680.9
0.0483.283.4868686.568183.681
0.0686.92487.00887.487.487.487.486.39287.4
0.0887.487.487.487.489.487.487.487.4
0.189.9890.0690.790.790.789.990.5489.9
0.1291.11691.272929292.0290.791.42890.7
0.1492.05492.06892.192.193.192.192.03292.1
0.169494.494.694.694.6694.692.394.6
0.1894.69894.76494.794.795.0294.795.03694.7
0.295.2295.3495.795.795.795.195.4695.1
0.2295.78495.82895.995.995.9495.795.77295.9
0.2496.02896.07696.196.196.1496.195.92496.1
0.2696.18696.22496.296.296.3296.296.37696.2
0.2896.43296.54496.896.896.7296.496.65696.4
0.396.8396.8696.996.996.996.896.8496.9
0.3296.95296.9849797979796.91697
0.349797.032979797.169797.36897
0.3697.38497.497.497.497.497.497.497.4
0.3897.52697.79298.198.197.9697.497.70898.1
0.498.198.198.198.198.198.198.198.1
0.4298.4198.61698.698.698.6898.698.98498.6
0.4498.93699.476999999.6899100.22499
0.46100.718100.856101101100.88100.7100.844101
0.48101.168101.456101.6101.6101.48101101.144101.6
0.5101.65101.7101.7101.7101.7101.7101.7101.7
0.52101.844101.924101.9101.9101.92101.9101.976101.9
0.54101.994102.144102102102.12102102.156102
0.56102.3102.3102.3102.3102.3102.3102.3102.3
0.58102.452102.684102.7102.7102.62102.3102.316102.7
0.6102.76102.82102.8102.8102.8102.8102.88102.8
0.62102.882102.988102.9102.9102.94102.9103.012102.9
0.64103.132103.644103.9103.9103.42103.1103.356103.9
0.66104.056104.452104.5104.5104.26103.9103.948104.5
0.68104.596104.7104.7104.7104.66104.5104.7104.7
0.7104.7104.98104.7104.7104.7104.7105.12104.7
0.72105.344105.72105.4105.4105.5105.4105.58105.9
0.74105.914105.988106106105.94105.9105.912106
0.76106.072106.284106.2106.2106.12106106.816106.2
0.78106.606107.584106.9106.9106.76106.9108.116106.9
0.8108.42109.16108.8108.8108.8108.8109.04109.4
0.82109.408109.736109.8109.8109.48109.4109.464109.8
0.84109.92110.308110.3110.3110109.8110.392110.3
0.86110.346110.72110.4110.4110.36110.3111.08110.4
0.88111.08111.568111.4111.4111.2111.4111.532111.7
0.9111.67112.42111.7111.7111.7111.7111.88112.6
0.92112.612112.72112.7112.7112.62112.6113.18112.7
0.94112.87113.396113.2113.2112.9112.7113.704113.2
0.96113.592114.004113.9113.9113.62113.9113.996114.1
0.98114.056115.164114.1114.1114.06114.1114.436115.5


Parameters (Session):
Parameters (R input):
R code (references can be found in the software module):
x <-sort(x[!is.na(x)])
q1 <- function(data,n,p,i,f) {
np <- n*p;
i <<- floor(np)
f <<- np - i
qvalue <- (1-f)*data[i] + f*data[i+1]
}
q2 <- function(data,n,p,i,f) {
np <- (n+1)*p
i <<- floor(np)
f <<- np - i
qvalue <- (1-f)*data[i] + f*data[i+1]
}
q3 <- function(data,n,p,i,f) {
np <- n*p
i <<- floor(np)
f <<- np - i
if (f==0) {
qvalue <- data[i]
} else {
qvalue <- data[i+1]
}
}
q4 <- function(data,n,p,i,f) {
np <- n*p
i <<- floor(np)
f <<- np - i
if (f==0) {
qvalue <- (data[i]+data[i+1])/2
} else {
qvalue <- data[i+1]
}
}
q5 <- function(data,n,p,i,f) {
np <- (n-1)*p
i <<- floor(np)
f <<- np - i
if (f==0) {
qvalue <- data[i+1]
} else {
qvalue <- data[i+1] + f*(data[i+2]-data[i+1])
}
}
q6 <- function(data,n,p,i,f) {
np <- n*p+0.5
i <<- floor(np)
f <<- np - i
qvalue <- data[i]
}
q7 <- function(data,n,p,i,f) {
np <- (n+1)*p
i <<- floor(np)
f <<- np - i
if (f==0) {
qvalue <- data[i]
} else {
qvalue <- f*data[i] + (1-f)*data[i+1]
}
}
q8 <- function(data,n,p,i,f) {
np <- (n+1)*p
i <<- floor(np)
f <<- np - i
if (f==0) {
qvalue <- data[i]
} else {
if (f == 0.5) {
qvalue <- (data[i]+data[i+1])/2
} else {
if (f < 0.5) {
qvalue <- data[i]
} else {
qvalue <- data[i+1]
}
}
}
}
lx <- length(x)
qval <- array(NA,dim=c(99,8))
mystep <- 25
mystart <- 25
if (lx>10){
mystep=10
mystart=10
}
if (lx>20){
mystep=5
mystart=5
}
if (lx>50){
mystep=2
mystart=2
}
if (lx>=100){
mystep=1
mystart=1
}
for (perc in seq(mystart,99,mystep)) {
qval[perc,1] <- q1(x,lx,perc/100,i,f)
qval[perc,2] <- q2(x,lx,perc/100,i,f)
qval[perc,3] <- q3(x,lx,perc/100,i,f)
qval[perc,4] <- q4(x,lx,perc/100,i,f)
qval[perc,5] <- q5(x,lx,perc/100,i,f)
qval[perc,6] <- q6(x,lx,perc/100,i,f)
qval[perc,7] <- q7(x,lx,perc/100,i,f)
qval[perc,8] <- q8(x,lx,perc/100,i,f)
}
bitmap(file='test1.png')
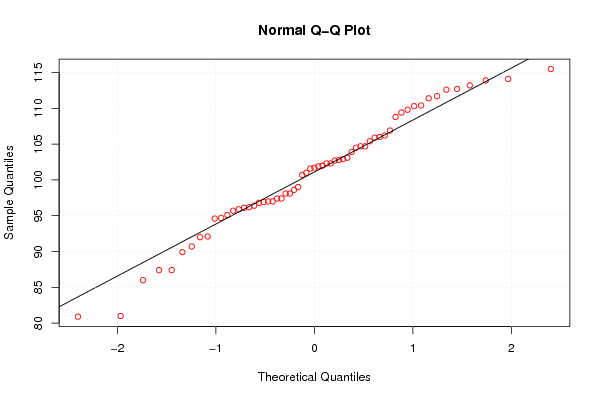
myqqnorm <- qqnorm(x,col=2)
qqline(x)
grid()
dev.off()
load(file='createtable')
a<-table.start()
a<-table.row.start(a)
a<-table.element(a,'Percentiles - Ungrouped Data',9,TRUE)
a<-table.row.end(a)
a<-table.row.start(a)
a<-table.element(a,'p',1,TRUE)
a<-table.element(a,hyperlink('method_1.htm', 'Weighted Average at Xnp',''),1,TRUE)
a<-table.element(a,hyperlink('method_2.htm','Weighted Average at X(n+1)p',''),1,TRUE)
a<-table.element(a,hyperlink('method_3.htm','Empirical Distribution Function',''),1,TRUE)
a<-table.element(a,hyperlink('method_4.htm','Empirical Distribution Function - Averaging',''),1,TRUE)
a<-table.element(a,hyperlink('method_5.htm','Empirical Distribution Function - Interpolation',''),1,TRUE)
a<-table.element(a,hyperlink('method_6.htm','Closest Observation',''),1,TRUE)
a<-table.element(a,hyperlink('method_7.htm','True Basic - Statistics Graphics Toolkit',''),1,TRUE)
a<-table.element(a,hyperlink('method_8.htm','MS Excel (old versions)',''),1,TRUE)
a<-table.row.end(a)
for (perc in seq(mystart,99,mystep)) {
a<-table.row.start(a)
a<-table.element(a,round(perc/100,2),1,TRUE)
for (j in 1:8) {
a<-table.element(a,round(qval[perc,j],6))
}
a<-table.row.end(a)
}
a<-table.end(a)
table.save(a,file='mytable.tab')