Free Statistics
of Irreproducible Research!
Description of Statistical Computation | |||||||||||||||||||||
|---|---|---|---|---|---|---|---|---|---|---|---|---|---|---|---|---|---|---|---|---|---|
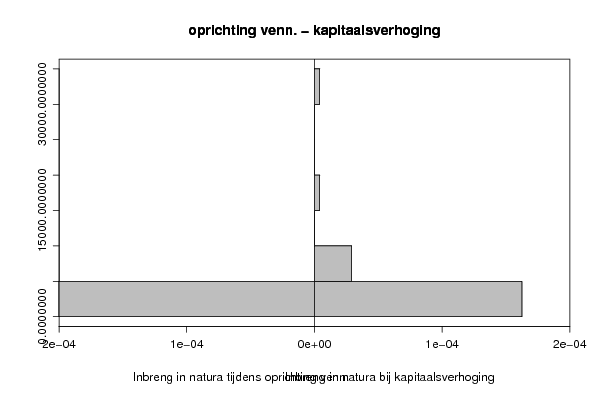
| Author's title | Task 3 - Q8 - inbreng in natura bij oprichting venn. en bij kapitaalsverhog... | ||||||||||||||||||||
| Author | *The author of this computation has been verified* | ||||||||||||||||||||
| R Software Module | rwasp_backtobackhist.wasp | ||||||||||||||||||||
| Title produced by software | Back to Back Histogram | ||||||||||||||||||||
| Date of computation | Sun, 19 Oct 2008 08:45:30 -0600 | ||||||||||||||||||||
| Cite this page as follows | Statistical Computations at FreeStatistics.org, Office for Research Development and Education, URL https://freestatistics.org/blog/index.php?v=date/2008/Oct/19/t1224427633dcx6epiu1bp9oa0.htm/, Retrieved Sun, 19 May 2024 15:24:10 +0000 | ||||||||||||||||||||
| Statistical Computations at FreeStatistics.org, Office for Research Development and Education, URL https://freestatistics.org/blog/index.php?pk=16883, Retrieved Sun, 19 May 2024 15:24:10 +0000 | |||||||||||||||||||||
| QR Codes: | |||||||||||||||||||||
|
| |||||||||||||||||||||
| Original text written by user: | |||||||||||||||||||||
| IsPrivate? | No (this computation is public) | ||||||||||||||||||||
| User-defined keywords | |||||||||||||||||||||
| Estimated Impact | 147 | ||||||||||||||||||||
Tree of Dependent Computations | |||||||||||||||||||||
| Family? (F = Feedback message, R = changed R code, M = changed R Module, P = changed Parameters, D = changed Data) | |||||||||||||||||||||
| - [Back to Back Histogram] [Investigating Ass...] [2007-10-22 22:01:16] [b9964c45117f7aac638ab9056d451faa] F PD [Back to Back Histogram] [Task 3 - Q8 - inb...] [2008-10-19 14:45:30] [dafd615cb3e0decc017580d68ecea30a] [Current] | |||||||||||||||||||||
| Feedback Forum | |||||||||||||||||||||
Post a new message | |||||||||||||||||||||
Dataset | |||||||||||||||||||||
| Dataseries X: | |||||||||||||||||||||
878 346 321 116 182 189 243 270 122 138 35 456 3929 262 236 222 2010 566 122 43 477 1048 307 687 186 248 78 135 7 90 280 20 223 29 175 93 83 28 57 40 51 42 78 83 25 587 241 79 | |||||||||||||||||||||
| Dataseries Y: | |||||||||||||||||||||
31560 19327 1628 2237 307 2152 3414 3466 761 1902 358 354 6676 2963 449 6225 458 9768 3497 760 565 422 290 1324 7092 1051 2614 346 130 1040 1629 374 176 1547 171 906 5798 2391 164 743 921 5911 535 72 6734 1024 1210 249 | |||||||||||||||||||||
Tables (Output of Computation) | |||||||||||||||||||||
| |||||||||||||||||||||
Figures (Output of Computation) | |||||||||||||||||||||
Input Parameters & R Code | |||||||||||||||||||||
| Parameters (Session): | |||||||||||||||||||||
| par1 = grey ; par2 = grey ; par3 = TRUE ; par4 = Inbreng in natura tijdens oprichting venn. ; par5 = Inbreng in natura bij kapitaalsverhoging ; | |||||||||||||||||||||
| Parameters (R input): | |||||||||||||||||||||
| par1 = grey ; par2 = grey ; par3 = TRUE ; par4 = Inbreng in natura tijdens oprichting venn. ; par5 = Inbreng in natura bij kapitaalsverhoging ; | |||||||||||||||||||||
| R code (references can be found in the software module): | |||||||||||||||||||||
if (par3 == 'TRUE') par3 <- TRUE | |||||||||||||||||||||