Free Statistics
of Irreproducible Research!
Description of Statistical Computation | |||||||||||||||||||||||||||||||||||||||||
|---|---|---|---|---|---|---|---|---|---|---|---|---|---|---|---|---|---|---|---|---|---|---|---|---|---|---|---|---|---|---|---|---|---|---|---|---|---|---|---|---|---|
| Author's title | |||||||||||||||||||||||||||||||||||||||||
| Author | *The author of this computation has been verified* | ||||||||||||||||||||||||||||||||||||||||
| R Software Module | rwasp_univariatedataseries.wasp | ||||||||||||||||||||||||||||||||||||||||
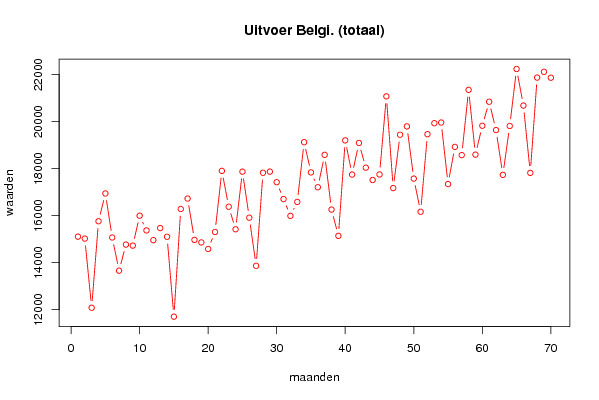
| Title produced by software | Univariate Data Series | ||||||||||||||||||||||||||||||||||||||||
| Date of computation | Sun, 19 Oct 2008 07:57:08 -0600 | ||||||||||||||||||||||||||||||||||||||||
| Cite this page as follows | Statistical Computations at FreeStatistics.org, Office for Research Development and Education, URL https://freestatistics.org/blog/index.php?v=date/2008/Oct/19/t1224424694uknx2t7vbzatq5w.htm/, Retrieved Sun, 19 May 2024 14:32:42 +0000 | ||||||||||||||||||||||||||||||||||||||||
| Statistical Computations at FreeStatistics.org, Office for Research Development and Education, URL https://freestatistics.org/blog/index.php?pk=16849, Retrieved Sun, 19 May 2024 14:32:42 +0000 | |||||||||||||||||||||||||||||||||||||||||
| QR Codes: | |||||||||||||||||||||||||||||||||||||||||
|
| |||||||||||||||||||||||||||||||||||||||||
| Original text written by user: | |||||||||||||||||||||||||||||||||||||||||
| IsPrivate? | No (this computation is public) | ||||||||||||||||||||||||||||||||||||||||
| User-defined keywords | Uitvoer Belgi� | ||||||||||||||||||||||||||||||||||||||||
| Estimated Impact | 127 | ||||||||||||||||||||||||||||||||||||||||
Tree of Dependent Computations | |||||||||||||||||||||||||||||||||||||||||
| Family? (F = Feedback message, R = changed R code, M = changed R Module, P = changed Parameters, D = changed Data) | |||||||||||||||||||||||||||||||||||||||||
| - [Univariate Data Series] [Uitvoer van Belgi...] [2008-10-19 13:57:08] [0831954c833179c36e9320daee0825b5] [Current] | |||||||||||||||||||||||||||||||||||||||||
| Feedback Forum | |||||||||||||||||||||||||||||||||||||||||
Post a new message | |||||||||||||||||||||||||||||||||||||||||
Dataset | |||||||||||||||||||||||||||||||||||||||||
| Dataseries X: | |||||||||||||||||||||||||||||||||||||||||
15107 15024 12083 15761 16943 15070 13660 14769 14725 15998 15371 14957 15470 15102 11704 16284 16727 14969 14861 14583 15306 17904 16379 15420 17871 15913 13867 17823 17872 17422 16705 15991 16584 19124 17839 17209 18587 16258 15142 19202 17747 19090 18040 17516 17752 21073 17170 19440 19795 17575 16165 19465 19932 19961 17343 18924 18574 21351 18595 19823 20844 19640 17735 19814 22239 20682 17819 21872 22117 21866 | |||||||||||||||||||||||||||||||||||||||||
Tables (Output of Computation) | |||||||||||||||||||||||||||||||||||||||||
| |||||||||||||||||||||||||||||||||||||||||
Figures (Output of Computation) | |||||||||||||||||||||||||||||||||||||||||
Input Parameters & R Code | |||||||||||||||||||||||||||||||||||||||||
| Parameters (Session): | |||||||||||||||||||||||||||||||||||||||||
| par1 = Uitvoer van Belgi� volgens het nationale concept verdeeld over de gewesten van oorsprong ; par2 = http://www.nbb.be/app/cal/N/BelgoHome.htm ; par3 = Uitvoer Belgi� (totaal) ; | |||||||||||||||||||||||||||||||||||||||||
| Parameters (R input): | |||||||||||||||||||||||||||||||||||||||||
| par1 = Uitvoer van Belgi� volgens het nationale concept verdeeld over de gewesten van oorsprong ; par2 = http://www.nbb.be/app/cal/N/BelgoHome.htm ; par3 = Uitvoer Belgi� (totaal) ; | |||||||||||||||||||||||||||||||||||||||||
| R code (references can be found in the software module): | |||||||||||||||||||||||||||||||||||||||||
bitmap(file='test1.png') | |||||||||||||||||||||||||||||||||||||||||