Free Statistics
of Irreproducible Research!
Description of Statistical Computation | |||||||||||||||||||||
|---|---|---|---|---|---|---|---|---|---|---|---|---|---|---|---|---|---|---|---|---|---|
| Author's title | |||||||||||||||||||||
| Author | *The author of this computation has been verified* | ||||||||||||||||||||
| R Software Module | rwasp_backtobackhist.wasp | ||||||||||||||||||||
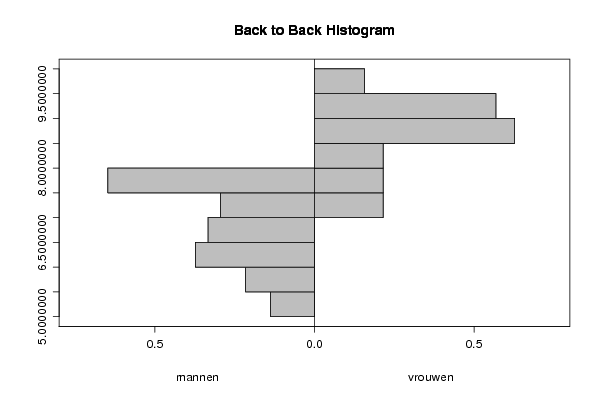
| Title produced by software | Back to Back Histogram | ||||||||||||||||||||
| Date of computation | Sun, 19 Oct 2008 07:31:54 -0600 | ||||||||||||||||||||
| Cite this page as follows | Statistical Computations at FreeStatistics.org, Office for Research Development and Education, URL https://freestatistics.org/blog/index.php?v=date/2008/Oct/19/t12244233898cc3mhteu8tqu5x.htm/, Retrieved Sun, 19 May 2024 15:36:35 +0000 | ||||||||||||||||||||
| Statistical Computations at FreeStatistics.org, Office for Research Development and Education, URL https://freestatistics.org/blog/index.php?pk=16828, Retrieved Sun, 19 May 2024 15:36:35 +0000 | |||||||||||||||||||||
| QR Codes: | |||||||||||||||||||||
|
| |||||||||||||||||||||
| Original text written by user: | |||||||||||||||||||||
| IsPrivate? | No (this computation is public) | ||||||||||||||||||||
| User-defined keywords | |||||||||||||||||||||
| Estimated Impact | 160 | ||||||||||||||||||||
Tree of Dependent Computations | |||||||||||||||||||||
| Family? (F = Feedback message, R = changed R code, M = changed R Module, P = changed Parameters, D = changed Data) | |||||||||||||||||||||
| - [Back to Back Histogram] [Investigating Ass...] [2007-10-22 21:58:05] [b9964c45117f7aac638ab9056d451faa] F R D [Back to Back Histogram] [werkloosheid] [2008-10-19 13:31:54] [f6a332ba2d530c028d935c5a5bbb53af] [Current] F D [Back to Back Histogram] [werkloosheid tota...] [2008-10-19 13:45:39] [d2d412c7f4d35ffbf5ee5ee89db327d4] | |||||||||||||||||||||
| Feedback Forum | |||||||||||||||||||||
Post a new message | |||||||||||||||||||||
Dataset | |||||||||||||||||||||
| Dataseries X: | |||||||||||||||||||||
6.2 6.1 5.9 5.6 5.5 5.5 5.6 5.7 5.6 5.4 5.3 5.3 5.4 5.5 5.6 5.7 5.8 5.8 5.7 5.9 6.1 6.4 6.4 6.3 6.2 6.2 6.3 6.5 6.6 6.6 6.7 6.6 6.7 7 7.2 7.3 7.5 7.6 7.7 7.8 7.8 7.7 7.6 7.6 7.7 7.8 7.8 7.8 7.7 7.6 7.4 7.1 7.1 7.3 7.6 7.8 7.7 7.6 7.5 7.5 7.5 7.6 7.6 7.7 7.8 7.7 7.6 7.6 7.6 7.7 7.8 7.8 7.9 7.9 7.8 7.8 7.7 7.5 7.1 6.9 7.1 7.1 7.1 7 6.9 6.8 6.7 6.8 6.8 6.7 6.8 6.7 6.6 6.4 6.4 6.4 6.5 6.5 6.4 6.3 6.2 6.3 | |||||||||||||||||||||
| Dataseries Y: | |||||||||||||||||||||
9 8.8 8.7 8.7 8.6 8.6 8.5 8.5 8.3 8.2 8.1 7.8 7.5 7.4 7.3 7.7 7.7 7.6 7.3 7.2 7.5 8 8.1 8.4 8.6 8.7 8.6 8.4 8.4 8.5 8.9 8.8 8.7 8.6 8.6 8.6 8.8 8.8 8.8 8.8 8.7 8.7 8.9 8.9 9 8.9 9 9.1 9.3 9.4 9.4 9.2 9.2 9.4 9.9 10 9.9 9.6 9.5 9.6 9.5 9.6 9.6 9.5 9.5 9.5 9.5 9.4 9.5 9.5 9.5 9.5 9.5 9.4 9.3 9.2 9.3 9.4 9.5 9.6 9.5 9.3 9.1 9 9 8.9 9 9.2 9 8.7 8.3 8 7.7 7.9 7.9 7.8 7.7 7.5 7.3 7.2 7.1 7.1 | |||||||||||||||||||||
Tables (Output of Computation) | |||||||||||||||||||||
| |||||||||||||||||||||
Figures (Output of Computation) | |||||||||||||||||||||
Input Parameters & R Code | |||||||||||||||||||||
| Parameters (Session): | |||||||||||||||||||||
| par1 = grey ; par2 = grey ; par3 = TRUE ; par4 = Totaal ; par5 = Metalen prod ; | |||||||||||||||||||||
| Parameters (R input): | |||||||||||||||||||||
| par1 = grey ; par2 = grey ; par3 = TRUE ; par4 = mannen ; par5 = vrouwen ; | |||||||||||||||||||||
| R code (references can be found in the software module): | |||||||||||||||||||||
if (par3 == 'TRUE') par3 <- TRUE | |||||||||||||||||||||