Free Statistics

of Irreproducible Research!

Author's title

Author*The author of this computation has been verified*
R Software Modulerwasp_percentiles.wasp
Title produced by softwarePercentiles
Date of computationSun, 19 Oct 2008 07:29:31 -0600
Cite this page as followsStatistical Computations at FreeStatistics.org, Office for Research Development and Education, URL https://freestatistics.org/blog/index.php?v=date/2008/Oct/19/t1224423162qz0oplxjx4d0el9.htm/, Retrieved Sun, 19 May 2024 14:10:40 +0000
Statistical Computations at FreeStatistics.org, Office for Research Development and Education, URL https://freestatistics.org/blog/index.php?pk=16824, Retrieved Sun, 19 May 2024 14:10:40 +0000
QR Codes:

Original text written by user:
IsPrivate?No (this computation is public)
User-defined keywords
Estimated Impact195
Family? (F = Feedback message, R = changed R code, M = changed R Module, P = changed Parameters, D = changed Data)
F       [Percentiles] [Q 6 P(a < Total P...] [2008-10-19 13:29:31] [6912578025c824de531bc660dd61b996] [Current]
F RMPD    [Harrell-Davis Quantiles] [Q7 P(a < Total Pr...] [2008-10-19 13:43:48] [4300be8b33fd3dcdacd2aa9800ceba23]
F    D      [Harrell-Davis Quantiles] [Task 2 - 95% Tota...] [2008-10-19 14:11:31] [4300be8b33fd3dcdacd2aa9800ceba23]
-             [Harrell-Davis Quantiles] [Taak 2] [2008-10-20 19:30:01] [b47fceb71c9525e79a89b5fc6d023d0e]
-             [Harrell-Davis Quantiles] [Investigating Ass...] [2008-10-20 19:50:36] [79c17183721a40a589db5f9f561947d8]
-           [Harrell-Davis Quantiles] [Q7] [2008-10-20 19:15:19] [b47fceb71c9525e79a89b5fc6d023d0e]
-    D    [Percentiles] [Q6] [2008-10-20 19:04:59] [b47fceb71c9525e79a89b5fc6d023d0e]
Feedback Forum
2008-10-24 21:03:49 [Kenny Simons] [reply
Je antwoord op deze vraag is niet fout, maar je hebt niet de meest aangewezen kolom gebruikt om je antwoord van af te lezen. De meest aangewezen kolom was de 5e kolom en dan had je een ander betrouwbaarheidsinterval bekomen namelijk
90,7 < P < 111,7 = 80%
2008-10-26 11:39:28 [Natascha Meeus] [reply
De berekeningen en de redenering van de student kloppen.
2008-10-26 11:51:39 [Matthieu Blondeau] [reply
Ik ga akkoord met de bevindingen van de student.
2008-10-26 17:36:13 [Chi-Kwong Man] [reply
Akkoord met de meningen hierboven.
2008-10-27 07:47:48 [Glenn De Maeyer] [reply
Hier heeft de student een juist antwoord geformuleerd. Hij heeft inderdaad gewoon geen gebruik gemaakt van de kolom die in de les werd aangeduid als de te gebruiken kolom (de 5e kolom). het antwoord is dus juist maar het beter 90,7 < P < 111,7 geweest.
2008-10-27 11:03:00 [Kim De Vos] [reply
De bevindingen van de student zijn correct, in de les werd kolom 5 aangewezen maar het was geen verplichting om deze te gebruiken.
2008-10-27 18:45:54 [Jeroen Michel] [reply
Ook hier wordt een juiste conclusie gemaakt. Wanneer we nog precieser en specifieker te werk willen gaan en analyseren, is het wel degelijk aangewezen, de resultaten af te lezen uit kolom 5.
2008-10-27 19:11:07 [Niels Stas] [reply
Kolom 5 had nauwkeuriger geweest, maar de bevindingen van de student zijn correct.
2008-10-28 06:50:52 [Nilay Erdogdu] [reply
Links op tabel, zien we de waarschijnlijkheden, dan volgen er technieken (5de kolom kiezen).

De student heeft enkel naar kolom één gekeken, nog beter was geweest om kolom 5 te kiezen.

Post a new message
Dataseries X:
110,40
96,40
101,90
106,20
81,00
94,70
101,00
109,40
102,30
90,70
96,20
96,10
106,00
103,10
102,00
104,70
86,00
92,10
106,90
112,60
101,70
92,00
97,40
97,00
105,40
102,70
98,10
104,50
87,40
89,90
109,80
111,70
98,60
96,90
95,10
97,00
112,70
102,90
97,40
111,40
87,40
96,80
114,10
110,30
103,90
101,60
94,60
95,90
104,70
102,80
98,10
113,90
80,90
95,70
113,20
105,90
108,80
102,30
99,00
100,70
115,50


Summary of computational transaction
Raw Inputview raw input (R code)
Raw Outputview raw output of R engine
Computing time1 seconds
R Server'Gwilym Jenkins' @ 72.249.127.135

\begin{tabular}{lllllllll}
\hline
Summary of computational transaction \tabularnewline
Raw Input & view raw input (R code)  \tabularnewline
Raw Output & view raw output of R engine  \tabularnewline
Computing time & 1 seconds \tabularnewline
R Server & 'Gwilym Jenkins' @ 72.249.127.135 \tabularnewline
\hline
\end{tabular}
%Source: https://freestatistics.org/blog/index.php?pk=16824&T=0

[TABLE]
[ROW][C]Summary of computational transaction[/C][/ROW]
[ROW][C]Raw Input[/C][C]view raw input (R code) [/C][/ROW]
[ROW][C]Raw Output[/C][C]view raw output of R engine [/C][/ROW]
[ROW][C]Computing time[/C][C]1 seconds[/C][/ROW]
[ROW][C]R Server[/C][C]'Gwilym Jenkins' @ 72.249.127.135[/C][/ROW]
[/TABLE]
Source: https://freestatistics.org/blog/index.php?pk=16824&T=0

Globally Unique Identifier (entire table): ba.freestatistics.org/blog/index.php?pk=16824&T=0

As an alternative you can also use a QR Code:  

The GUIDs for individual cells are displayed in the table below:

Summary of computational transaction
Raw Inputview raw input (R code)
Raw Outputview raw output of R engine
Computing time1 seconds
R Server'Gwilym Jenkins' @ 72.249.127.135


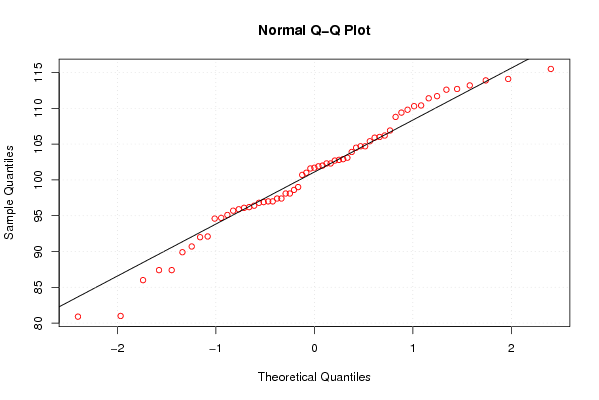
Percentiles - Ungrouped Data
pWeighted Average at XnpWeighted Average at X(n+1)pEmpirical Distribution FunctionEmpirical Distribution Function - AveragingEmpirical Distribution Function - InterpolationClosest ObservationTrue Basic - Statistics Graphics ToolkitMS Excel (old versions)
0.0280.92280.92481818280.980.97680.9
0.0483.283.4868686.568183.681
0.0686.92487.00887.487.487.487.486.39287.4
0.0887.487.487.487.489.487.487.487.4
0.189.9890.0690.790.790.789.990.5489.9
0.1291.11691.272929292.0290.791.42890.7
0.1492.05492.06892.192.193.192.192.03292.1
0.169494.494.694.694.6694.692.394.6
0.1894.69894.76494.794.795.0294.795.03694.7
0.295.2295.3495.795.795.795.195.4695.1
0.2295.78495.82895.995.995.9495.795.77295.9
0.2496.02896.07696.196.196.1496.195.92496.1
0.2696.18696.22496.296.296.3296.296.37696.2
0.2896.43296.54496.896.896.7296.496.65696.4
0.396.8396.8696.996.996.996.896.8496.9
0.3296.95296.9849797979796.91697
0.349797.032979797.169797.36897
0.3697.38497.497.497.497.497.497.497.4
0.3897.52697.79298.198.197.9697.497.70898.1
0.498.198.198.198.198.198.198.198.1
0.4298.4198.61698.698.698.6898.698.98498.6
0.4498.93699.476999999.6899100.22499
0.46100.718100.856101101100.88100.7100.844101
0.48101.168101.456101.6101.6101.48101101.144101.6
0.5101.65101.7101.7101.7101.7101.7101.7101.7
0.52101.844101.924101.9101.9101.92101.9101.976101.9
0.54101.994102.144102102102.12102102.156102
0.56102.3102.3102.3102.3102.3102.3102.3102.3
0.58102.452102.684102.7102.7102.62102.3102.316102.7
0.6102.76102.82102.8102.8102.8102.8102.88102.8
0.62102.882102.988102.9102.9102.94102.9103.012102.9
0.64103.132103.644103.9103.9103.42103.1103.356103.9
0.66104.056104.452104.5104.5104.26103.9103.948104.5
0.68104.596104.7104.7104.7104.66104.5104.7104.7
0.7104.7104.98104.7104.7104.7104.7105.12104.7
0.72105.344105.72105.4105.4105.5105.4105.58105.9
0.74105.914105.988106106105.94105.9105.912106
0.76106.072106.284106.2106.2106.12106106.816106.2
0.78106.606107.584106.9106.9106.76106.9108.116106.9
0.8108.42109.16108.8108.8108.8108.8109.04109.4
0.82109.408109.736109.8109.8109.48109.4109.464109.8
0.84109.92110.308110.3110.3110109.8110.392110.3
0.86110.346110.72110.4110.4110.36110.3111.08110.4
0.88111.08111.568111.4111.4111.2111.4111.532111.7
0.9111.67112.42111.7111.7111.7111.7111.88112.6
0.92112.612112.72112.7112.7112.62112.6113.18112.7
0.94112.87113.396113.2113.2112.9112.7113.704113.2
0.96113.592114.004113.9113.9113.62113.9113.996114.1
0.98114.056115.164114.1114.1114.06114.1114.436115.5

\begin{tabular}{lllllllll}
\hline
Percentiles - Ungrouped Data \tabularnewline
p & Weighted Average at Xnp & Weighted Average at X(n+1)p & Empirical Distribution Function & Empirical Distribution Function - Averaging & Empirical Distribution Function - Interpolation & Closest Observation & True Basic - Statistics Graphics Toolkit & MS Excel (old versions) \tabularnewline
0.02 & 80.922 & 80.924 & 81 & 81 & 82 & 80.9 & 80.976 & 80.9 \tabularnewline
0.04 & 83.2 & 83.4 & 86 & 86 & 86.56 & 81 & 83.6 & 81 \tabularnewline
0.06 & 86.924 & 87.008 & 87.4 & 87.4 & 87.4 & 87.4 & 86.392 & 87.4 \tabularnewline
0.08 & 87.4 & 87.4 & 87.4 & 87.4 & 89.4 & 87.4 & 87.4 & 87.4 \tabularnewline
0.1 & 89.98 & 90.06 & 90.7 & 90.7 & 90.7 & 89.9 & 90.54 & 89.9 \tabularnewline
0.12 & 91.116 & 91.272 & 92 & 92 & 92.02 & 90.7 & 91.428 & 90.7 \tabularnewline
0.14 & 92.054 & 92.068 & 92.1 & 92.1 & 93.1 & 92.1 & 92.032 & 92.1 \tabularnewline
0.16 & 94 & 94.4 & 94.6 & 94.6 & 94.66 & 94.6 & 92.3 & 94.6 \tabularnewline
0.18 & 94.698 & 94.764 & 94.7 & 94.7 & 95.02 & 94.7 & 95.036 & 94.7 \tabularnewline
0.2 & 95.22 & 95.34 & 95.7 & 95.7 & 95.7 & 95.1 & 95.46 & 95.1 \tabularnewline
0.22 & 95.784 & 95.828 & 95.9 & 95.9 & 95.94 & 95.7 & 95.772 & 95.9 \tabularnewline
0.24 & 96.028 & 96.076 & 96.1 & 96.1 & 96.14 & 96.1 & 95.924 & 96.1 \tabularnewline
0.26 & 96.186 & 96.224 & 96.2 & 96.2 & 96.32 & 96.2 & 96.376 & 96.2 \tabularnewline
0.28 & 96.432 & 96.544 & 96.8 & 96.8 & 96.72 & 96.4 & 96.656 & 96.4 \tabularnewline
0.3 & 96.83 & 96.86 & 96.9 & 96.9 & 96.9 & 96.8 & 96.84 & 96.9 \tabularnewline
0.32 & 96.952 & 96.984 & 97 & 97 & 97 & 97 & 96.916 & 97 \tabularnewline
0.34 & 97 & 97.032 & 97 & 97 & 97.16 & 97 & 97.368 & 97 \tabularnewline
0.36 & 97.384 & 97.4 & 97.4 & 97.4 & 97.4 & 97.4 & 97.4 & 97.4 \tabularnewline
0.38 & 97.526 & 97.792 & 98.1 & 98.1 & 97.96 & 97.4 & 97.708 & 98.1 \tabularnewline
0.4 & 98.1 & 98.1 & 98.1 & 98.1 & 98.1 & 98.1 & 98.1 & 98.1 \tabularnewline
0.42 & 98.41 & 98.616 & 98.6 & 98.6 & 98.68 & 98.6 & 98.984 & 98.6 \tabularnewline
0.44 & 98.936 & 99.476 & 99 & 99 & 99.68 & 99 & 100.224 & 99 \tabularnewline
0.46 & 100.718 & 100.856 & 101 & 101 & 100.88 & 100.7 & 100.844 & 101 \tabularnewline
0.48 & 101.168 & 101.456 & 101.6 & 101.6 & 101.48 & 101 & 101.144 & 101.6 \tabularnewline
0.5 & 101.65 & 101.7 & 101.7 & 101.7 & 101.7 & 101.7 & 101.7 & 101.7 \tabularnewline
0.52 & 101.844 & 101.924 & 101.9 & 101.9 & 101.92 & 101.9 & 101.976 & 101.9 \tabularnewline
0.54 & 101.994 & 102.144 & 102 & 102 & 102.12 & 102 & 102.156 & 102 \tabularnewline
0.56 & 102.3 & 102.3 & 102.3 & 102.3 & 102.3 & 102.3 & 102.3 & 102.3 \tabularnewline
0.58 & 102.452 & 102.684 & 102.7 & 102.7 & 102.62 & 102.3 & 102.316 & 102.7 \tabularnewline
0.6 & 102.76 & 102.82 & 102.8 & 102.8 & 102.8 & 102.8 & 102.88 & 102.8 \tabularnewline
0.62 & 102.882 & 102.988 & 102.9 & 102.9 & 102.94 & 102.9 & 103.012 & 102.9 \tabularnewline
0.64 & 103.132 & 103.644 & 103.9 & 103.9 & 103.42 & 103.1 & 103.356 & 103.9 \tabularnewline
0.66 & 104.056 & 104.452 & 104.5 & 104.5 & 104.26 & 103.9 & 103.948 & 104.5 \tabularnewline
0.68 & 104.596 & 104.7 & 104.7 & 104.7 & 104.66 & 104.5 & 104.7 & 104.7 \tabularnewline
0.7 & 104.7 & 104.98 & 104.7 & 104.7 & 104.7 & 104.7 & 105.12 & 104.7 \tabularnewline
0.72 & 105.344 & 105.72 & 105.4 & 105.4 & 105.5 & 105.4 & 105.58 & 105.9 \tabularnewline
0.74 & 105.914 & 105.988 & 106 & 106 & 105.94 & 105.9 & 105.912 & 106 \tabularnewline
0.76 & 106.072 & 106.284 & 106.2 & 106.2 & 106.12 & 106 & 106.816 & 106.2 \tabularnewline
0.78 & 106.606 & 107.584 & 106.9 & 106.9 & 106.76 & 106.9 & 108.116 & 106.9 \tabularnewline
0.8 & 108.42 & 109.16 & 108.8 & 108.8 & 108.8 & 108.8 & 109.04 & 109.4 \tabularnewline
0.82 & 109.408 & 109.736 & 109.8 & 109.8 & 109.48 & 109.4 & 109.464 & 109.8 \tabularnewline
0.84 & 109.92 & 110.308 & 110.3 & 110.3 & 110 & 109.8 & 110.392 & 110.3 \tabularnewline
0.86 & 110.346 & 110.72 & 110.4 & 110.4 & 110.36 & 110.3 & 111.08 & 110.4 \tabularnewline
0.88 & 111.08 & 111.568 & 111.4 & 111.4 & 111.2 & 111.4 & 111.532 & 111.7 \tabularnewline
0.9 & 111.67 & 112.42 & 111.7 & 111.7 & 111.7 & 111.7 & 111.88 & 112.6 \tabularnewline
0.92 & 112.612 & 112.72 & 112.7 & 112.7 & 112.62 & 112.6 & 113.18 & 112.7 \tabularnewline
0.94 & 112.87 & 113.396 & 113.2 & 113.2 & 112.9 & 112.7 & 113.704 & 113.2 \tabularnewline
0.96 & 113.592 & 114.004 & 113.9 & 113.9 & 113.62 & 113.9 & 113.996 & 114.1 \tabularnewline
0.98 & 114.056 & 115.164 & 114.1 & 114.1 & 114.06 & 114.1 & 114.436 & 115.5 \tabularnewline
\hline
\end{tabular}
%Source: https://freestatistics.org/blog/index.php?pk=16824&T=1

[TABLE]
[ROW][C]Percentiles - Ungrouped Data[/C][/ROW]
[ROW][C]p[/C][C]Weighted Average at Xnp[/C][C]Weighted Average at X(n+1)p[/C][C]Empirical Distribution Function[/C][C]Empirical Distribution Function - Averaging[/C][C]Empirical Distribution Function - Interpolation[/C][C]Closest Observation[/C][C]True Basic - Statistics Graphics Toolkit[/C][C]MS Excel (old versions)[/C][/ROW]
[ROW][C]0.02[/C][C]80.922[/C][C]80.924[/C][C]81[/C][C]81[/C][C]82[/C][C]80.9[/C][C]80.976[/C][C]80.9[/C][/ROW]
[ROW][C]0.04[/C][C]83.2[/C][C]83.4[/C][C]86[/C][C]86[/C][C]86.56[/C][C]81[/C][C]83.6[/C][C]81[/C][/ROW]
[ROW][C]0.06[/C][C]86.924[/C][C]87.008[/C][C]87.4[/C][C]87.4[/C][C]87.4[/C][C]87.4[/C][C]86.392[/C][C]87.4[/C][/ROW]
[ROW][C]0.08[/C][C]87.4[/C][C]87.4[/C][C]87.4[/C][C]87.4[/C][C]89.4[/C][C]87.4[/C][C]87.4[/C][C]87.4[/C][/ROW]
[ROW][C]0.1[/C][C]89.98[/C][C]90.06[/C][C]90.7[/C][C]90.7[/C][C]90.7[/C][C]89.9[/C][C]90.54[/C][C]89.9[/C][/ROW]
[ROW][C]0.12[/C][C]91.116[/C][C]91.272[/C][C]92[/C][C]92[/C][C]92.02[/C][C]90.7[/C][C]91.428[/C][C]90.7[/C][/ROW]
[ROW][C]0.14[/C][C]92.054[/C][C]92.068[/C][C]92.1[/C][C]92.1[/C][C]93.1[/C][C]92.1[/C][C]92.032[/C][C]92.1[/C][/ROW]
[ROW][C]0.16[/C][C]94[/C][C]94.4[/C][C]94.6[/C][C]94.6[/C][C]94.66[/C][C]94.6[/C][C]92.3[/C][C]94.6[/C][/ROW]
[ROW][C]0.18[/C][C]94.698[/C][C]94.764[/C][C]94.7[/C][C]94.7[/C][C]95.02[/C][C]94.7[/C][C]95.036[/C][C]94.7[/C][/ROW]
[ROW][C]0.2[/C][C]95.22[/C][C]95.34[/C][C]95.7[/C][C]95.7[/C][C]95.7[/C][C]95.1[/C][C]95.46[/C][C]95.1[/C][/ROW]
[ROW][C]0.22[/C][C]95.784[/C][C]95.828[/C][C]95.9[/C][C]95.9[/C][C]95.94[/C][C]95.7[/C][C]95.772[/C][C]95.9[/C][/ROW]
[ROW][C]0.24[/C][C]96.028[/C][C]96.076[/C][C]96.1[/C][C]96.1[/C][C]96.14[/C][C]96.1[/C][C]95.924[/C][C]96.1[/C][/ROW]
[ROW][C]0.26[/C][C]96.186[/C][C]96.224[/C][C]96.2[/C][C]96.2[/C][C]96.32[/C][C]96.2[/C][C]96.376[/C][C]96.2[/C][/ROW]
[ROW][C]0.28[/C][C]96.432[/C][C]96.544[/C][C]96.8[/C][C]96.8[/C][C]96.72[/C][C]96.4[/C][C]96.656[/C][C]96.4[/C][/ROW]
[ROW][C]0.3[/C][C]96.83[/C][C]96.86[/C][C]96.9[/C][C]96.9[/C][C]96.9[/C][C]96.8[/C][C]96.84[/C][C]96.9[/C][/ROW]
[ROW][C]0.32[/C][C]96.952[/C][C]96.984[/C][C]97[/C][C]97[/C][C]97[/C][C]97[/C][C]96.916[/C][C]97[/C][/ROW]
[ROW][C]0.34[/C][C]97[/C][C]97.032[/C][C]97[/C][C]97[/C][C]97.16[/C][C]97[/C][C]97.368[/C][C]97[/C][/ROW]
[ROW][C]0.36[/C][C]97.384[/C][C]97.4[/C][C]97.4[/C][C]97.4[/C][C]97.4[/C][C]97.4[/C][C]97.4[/C][C]97.4[/C][/ROW]
[ROW][C]0.38[/C][C]97.526[/C][C]97.792[/C][C]98.1[/C][C]98.1[/C][C]97.96[/C][C]97.4[/C][C]97.708[/C][C]98.1[/C][/ROW]
[ROW][C]0.4[/C][C]98.1[/C][C]98.1[/C][C]98.1[/C][C]98.1[/C][C]98.1[/C][C]98.1[/C][C]98.1[/C][C]98.1[/C][/ROW]
[ROW][C]0.42[/C][C]98.41[/C][C]98.616[/C][C]98.6[/C][C]98.6[/C][C]98.68[/C][C]98.6[/C][C]98.984[/C][C]98.6[/C][/ROW]
[ROW][C]0.44[/C][C]98.936[/C][C]99.476[/C][C]99[/C][C]99[/C][C]99.68[/C][C]99[/C][C]100.224[/C][C]99[/C][/ROW]
[ROW][C]0.46[/C][C]100.718[/C][C]100.856[/C][C]101[/C][C]101[/C][C]100.88[/C][C]100.7[/C][C]100.844[/C][C]101[/C][/ROW]
[ROW][C]0.48[/C][C]101.168[/C][C]101.456[/C][C]101.6[/C][C]101.6[/C][C]101.48[/C][C]101[/C][C]101.144[/C][C]101.6[/C][/ROW]
[ROW][C]0.5[/C][C]101.65[/C][C]101.7[/C][C]101.7[/C][C]101.7[/C][C]101.7[/C][C]101.7[/C][C]101.7[/C][C]101.7[/C][/ROW]
[ROW][C]0.52[/C][C]101.844[/C][C]101.924[/C][C]101.9[/C][C]101.9[/C][C]101.92[/C][C]101.9[/C][C]101.976[/C][C]101.9[/C][/ROW]
[ROW][C]0.54[/C][C]101.994[/C][C]102.144[/C][C]102[/C][C]102[/C][C]102.12[/C][C]102[/C][C]102.156[/C][C]102[/C][/ROW]
[ROW][C]0.56[/C][C]102.3[/C][C]102.3[/C][C]102.3[/C][C]102.3[/C][C]102.3[/C][C]102.3[/C][C]102.3[/C][C]102.3[/C][/ROW]
[ROW][C]0.58[/C][C]102.452[/C][C]102.684[/C][C]102.7[/C][C]102.7[/C][C]102.62[/C][C]102.3[/C][C]102.316[/C][C]102.7[/C][/ROW]
[ROW][C]0.6[/C][C]102.76[/C][C]102.82[/C][C]102.8[/C][C]102.8[/C][C]102.8[/C][C]102.8[/C][C]102.88[/C][C]102.8[/C][/ROW]
[ROW][C]0.62[/C][C]102.882[/C][C]102.988[/C][C]102.9[/C][C]102.9[/C][C]102.94[/C][C]102.9[/C][C]103.012[/C][C]102.9[/C][/ROW]
[ROW][C]0.64[/C][C]103.132[/C][C]103.644[/C][C]103.9[/C][C]103.9[/C][C]103.42[/C][C]103.1[/C][C]103.356[/C][C]103.9[/C][/ROW]
[ROW][C]0.66[/C][C]104.056[/C][C]104.452[/C][C]104.5[/C][C]104.5[/C][C]104.26[/C][C]103.9[/C][C]103.948[/C][C]104.5[/C][/ROW]
[ROW][C]0.68[/C][C]104.596[/C][C]104.7[/C][C]104.7[/C][C]104.7[/C][C]104.66[/C][C]104.5[/C][C]104.7[/C][C]104.7[/C][/ROW]
[ROW][C]0.7[/C][C]104.7[/C][C]104.98[/C][C]104.7[/C][C]104.7[/C][C]104.7[/C][C]104.7[/C][C]105.12[/C][C]104.7[/C][/ROW]
[ROW][C]0.72[/C][C]105.344[/C][C]105.72[/C][C]105.4[/C][C]105.4[/C][C]105.5[/C][C]105.4[/C][C]105.58[/C][C]105.9[/C][/ROW]
[ROW][C]0.74[/C][C]105.914[/C][C]105.988[/C][C]106[/C][C]106[/C][C]105.94[/C][C]105.9[/C][C]105.912[/C][C]106[/C][/ROW]
[ROW][C]0.76[/C][C]106.072[/C][C]106.284[/C][C]106.2[/C][C]106.2[/C][C]106.12[/C][C]106[/C][C]106.816[/C][C]106.2[/C][/ROW]
[ROW][C]0.78[/C][C]106.606[/C][C]107.584[/C][C]106.9[/C][C]106.9[/C][C]106.76[/C][C]106.9[/C][C]108.116[/C][C]106.9[/C][/ROW]
[ROW][C]0.8[/C][C]108.42[/C][C]109.16[/C][C]108.8[/C][C]108.8[/C][C]108.8[/C][C]108.8[/C][C]109.04[/C][C]109.4[/C][/ROW]
[ROW][C]0.82[/C][C]109.408[/C][C]109.736[/C][C]109.8[/C][C]109.8[/C][C]109.48[/C][C]109.4[/C][C]109.464[/C][C]109.8[/C][/ROW]
[ROW][C]0.84[/C][C]109.92[/C][C]110.308[/C][C]110.3[/C][C]110.3[/C][C]110[/C][C]109.8[/C][C]110.392[/C][C]110.3[/C][/ROW]
[ROW][C]0.86[/C][C]110.346[/C][C]110.72[/C][C]110.4[/C][C]110.4[/C][C]110.36[/C][C]110.3[/C][C]111.08[/C][C]110.4[/C][/ROW]
[ROW][C]0.88[/C][C]111.08[/C][C]111.568[/C][C]111.4[/C][C]111.4[/C][C]111.2[/C][C]111.4[/C][C]111.532[/C][C]111.7[/C][/ROW]
[ROW][C]0.9[/C][C]111.67[/C][C]112.42[/C][C]111.7[/C][C]111.7[/C][C]111.7[/C][C]111.7[/C][C]111.88[/C][C]112.6[/C][/ROW]
[ROW][C]0.92[/C][C]112.612[/C][C]112.72[/C][C]112.7[/C][C]112.7[/C][C]112.62[/C][C]112.6[/C][C]113.18[/C][C]112.7[/C][/ROW]
[ROW][C]0.94[/C][C]112.87[/C][C]113.396[/C][C]113.2[/C][C]113.2[/C][C]112.9[/C][C]112.7[/C][C]113.704[/C][C]113.2[/C][/ROW]
[ROW][C]0.96[/C][C]113.592[/C][C]114.004[/C][C]113.9[/C][C]113.9[/C][C]113.62[/C][C]113.9[/C][C]113.996[/C][C]114.1[/C][/ROW]
[ROW][C]0.98[/C][C]114.056[/C][C]115.164[/C][C]114.1[/C][C]114.1[/C][C]114.06[/C][C]114.1[/C][C]114.436[/C][C]115.5[/C][/ROW]
[/TABLE]
Source: https://freestatistics.org/blog/index.php?pk=16824&T=1

Globally Unique Identifier (entire table): ba.freestatistics.org/blog/index.php?pk=16824&T=1

As an alternative you can also use a QR Code:  

The GUIDs for individual cells are displayed in the table below:

Percentiles - Ungrouped Data
pWeighted Average at XnpWeighted Average at X(n+1)pEmpirical Distribution FunctionEmpirical Distribution Function - AveragingEmpirical Distribution Function - InterpolationClosest ObservationTrue Basic - Statistics Graphics ToolkitMS Excel (old versions)
0.0280.92280.92481818280.980.97680.9
0.0483.283.4868686.568183.681
0.0686.92487.00887.487.487.487.486.39287.4
0.0887.487.487.487.489.487.487.487.4
0.189.9890.0690.790.790.789.990.5489.9
0.1291.11691.272929292.0290.791.42890.7
0.1492.05492.06892.192.193.192.192.03292.1
0.169494.494.694.694.6694.692.394.6
0.1894.69894.76494.794.795.0294.795.03694.7
0.295.2295.3495.795.795.795.195.4695.1
0.2295.78495.82895.995.995.9495.795.77295.9
0.2496.02896.07696.196.196.1496.195.92496.1
0.2696.18696.22496.296.296.3296.296.37696.2
0.2896.43296.54496.896.896.7296.496.65696.4
0.396.8396.8696.996.996.996.896.8496.9
0.3296.95296.9849797979796.91697
0.349797.032979797.169797.36897
0.3697.38497.497.497.497.497.497.497.4
0.3897.52697.79298.198.197.9697.497.70898.1
0.498.198.198.198.198.198.198.198.1
0.4298.4198.61698.698.698.6898.698.98498.6
0.4498.93699.476999999.6899100.22499
0.46100.718100.856101101100.88100.7100.844101
0.48101.168101.456101.6101.6101.48101101.144101.6
0.5101.65101.7101.7101.7101.7101.7101.7101.7
0.52101.844101.924101.9101.9101.92101.9101.976101.9
0.54101.994102.144102102102.12102102.156102
0.56102.3102.3102.3102.3102.3102.3102.3102.3
0.58102.452102.684102.7102.7102.62102.3102.316102.7
0.6102.76102.82102.8102.8102.8102.8102.88102.8
0.62102.882102.988102.9102.9102.94102.9103.012102.9
0.64103.132103.644103.9103.9103.42103.1103.356103.9
0.66104.056104.452104.5104.5104.26103.9103.948104.5
0.68104.596104.7104.7104.7104.66104.5104.7104.7
0.7104.7104.98104.7104.7104.7104.7105.12104.7
0.72105.344105.72105.4105.4105.5105.4105.58105.9
0.74105.914105.988106106105.94105.9105.912106
0.76106.072106.284106.2106.2106.12106106.816106.2
0.78106.606107.584106.9106.9106.76106.9108.116106.9
0.8108.42109.16108.8108.8108.8108.8109.04109.4
0.82109.408109.736109.8109.8109.48109.4109.464109.8
0.84109.92110.308110.3110.3110109.8110.392110.3
0.86110.346110.72110.4110.4110.36110.3111.08110.4
0.88111.08111.568111.4111.4111.2111.4111.532111.7
0.9111.67112.42111.7111.7111.7111.7111.88112.6
0.92112.612112.72112.7112.7112.62112.6113.18112.7
0.94112.87113.396113.2113.2112.9112.7113.704113.2
0.96113.592114.004113.9113.9113.62113.9113.996114.1
0.98114.056115.164114.1114.1114.06114.1114.436115.5


Parameters (Session):
Parameters (R input):
R code (references can be found in the software module):
x <-sort(x[!is.na(x)])
q1 <- function(data,n,p,i,f) {
np <- n*p;
i <<- floor(np)
f <<- np - i
qvalue <- (1-f)*data[i] + f*data[i+1]
}
q2 <- function(data,n,p,i,f) {
np <- (n+1)*p
i <<- floor(np)
f <<- np - i
qvalue <- (1-f)*data[i] + f*data[i+1]
}
q3 <- function(data,n,p,i,f) {
np <- n*p
i <<- floor(np)
f <<- np - i
if (f==0) {
qvalue <- data[i]
} else {
qvalue <- data[i+1]
}
}
q4 <- function(data,n,p,i,f) {
np <- n*p
i <<- floor(np)
f <<- np - i
if (f==0) {
qvalue <- (data[i]+data[i+1])/2
} else {
qvalue <- data[i+1]
}
}
q5 <- function(data,n,p,i,f) {
np <- (n-1)*p
i <<- floor(np)
f <<- np - i
if (f==0) {
qvalue <- data[i+1]
} else {
qvalue <- data[i+1] + f*(data[i+2]-data[i+1])
}
}
q6 <- function(data,n,p,i,f) {
np <- n*p+0.5
i <<- floor(np)
f <<- np - i
qvalue <- data[i]
}
q7 <- function(data,n,p,i,f) {
np <- (n+1)*p
i <<- floor(np)
f <<- np - i
if (f==0) {
qvalue <- data[i]
} else {
qvalue <- f*data[i] + (1-f)*data[i+1]
}
}
q8 <- function(data,n,p,i,f) {
np <- (n+1)*p
i <<- floor(np)
f <<- np - i
if (f==0) {
qvalue <- data[i]
} else {
if (f == 0.5) {
qvalue <- (data[i]+data[i+1])/2
} else {
if (f < 0.5) {
qvalue <- data[i]
} else {
qvalue <- data[i+1]
}
}
}
}
lx <- length(x)
qval <- array(NA,dim=c(99,8))
mystep <- 25
mystart <- 25
if (lx>10){
mystep=10
mystart=10
}
if (lx>20){
mystep=5
mystart=5
}
if (lx>50){
mystep=2
mystart=2
}
if (lx>=100){
mystep=1
mystart=1
}
for (perc in seq(mystart,99,mystep)) {
qval[perc,1] <- q1(x,lx,perc/100,i,f)
qval[perc,2] <- q2(x,lx,perc/100,i,f)
qval[perc,3] <- q3(x,lx,perc/100,i,f)
qval[perc,4] <- q4(x,lx,perc/100,i,f)
qval[perc,5] <- q5(x,lx,perc/100,i,f)
qval[perc,6] <- q6(x,lx,perc/100,i,f)
qval[perc,7] <- q7(x,lx,perc/100,i,f)
qval[perc,8] <- q8(x,lx,perc/100,i,f)
}
bitmap(file='test1.png')
myqqnorm <- qqnorm(x,col=2)
qqline(x)
grid()
dev.off()
load(file='createtable')
a<-table.start()
a<-table.row.start(a)
a<-table.element(a,'Percentiles - Ungrouped Data',9,TRUE)
a<-table.row.end(a)
a<-table.row.start(a)
a<-table.element(a,'p',1,TRUE)
a<-table.element(a,hyperlink('method_1.htm', 'Weighted Average at Xnp',''),1,TRUE)
a<-table.element(a,hyperlink('method_2.htm','Weighted Average at X(n+1)p',''),1,TRUE)
a<-table.element(a,hyperlink('method_3.htm','Empirical Distribution Function',''),1,TRUE)
a<-table.element(a,hyperlink('method_4.htm','Empirical Distribution Function - Averaging',''),1,TRUE)
a<-table.element(a,hyperlink('method_5.htm','Empirical Distribution Function - Interpolation',''),1,TRUE)
a<-table.element(a,hyperlink('method_6.htm','Closest Observation',''),1,TRUE)
a<-table.element(a,hyperlink('method_7.htm','True Basic - Statistics Graphics Toolkit',''),1,TRUE)
a<-table.element(a,hyperlink('method_8.htm','MS Excel (old versions)',''),1,TRUE)
a<-table.row.end(a)
for (perc in seq(mystart,99,mystep)) {
a<-table.row.start(a)
a<-table.element(a,round(perc/100,2),1,TRUE)
for (j in 1:8) {
a<-table.element(a,round(qval[perc,j],6))
}
a<-table.row.end(a)
}
a<-table.end(a)
table.save(a,file='mytable.tab')