Free Statistics

of Irreproducible Research!

Author's title

Author*The author of this computation has been verified*
R Software Modulerwasp_correlation.wasp
Title produced by softwarePearson Correlation
Date of computationSun, 19 Oct 2008 06:39:36 -0600
Cite this page as followsStatistical Computations at FreeStatistics.org, Office for Research Development and Education, URL https://freestatistics.org/blog/index.php?v=date/2008/Oct/19/t1224420052eary6kz7lyhf499.htm/, Retrieved Sun, 19 May 2024 14:44:57 +0000
Statistical Computations at FreeStatistics.org, Office for Research Development and Education, URL https://freestatistics.org/blog/index.php?pk=16803, Retrieved Sun, 19 May 2024 14:44:57 +0000
QR Codes:

Original text written by user:
IsPrivate?No (this computation is public)
User-defined keywords
Estimated Impact159
Family? (F = Feedback message, R = changed R code, M = changed R Module, P = changed Parameters, D = changed Data)
F       [Pearson Correlation] [Q3 Pearson Correl...] [2008-10-19 12:39:36] [6912578025c824de531bc660dd61b996] [Current]
-         [Pearson Correlation] [Q3] [2008-10-20 18:48:36] [b47fceb71c9525e79a89b5fc6d023d0e]
Feedback Forum
2008-10-21 18:32:16 [Stefan Eyckmans] [reply
Het is niet echt nodig de berekening opnieuw uit te voeren aangezien het exact dezelfde gegevens zijn.
Je redenering ivm met de correlatie is niet helemaal correct. Er zijn drie referentiegetallen waarop je je kan baseren.
-1 < 0 < 1
Bij -1 spreek je van een negatieve correlatie, bij 0 spreek je van geen correlatie, en bij 1 spreek je van een positieve correlatie. De student had dus wel degelijk gelijk dat O,56... meer leunt naar 1 dan naar 0.

http://nl.wikipedia.org/wiki/Correlatie
  2008-10-22 14:32:02 [Pieter Broos] [reply
Als ik in mijn word document zeg dat de correlatie ligt tussen -1 en 1 bedoel ik natuurlijk - 1 > 0 > 1. Het klopt wel dat jouw formulering geen plaats laat voor interpretatie.
2008-10-24 20:50:11 [Kenny Simons] [reply
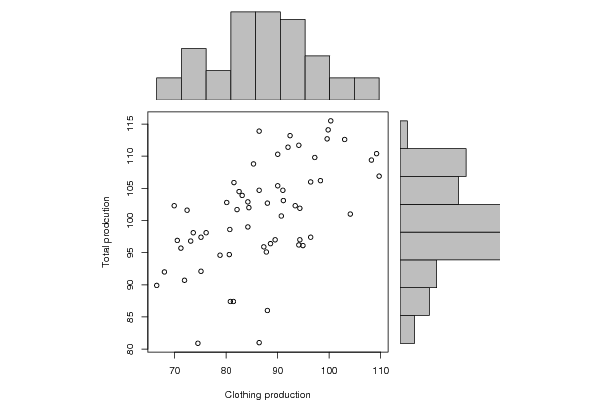
Stefan heeft gelijk, je kan ook naar het scatter plot kijken om af te leiden of er een relatie is of niet. Bij dit scatter plot kan je wel degelijk een oplopende rechte tekenen, waardoor we te maken hebben met een positieve correlatie.
2008-10-26 11:15:56 [Natascha Meeus] [reply
Ik ga akkoord met Stefan. We kunnen hier spreken over positieve correlatie omdat we een stijgende rechten kunnen tekenen.
2008-10-26 11:45:34 [Matthieu Blondeau] [reply
De correlatie bedraagt 0,56. Hieruit kunnen we afleiden dat het verband niet sterk is maar ook niet zwak. Om meer zekerheid te hebben moet men alleen maar naar de grafiek kijken. Men kan hier een rechte uit halen maar de punten staan niet heel dicht bij mekaar.
2008-10-26 17:28:11 [Chi-Kwong Man] [reply
Het antwoord van het voorbeeld exemplaar klopt, hij/zij zegt dat de uitkomst dichter bij 1 dan bij 0 ligt. Maar de correlatiecoëfficienten moeten inderdaad tussen -1 en 1 liggen. De correlatie is dus niet zwak, maar ook niet sterk. En verder kan men de scatterplot bekijken wat toch een beetje duidt op enig verband.
2008-10-27 07:23:59 [Glenn De Maeyer] [reply
De student maakt hier een kleine interpretatiefout i.v.m. de correlatiecoëfficiënt (-1 < 0 < 1). Indien de coëff. tussen -1 en 0 ligt spreken we van een negatieve correlatie, 0 is geen correlatie en tussen 0 en 1 dan spreken we van een positieve correlatie. Hier is sprake van een positieve correlatie. Hoe dichter de waarde tegen 1 aanleunt hoe hoger de correlatie. Naast de correlatiecoëfficiënt kunnen we dit ook afleiden aan de hand van grafiek. We zijn hier in staat om door de punten een stijgende rechte te tekenen, dit duidt op een positieve correlatie. Indien de correlatie negatief zou zijn zouden we dalende rechte kunnen tekenen. Indien er geen correlatie zou zijn, indien de coëfficiënt dus zou aanleunen tegen 0, zouden we een horizontale rechte kunnen tekenen.
2008-10-27 10:42:22 [Kim De Vos] [reply
Ik ga akkoord met de beredeneringen van hierboven
2008-10-27 10:44:30 [Kim De Vos] [reply
Ik ga akkoord met bovenvermelde redeneringen
2008-10-27 11:35:20 [66991d38d6a4b2d9fe97b6c889f3689c] [reply
je moet de correlatie inderdaad bekijken tussen -1<0<1 maar het is zo dat wanneer je positieve correlatie hebt (dus >0) je inderdaad de redenering van de student van vorig jaar volgt. wanneer de correlatie dus dichter bij 1 ligt is ze sterker, bij 0 is ze zwakker.
de correlatie die je hier bekomt is gemiddeld. dat zie je ook in de scatterplot. de punten liggen in een stijgende lijn maar verspreid over een groot vlak.
2008-10-27 18:22:16 [Jeroen Michel] [reply
Hier kan ik zeggen dat de student in het word document een te voorbarige conclusie maakt. De correlatie leunt niet zo dicht aan bij 1 als gedacht. De correlaties is ligt rond de 0,5 dit is niet sterk, maar ook niet zwak te noemen. Een sterke correlatie is dus eerder een te sterke conclusie.
2008-10-27 19:04:29 [Niels Stas] [reply
Zoals in bovenstaande comments al is gebleken is er een foutje ivm de interpretatie van de correlatiewaarde.
2008-10-28 06:35:48 [Nilay Erdogdu] [reply
zoals hierboven vemeld staat, ligt correlatiecoeifficiënt tussen -1<0<1. Hoe dichter het getal aanleunt bij 1, hoe sterker het verband. De correlatie is 57%, er is dus zeker een positieve correlatie. De verklaring zou kunnen zijn: seizoensgebonden. Je denkt dat er oorzakelijk verband is, misschien is het toeval?

Post a new message
Dataseries X:
109,20
88,60
94,30
98,30
86,40
80,60
104,10
108,20
93,40
71,90
94,10
94,90
96,40
91,10
84,40
86,40
88,00
75,10
109,70
103,00
82,10
68,00
96,40
94,30
90,00
88,00
76,10
82,50
81,40
66,50
97,20
94,10
80,70
70,50
87,80
89,50
99,60
84,20
75,10
92,00
80,80
73,10
99,80
90,00
83,10
72,40
78,80
87,30
91,00
80,10
73,60
86,40
74,50
71,20
92,40
81,50
85,30
69,90
84,20
90,70
100,30
Dataseries Y:
110,40
96,40
101,90
106,20
81,00
94,70
101,00
109,40
102,30
90,70
96,20
96,10
106,00
103,10
102,00
104,70
86,00
92,10
106,90
112,60
101,70
92,00
97,40
97,00
105,40
102,70
98,10
104,50
87,40
89,90
109,80
111,70
98,60
96,90
95,10
97,00
112,70
102,90
97,40
111,40
87,40
96,80
114,10
110,30
103,90
101,60
94,60
95,90
104,70
102,80
98,10
113,90
80,90
95,70
113,20
105,90
108,80
102,30
99,00
100,70
115,50


Summary of computational transaction
Raw Inputview raw input (R code)
Raw Outputview raw output of R engine
Computing time1 seconds
R Server'Gwilym Jenkins' @ 72.249.127.135

\begin{tabular}{lllllllll}
\hline
Summary of computational transaction \tabularnewline
Raw Input & view raw input (R code)  \tabularnewline
Raw Output & view raw output of R engine  \tabularnewline
Computing time & 1 seconds \tabularnewline
R Server & 'Gwilym Jenkins' @ 72.249.127.135 \tabularnewline
\hline
\end{tabular}
%Source: https://freestatistics.org/blog/index.php?pk=16803&T=0

[TABLE]
[ROW][C]Summary of computational transaction[/C][/ROW]
[ROW][C]Raw Input[/C][C]view raw input (R code) [/C][/ROW]
[ROW][C]Raw Output[/C][C]view raw output of R engine [/C][/ROW]
[ROW][C]Computing time[/C][C]1 seconds[/C][/ROW]
[ROW][C]R Server[/C][C]'Gwilym Jenkins' @ 72.249.127.135[/C][/ROW]
[/TABLE]
Source: https://freestatistics.org/blog/index.php?pk=16803&T=0

Globally Unique Identifier (entire table): ba.freestatistics.org/blog/index.php?pk=16803&T=0

As an alternative you can also use a QR Code:  

The GUIDs for individual cells are displayed in the table below:

Summary of computational transaction
Raw Inputview raw input (R code)
Raw Outputview raw output of R engine
Computing time1 seconds
R Server'Gwilym Jenkins' @ 72.249.127.135


Pearson Product Moment Correlation - Ungrouped Data
StatisticVariable XVariable Y
Mean86.8934426229508100.908196721311
Biased Variance109.89176027949564.2309164203171
Biased Standard Deviation10.48292708548028.01441928153981
Covariance48.2815546448088
Correlation0.565259717157914
Determination0.319518547841445
T-Test5.2633941884171
p-value (2 sided)2.07228182791397e-06
p-value (1 sided)1.03614091395698e-06
Degrees of Freedom59
Number of Observations61

\begin{tabular}{lllllllll}
\hline
Pearson Product Moment Correlation - Ungrouped Data \tabularnewline
Statistic & Variable X & Variable Y \tabularnewline
Mean & 86.8934426229508 & 100.908196721311 \tabularnewline
Biased Variance & 109.891760279495 & 64.2309164203171 \tabularnewline
Biased Standard Deviation & 10.4829270854802 & 8.01441928153981 \tabularnewline
Covariance & 48.2815546448088 \tabularnewline
Correlation & 0.565259717157914 \tabularnewline
Determination & 0.319518547841445 \tabularnewline
T-Test & 5.2633941884171 \tabularnewline
p-value (2 sided) & 2.07228182791397e-06 \tabularnewline
p-value (1 sided) & 1.03614091395698e-06 \tabularnewline
Degrees of Freedom & 59 \tabularnewline
Number of Observations & 61 \tabularnewline
\hline
\end{tabular}
%Source: https://freestatistics.org/blog/index.php?pk=16803&T=1

[TABLE]
[ROW][C]Pearson Product Moment Correlation - Ungrouped Data[/C][/ROW]
[ROW][C]Statistic[/C][C]Variable X[/C][C]Variable Y[/C][/ROW]
[ROW][C]Mean[/C][C]86.8934426229508[/C][C]100.908196721311[/C][/ROW]
[ROW][C]Biased Variance[/C][C]109.891760279495[/C][C]64.2309164203171[/C][/ROW]
[ROW][C]Biased Standard Deviation[/C][C]10.4829270854802[/C][C]8.01441928153981[/C][/ROW]
[ROW][C]Covariance[/C][C]48.2815546448088[/C][/ROW]
[ROW][C]Correlation[/C][C]0.565259717157914[/C][/ROW]
[ROW][C]Determination[/C][C]0.319518547841445[/C][/ROW]
[ROW][C]T-Test[/C][C]5.2633941884171[/C][/ROW]
[ROW][C]p-value (2 sided)[/C][C]2.07228182791397e-06[/C][/ROW]
[ROW][C]p-value (1 sided)[/C][C]1.03614091395698e-06[/C][/ROW]
[ROW][C]Degrees of Freedom[/C][C]59[/C][/ROW]
[ROW][C]Number of Observations[/C][C]61[/C][/ROW]
[/TABLE]
Source: https://freestatistics.org/blog/index.php?pk=16803&T=1

Globally Unique Identifier (entire table): ba.freestatistics.org/blog/index.php?pk=16803&T=1

As an alternative you can also use a QR Code:  

The GUIDs for individual cells are displayed in the table below:

Pearson Product Moment Correlation - Ungrouped Data
StatisticVariable XVariable Y
Mean86.8934426229508100.908196721311
Biased Variance109.89176027949564.2309164203171
Biased Standard Deviation10.48292708548028.01441928153981
Covariance48.2815546448088
Correlation0.565259717157914
Determination0.319518547841445
T-Test5.2633941884171
p-value (2 sided)2.07228182791397e-06
p-value (1 sided)1.03614091395698e-06
Degrees of Freedom59
Number of Observations61


Parameters (Session):
Parameters (R input):
R code (references can be found in the software module):
bitmap(file='test1.png')
histx <- hist(x, plot=FALSE)
histy <- hist(y, plot=FALSE)
maxcounts <- max(c(histx$counts, histx$counts))
xrange <- c(min(x),max(x))
yrange <- c(min(y),max(y))
nf <- layout(matrix(c(2,0,1,3),2,2,byrow=TRUE), c(3,1), c(1,3), TRUE)
par(mar=c(4,4,1,1))
plot(x, y, xlim=xrange, ylim=yrange, xlab=xlab, ylab=ylab)
par(mar=c(0,4,1,1))
barplot(histx$counts, axes=FALSE, ylim=c(0, maxcounts), space=0)
par(mar=c(4,0,1,1))
barplot(histy$counts, axes=FALSE, xlim=c(0, maxcounts), space=0, horiz=TRUE)
dev.off()
lx = length(x)
makebiased = (lx-1)/lx
varx = var(x)*makebiased
vary = var(y)*makebiased
corxy <- cor.test(x,y,method='pearson')
cxy <- as.matrix(corxy$estimate)[1,1]
load(file='createtable')
a<-table.start()
a<-table.row.start(a)
a<-table.element(a,'Pearson Product Moment Correlation - Ungrouped Data',3,TRUE)
a<-table.row.end(a)
a<-table.row.start(a)
a<-table.element(a,'Statistic',1,TRUE)
a<-table.element(a,'Variable X',1,TRUE)
a<-table.element(a,'Variable Y',1,TRUE)
a<-table.row.end(a)
a<-table.row.start(a)
a<-table.element(a,hyperlink('arithmetic_mean.htm','Mean',''),header=TRUE)
a<-table.element(a,mean(x))
a<-table.element(a,mean(y))
a<-table.row.end(a)
a<-table.row.start(a)
a<-table.element(a,hyperlink('biased.htm','Biased Variance',''),header=TRUE)
a<-table.element(a,varx)
a<-table.element(a,vary)
a<-table.row.end(a)
a<-table.row.start(a)
a<-table.element(a,hyperlink('biased1.htm','Biased Standard Deviation',''),header=TRUE)
a<-table.element(a,sqrt(varx))
a<-table.element(a,sqrt(vary))
a<-table.row.end(a)
a<-table.row.start(a)
a<-table.element(a,hyperlink('covariance.htm','Covariance',''),header=TRUE)
a<-table.element(a,cov(x,y),2)
a<-table.row.end(a)
a<-table.row.start(a)
a<-table.element(a,hyperlink('pearson_correlation.htm','Correlation',''),header=TRUE)
a<-table.element(a,cxy,2)
a<-table.row.end(a)
a<-table.row.start(a)
a<-table.element(a,hyperlink('coeff_of_determination.htm','Determination',''),header=TRUE)
a<-table.element(a,cxy*cxy,2)
a<-table.row.end(a)
a<-table.row.start(a)
a<-table.element(a,hyperlink('ttest_statistic.htm','T-Test',''),header=TRUE)
a<-table.element(a,as.matrix(corxy$statistic)[1,1],2)
a<-table.row.end(a)
a<-table.row.start(a)
a<-table.element(a,'p-value (2 sided)',header=TRUE)
a<-table.element(a,(p2 <- as.matrix(corxy$p.value)[1,1]),2)
a<-table.row.end(a)
a<-table.row.start(a)
a<-table.element(a,'p-value (1 sided)',header=TRUE)
a<-table.element(a,p2/2,2)
a<-table.row.end(a)
a<-table.row.start(a)
a<-table.element(a,'Degrees of Freedom',header=TRUE)
a<-table.element(a,lx-2,2)
a<-table.row.end(a)
a<-table.row.start(a)
a<-table.element(a,'Number of Observations',header=TRUE)
a<-table.element(a,lx,2)
a<-table.row.end(a)
a<-table.end(a)
table.save(a,file='mytable.tab')