Free Statistics
of Irreproducible Research!
Description of Statistical Computation | |||||||||||||||||||||||||||||||||||||||||
|---|---|---|---|---|---|---|---|---|---|---|---|---|---|---|---|---|---|---|---|---|---|---|---|---|---|---|---|---|---|---|---|---|---|---|---|---|---|---|---|---|---|
| Author's title | |||||||||||||||||||||||||||||||||||||||||
| Author | *The author of this computation has been verified* | ||||||||||||||||||||||||||||||||||||||||
| R Software Module | rwasp_univariatedataseries.wasp | ||||||||||||||||||||||||||||||||||||||||
| Title produced by software | Univariate Data Series | ||||||||||||||||||||||||||||||||||||||||
| Date of computation | Sun, 19 Oct 2008 05:32:03 -0600 | ||||||||||||||||||||||||||||||||||||||||
| Cite this page as follows | Statistical Computations at FreeStatistics.org, Office for Research Development and Education, URL https://freestatistics.org/blog/index.php?v=date/2008/Oct/19/t1224415987mmp5fyd86ko74vc.htm/, Retrieved Sun, 19 May 2024 16:28:43 +0000 | ||||||||||||||||||||||||||||||||||||||||
| Statistical Computations at FreeStatistics.org, Office for Research Development and Education, URL https://freestatistics.org/blog/index.php?pk=16762, Retrieved Sun, 19 May 2024 16:28:43 +0000 | |||||||||||||||||||||||||||||||||||||||||
| QR Codes: | |||||||||||||||||||||||||||||||||||||||||
|
| |||||||||||||||||||||||||||||||||||||||||
| Original text written by user: | |||||||||||||||||||||||||||||||||||||||||
| IsPrivate? | No (this computation is public) | ||||||||||||||||||||||||||||||||||||||||
| User-defined keywords | |||||||||||||||||||||||||||||||||||||||||
| Estimated Impact | 191 | ||||||||||||||||||||||||||||||||||||||||
Tree of Dependent Computations | |||||||||||||||||||||||||||||||||||||||||
| Family? (F = Feedback message, R = changed R code, M = changed R Module, P = changed Parameters, D = changed Data) | |||||||||||||||||||||||||||||||||||||||||
| F [Univariate Data Series] [wisselkoers] [2008-10-13 18:59:10] [57ce5bd741080980f0f51979adb31ad8] - PD [Univariate Data Series] [index der consump...] [2008-10-19 11:17:46] [4ad596f10399a71ad29b7d76e6ab90ac] - PD [Univariate Data Series] [bezineprijs 95] [2008-10-19 11:22:46] [4ad596f10399a71ad29b7d76e6ab90ac] - PD [Univariate Data Series] [gezondheidsindex] [2008-10-19 11:26:20] [4ad596f10399a71ad29b7d76e6ab90ac] - PD [Univariate Data Series] [prijsevolutie tabak] [2008-10-19 11:32:03] [577b699a0819d2125728ba9ae2c57238] [Current] | |||||||||||||||||||||||||||||||||||||||||
| Feedback Forum | |||||||||||||||||||||||||||||||||||||||||
Post a new message | |||||||||||||||||||||||||||||||||||||||||
Dataset | |||||||||||||||||||||||||||||||||||||||||
| Dataseries X: | |||||||||||||||||||||||||||||||||||||||||
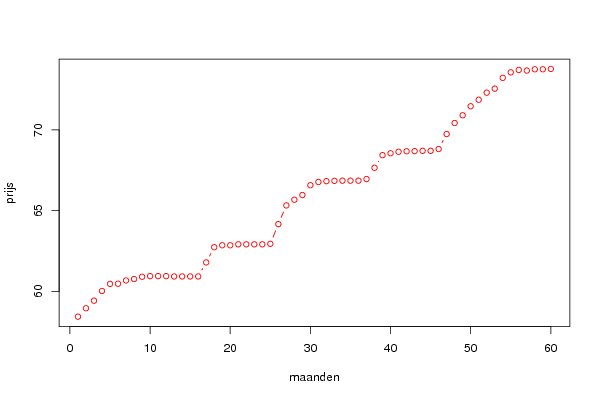
58,44 58,96 59,43 60,03 60,47 60,48 60,68 60,77 60,91 60,95 60,95 60,95 60,93 60,93 60,93 60,93 61,8 62,74 62,86 62,86 62,92 62,92 62,92 62,92 62,95 64,17 65,33 65,68 65,97 66,58 66,78 66,83 66,85 66,86 66,86 66,86 66,96 67,66 68,44 68,56 68,65 68,68 68,69 68,71 68,71 68,82 69,75 70,43 70,91 71,47 71,87 72,31 72,56 73,23 73,57 73,72 73,68 73,76 73,76 73,78 | |||||||||||||||||||||||||||||||||||||||||
Tables (Output of Computation) | |||||||||||||||||||||||||||||||||||||||||
| |||||||||||||||||||||||||||||||||||||||||
Figures (Output of Computation) | |||||||||||||||||||||||||||||||||||||||||
Input Parameters & R Code | |||||||||||||||||||||||||||||||||||||||||
| Parameters (Session): | |||||||||||||||||||||||||||||||||||||||||
| par1 = prijs tabak ; par2 = http://www.nbb.be/belgostat/PresentationLinker?TableId=151000097&Lang=N ; par3 = prijsevolutie van de tabak ; | |||||||||||||||||||||||||||||||||||||||||
| Parameters (R input): | |||||||||||||||||||||||||||||||||||||||||
| par1 = prijs tabak ; par2 = http://www.nbb.be/belgostat/PresentationLinker?TableId=151000097&Lang=N ; par3 = prijsevolutie van de tabak ; | |||||||||||||||||||||||||||||||||||||||||
| R code (references can be found in the software module): | |||||||||||||||||||||||||||||||||||||||||
bitmap(file='test1.png') | |||||||||||||||||||||||||||||||||||||||||