Free Statistics
of Irreproducible Research!
Description of Statistical Computation | |||||||||||||||||||||||||||||||||||||||||
|---|---|---|---|---|---|---|---|---|---|---|---|---|---|---|---|---|---|---|---|---|---|---|---|---|---|---|---|---|---|---|---|---|---|---|---|---|---|---|---|---|---|
| Author's title | |||||||||||||||||||||||||||||||||||||||||
| Author | *The author of this computation has been verified* | ||||||||||||||||||||||||||||||||||||||||
| R Software Module | rwasp_univariatedataseries.wasp | ||||||||||||||||||||||||||||||||||||||||
| Title produced by software | Univariate Data Series | ||||||||||||||||||||||||||||||||||||||||
| Date of computation | Sun, 19 Oct 2008 04:59:22 -0600 | ||||||||||||||||||||||||||||||||||||||||
| Cite this page as follows | Statistical Computations at FreeStatistics.org, Office for Research Development and Education, URL https://freestatistics.org/blog/index.php?v=date/2008/Oct/19/t1224414043qttt82yv0ga4afr.htm/, Retrieved Sun, 19 May 2024 13:53:27 +0000 | ||||||||||||||||||||||||||||||||||||||||
| Statistical Computations at FreeStatistics.org, Office for Research Development and Education, URL https://freestatistics.org/blog/index.php?pk=16745, Retrieved Sun, 19 May 2024 13:53:27 +0000 | |||||||||||||||||||||||||||||||||||||||||
| QR Codes: | |||||||||||||||||||||||||||||||||||||||||
|
| |||||||||||||||||||||||||||||||||||||||||
| Original text written by user: | |||||||||||||||||||||||||||||||||||||||||
| IsPrivate? | No (this computation is public) | ||||||||||||||||||||||||||||||||||||||||
| User-defined keywords | |||||||||||||||||||||||||||||||||||||||||
| Estimated Impact | 165 | ||||||||||||||||||||||||||||||||||||||||
Tree of Dependent Computations | |||||||||||||||||||||||||||||||||||||||||
| Family? (F = Feedback message, R = changed R code, M = changed R Module, P = changed Parameters, D = changed Data) | |||||||||||||||||||||||||||||||||||||||||
| F [Univariate Data Series] [Evolutie algemene...] [2008-10-13 20:58:40] [cf45c678b7899ee33d7b061948f80651] - PD [Univariate Data Series] [tijdsreeksen] [2008-10-19 10:59:22] [577b699a0819d2125728ba9ae2c57238] [Current] | |||||||||||||||||||||||||||||||||||||||||
| Feedback Forum | |||||||||||||||||||||||||||||||||||||||||
Post a new message | |||||||||||||||||||||||||||||||||||||||||
Dataset | |||||||||||||||||||||||||||||||||||||||||
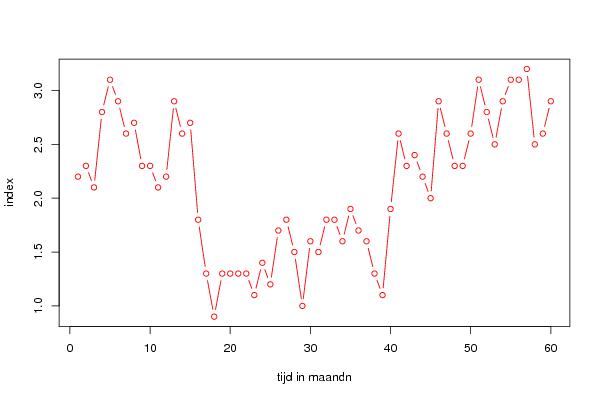
| Dataseries X: | |||||||||||||||||||||||||||||||||||||||||
2,2 2,3 2,1 2,8 3,1 2,9 2,6 2,7 2,3 2,3 2,1 2,2 2,9 2,6 2,7 1,8 1,3 0,9 1,3 1,3 1,3 1,3 1,1 1,4 1,2 1,7 1,8 1,5 1 1,6 1,5 1,8 1,8 1,6 1,9 1,7 1,6 1,3 1,1 1,9 2,6 2,3 2,4 2,2 2 2,9 2,6 2,3 2,3 2,6 3,1 2,8 2,5 2,9 3,1 3,1 3,2 2,5 2,6 2,9 | |||||||||||||||||||||||||||||||||||||||||
Tables (Output of Computation) | |||||||||||||||||||||||||||||||||||||||||
| |||||||||||||||||||||||||||||||||||||||||
Figures (Output of Computation) | |||||||||||||||||||||||||||||||||||||||||
Input Parameters & R Code | |||||||||||||||||||||||||||||||||||||||||
| Parameters (Session): | |||||||||||||||||||||||||||||||||||||||||
| par1 = Algemene index der consumptieprijzen ; par2 = http://www.nbb.be/belgostat/PublicatieSelectieLinker?LinkID=607000039|910000082&Lang=N ; par3 = Evolutie algemene index ; | |||||||||||||||||||||||||||||||||||||||||
| Parameters (R input): | |||||||||||||||||||||||||||||||||||||||||
| par1 = Algemene index der consumptieprijzen ; par2 = http://www.nbb.be/belgostat/PublicatieSelectieLinker?LinkID=607000039|910000082&Lang=N ; par3 = Evolutie algemene index ; | |||||||||||||||||||||||||||||||||||||||||
| R code (references can be found in the software module): | |||||||||||||||||||||||||||||||||||||||||
bitmap(file='test1.png') | |||||||||||||||||||||||||||||||||||||||||