Free Statistics
of Irreproducible Research!
Description of Statistical Computation | |||||||||||||||||||||||||||||||||||||||||
|---|---|---|---|---|---|---|---|---|---|---|---|---|---|---|---|---|---|---|---|---|---|---|---|---|---|---|---|---|---|---|---|---|---|---|---|---|---|---|---|---|---|
| Author's title | |||||||||||||||||||||||||||||||||||||||||
| Author | *The author of this computation has been verified* | ||||||||||||||||||||||||||||||||||||||||
| R Software Module | rwasp_univariatedataseries.wasp | ||||||||||||||||||||||||||||||||||||||||
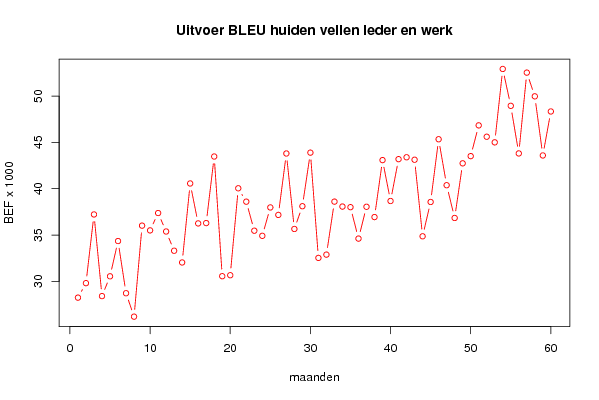
| Title produced by software | Univariate Data Series | ||||||||||||||||||||||||||||||||||||||||
| Date of computation | Sat, 18 Oct 2008 11:31:21 -0600 | ||||||||||||||||||||||||||||||||||||||||
| Cite this page as follows | Statistical Computations at FreeStatistics.org, Office for Research Development and Education, URL https://freestatistics.org/blog/index.php?v=date/2008/Oct/18/t1224351121689rwbl6z8fda8v.htm/, Retrieved Sun, 19 May 2024 13:08:16 +0000 | ||||||||||||||||||||||||||||||||||||||||
| Statistical Computations at FreeStatistics.org, Office for Research Development and Education, URL https://freestatistics.org/blog/index.php?pk=16681, Retrieved Sun, 19 May 2024 13:08:16 +0000 | |||||||||||||||||||||||||||||||||||||||||
| QR Codes: | |||||||||||||||||||||||||||||||||||||||||
|
| |||||||||||||||||||||||||||||||||||||||||
| Original text written by user: | |||||||||||||||||||||||||||||||||||||||||
| IsPrivate? | No (this computation is public) | ||||||||||||||||||||||||||||||||||||||||
| User-defined keywords | |||||||||||||||||||||||||||||||||||||||||
| Estimated Impact | 132 | ||||||||||||||||||||||||||||||||||||||||
Tree of Dependent Computations | |||||||||||||||||||||||||||||||||||||||||
| Family? (F = Feedback message, R = changed R code, M = changed R Module, P = changed Parameters, D = changed Data) | |||||||||||||||||||||||||||||||||||||||||
| - [Univariate Data Series] [Uitvoer BLEU huid...] [2008-10-18 17:31:21] [6d40a467de0f28bd2350f82ac9522c51] [Current] | |||||||||||||||||||||||||||||||||||||||||
| Feedback Forum | |||||||||||||||||||||||||||||||||||||||||
Post a new message | |||||||||||||||||||||||||||||||||||||||||
Dataset | |||||||||||||||||||||||||||||||||||||||||
| Dataseries X: | |||||||||||||||||||||||||||||||||||||||||
28,235 29,801 37,222 28,402 30,54 34,35 28,713 26,181 36,015 35,501 37,376 35,38 33,302 32,035 40,569 36,255 36,291 43,483 30,551 30,658 40,05 38,603 35,466 34,914 37,98 37,173 43,808 35,656 38,111 43,901 32,528 32,882 38,607 38,075 38,009 34,615 38,052 36,941 43,094 38,676 43,196 43,4 43,133 34,862 38,572 45,347 40,38 36,841 42,746 43,523 46,847 45,618 45,013 52,942 48,958 43,816 52,544 49,985 43,597 48,348 | |||||||||||||||||||||||||||||||||||||||||
Tables (Output of Computation) | |||||||||||||||||||||||||||||||||||||||||
| |||||||||||||||||||||||||||||||||||||||||
Figures (Output of Computation) | |||||||||||||||||||||||||||||||||||||||||
Input Parameters & R Code | |||||||||||||||||||||||||||||||||||||||||
| Parameters (Session): | |||||||||||||||||||||||||||||||||||||||||
| par1 = Uitvoer BLEU huiden vellen leder en werken daarvan ; par2 = http://www.nbb.be/belgostat/PublicatieSelectieLinker?prop=treeviewArch&LinkID=211000074|520000068&Lang=N ; par3 = 1993 tot 1997 ; | |||||||||||||||||||||||||||||||||||||||||
| Parameters (R input): | |||||||||||||||||||||||||||||||||||||||||
| par1 = Uitvoer BLEU huiden vellen leder en werken daarvan ; par2 = http://www.nbb.be/belgostat/PublicatieSelectieLinker?prop=treeviewArch&LinkID=211000074|520000068&Lang=N ; par3 = 1993 tot 1997 ; | |||||||||||||||||||||||||||||||||||||||||
| R code (references can be found in the software module): | |||||||||||||||||||||||||||||||||||||||||
bitmap(file='test1.png') | |||||||||||||||||||||||||||||||||||||||||