Free Statistics
of Irreproducible Research!
Description of Statistical Computation | |||||||||||||||||||||||||||||||||||||||||
|---|---|---|---|---|---|---|---|---|---|---|---|---|---|---|---|---|---|---|---|---|---|---|---|---|---|---|---|---|---|---|---|---|---|---|---|---|---|---|---|---|---|
| Author's title | |||||||||||||||||||||||||||||||||||||||||
| Author | *The author of this computation has been verified* | ||||||||||||||||||||||||||||||||||||||||
| R Software Module | rwasp_univariatedataseries.wasp | ||||||||||||||||||||||||||||||||||||||||
| Title produced by software | Univariate Data Series | ||||||||||||||||||||||||||||||||||||||||
| Date of computation | Sat, 18 Oct 2008 07:15:08 -0600 | ||||||||||||||||||||||||||||||||||||||||
| Cite this page as follows | Statistical Computations at FreeStatistics.org, Office for Research Development and Education, URL https://freestatistics.org/blog/index.php?v=date/2008/Oct/18/t12243357557g0xgu2sa891vdp.htm/, Retrieved Sun, 19 May 2024 15:25:57 +0000 | ||||||||||||||||||||||||||||||||||||||||
| Statistical Computations at FreeStatistics.org, Office for Research Development and Education, URL https://freestatistics.org/blog/index.php?pk=16613, Retrieved Sun, 19 May 2024 15:25:57 +0000 | |||||||||||||||||||||||||||||||||||||||||
| QR Codes: | |||||||||||||||||||||||||||||||||||||||||
|
| |||||||||||||||||||||||||||||||||||||||||
| Original text written by user: | |||||||||||||||||||||||||||||||||||||||||
| IsPrivate? | No (this computation is public) | ||||||||||||||||||||||||||||||||||||||||
| User-defined keywords | |||||||||||||||||||||||||||||||||||||||||
| Estimated Impact | 135 | ||||||||||||||||||||||||||||||||||||||||
Tree of Dependent Computations | |||||||||||||||||||||||||||||||||||||||||
| Family? (F = Feedback message, R = changed R code, M = changed R Module, P = changed Parameters, D = changed Data) | |||||||||||||||||||||||||||||||||||||||||
| F [Univariate Data Series] [Derde tijdreeks] [2008-10-11 15:55:51] [c45c87b96bbf32ffc2144fc37d767b2e] - PD [Univariate Data Series] [aantal begonnen w...] [2008-10-18 13:15:08] [3dc594a6c62226e1e98766c4d385bfaa] [Current] - P [Univariate Data Series] [aantal begonnen w...] [2008-10-19 17:33:20] [c45c87b96bbf32ffc2144fc37d767b2e] | |||||||||||||||||||||||||||||||||||||||||
| Feedback Forum | |||||||||||||||||||||||||||||||||||||||||
Post a new message | |||||||||||||||||||||||||||||||||||||||||
Dataset | |||||||||||||||||||||||||||||||||||||||||
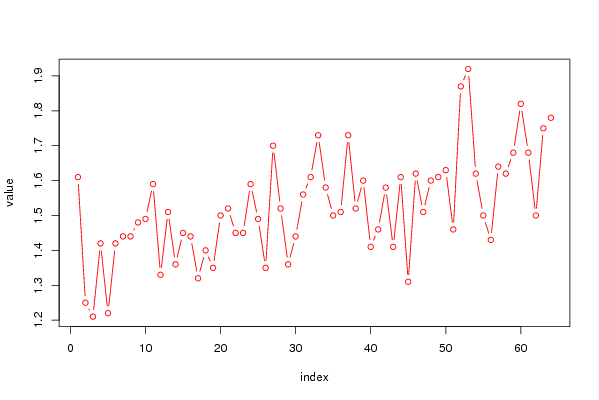
| Dataseries X: | |||||||||||||||||||||||||||||||||||||||||
1.61 1.25 1.21 1.42 1.22 1.42 1.44 1.44 1.48 1.49 1.59 1.33 1.51 1.36 1.45 1.44 1.32 1.40 1.35 1.50 1.52 1.45 1.45 1.59 1.49 1.35 1.70 1.52 1.36 1.44 1.56 1.61 1.73 1.58 1.50 1.51 1.73 1.52 1.60 1.41 1.46 1.58 1.41 1.61 1.31 1.62 1.51 1.60 1.61 1.63 1.46 1.87 1.92 1.62 1.50 1.43 1.64 1.62 1.68 1.82 1.68 1.50 1.75 1.78 | |||||||||||||||||||||||||||||||||||||||||
Tables (Output of Computation) | |||||||||||||||||||||||||||||||||||||||||
| |||||||||||||||||||||||||||||||||||||||||
Figures (Output of Computation) | |||||||||||||||||||||||||||||||||||||||||
Input Parameters & R Code | |||||||||||||||||||||||||||||||||||||||||
| Parameters (Session): | |||||||||||||||||||||||||||||||||||||||||
| par1 = Aantal woongelegenheden per gebouw Walloni� ; par2 = http://www.nbb.be/belgostat/PublicatieSelectieLinker?LinkID=321000001|910000082&Lang=N ; | |||||||||||||||||||||||||||||||||||||||||
| Parameters (R input): | |||||||||||||||||||||||||||||||||||||||||
| par1 = Aantal woongelegenheden per gebouw Walloni� ; par2 = http://www.nbb.be/belgostat/PublicatieSelectieLinker?LinkID=321000001|910000082&Lang=N ; par3 = ; | |||||||||||||||||||||||||||||||||||||||||
| R code (references can be found in the software module): | |||||||||||||||||||||||||||||||||||||||||
bitmap(file='test1.png') | |||||||||||||||||||||||||||||||||||||||||