Free Statistics

of Irreproducible Research!

Author's title

Author*The author of this computation has been verified*
R Software Modulerwasp_centraltendency.wasp
Title produced by softwareCentral Tendency
Date of computationSat, 18 Oct 2008 04:25:00 -0600
Cite this page as followsStatistical Computations at FreeStatistics.org, Office for Research Development and Education, URL https://freestatistics.org/blog/index.php?v=date/2008/Oct/18/t12243256925gg1qhcv6qowqmi.htm/, Retrieved Sun, 19 May 2024 16:09:11 +0000
Statistical Computations at FreeStatistics.org, Office for Research Development and Education, URL https://freestatistics.org/blog/index.php?pk=16558, Retrieved Sun, 19 May 2024 16:09:11 +0000
QR Codes:

Original text written by user:
IsPrivate?No (this computation is public)
User-defined keywords
Estimated Impact184
Family? (F = Feedback message, R = changed R code, M = changed R Module, P = changed Parameters, D = changed Data)
F     [Back to Back Histogram] [Q8 - 1 2 ] [2008-10-18 09:47:41] [a0d819c22534897f04a2f0b92f1eb36a]
F   PD  [Back to Back Histogram] [Q8 - 1 3 ] [2008-10-18 09:53:12] [a0d819c22534897f04a2f0b92f1eb36a]
F RMPD      [Central Tendency] [Uitvoer Intra-EU] [2008-10-18 10:25:00] [5f3e73ccf1ddc75508eed47fa51813d3] [Current]
Feedback Forum
2008-10-27 16:55:08 [Bernard Femont] [reply
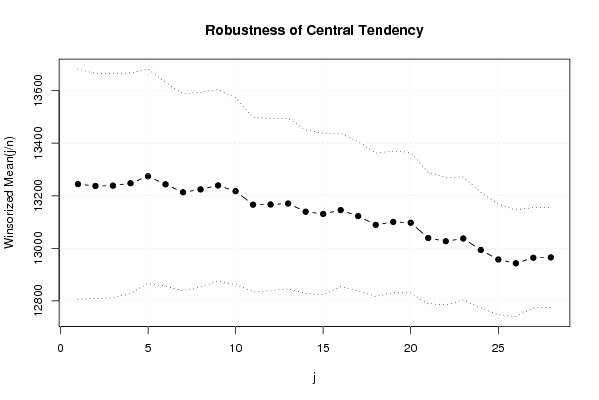
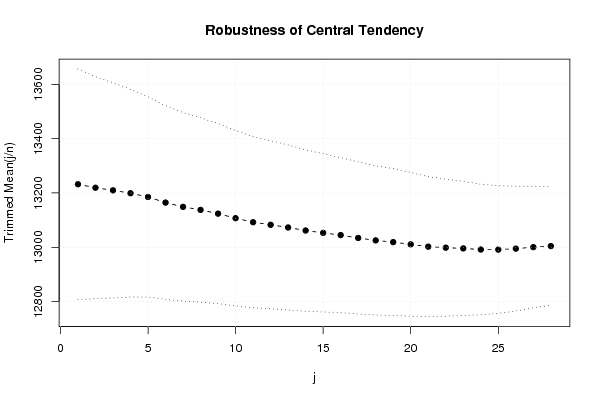
Er is een dalende tendens op te merken in deze grafiek. Gemakkelijk om een voorspelling kunnen zou u dan denken, maar toch is er een opmerkelijk gegeven wanneer u de grafiek van de robustness of Central Tendency bekijkt. Hier gaat de grafiek op het einde lichtjes naar een constante toe.
2008-10-27 19:04:08 [Nathalie Boden] [reply
We zien dat er op beide grafieken zich een neerwaartse tendens zich voordoet. Dit zal zich in de toekomst verderzetten. Als we kijken naar de 'Robustness of Central Tendency' zien we dat meer en meer op een vast patroon gaan vormen dit wil zeggen een constante.

Post a new message
Dataseries X:
12112
10875,2
9897,3
11672,1
12385,7
11405,6
9830,9
11025,1
10853,8
12252,6
11839,4
11669,1
11601,4
11178,4
9516,4
12102,8
12989
11610,2
10205,5
11356,2
11307,1
12648,6
11947,2
11714,1
12192,5
11268,8
9097,4
12639,8
13040,1
11687,3
11191,7
11391,9
11793,1
13933,2
12778,1
11810,3
13698,4
11956,6
10723,8
13938,9
13979,8
13807,4
12973,9
12509,8
12934,1
14908,3
13772,1
13012,6
14049,9
11816,5
11593,2
14466,2
13615,9
14733,9
13880,7
13527,5
13584
16170,2
13260,6
14741,9
15486,5
13154,5
12621,2
15031,6
15452,4
15428
13105,9
14716,8
14180
16202,2
14392,4
15140,6
15960,1
14351,3
13230,2
15202,1
17157,3
16159,1
13405,7
17224,7
17338,4
17370,6
18817,8
16593,2
17979,5


Summary of computational transaction
Raw Inputview raw input (R code)
Raw Outputview raw output of R engine
Computing time1 seconds
R Server'Gwilym Jenkins' @ 72.249.127.135

\begin{tabular}{lllllllll}
\hline
Summary of computational transaction \tabularnewline
Raw Input & view raw input (R code)  \tabularnewline
Raw Output & view raw output of R engine  \tabularnewline
Computing time & 1 seconds \tabularnewline
R Server & 'Gwilym Jenkins' @ 72.249.127.135 \tabularnewline
\hline
\end{tabular}
%Source: https://freestatistics.org/blog/index.php?pk=16558&T=0

[TABLE]
[ROW][C]Summary of computational transaction[/C][/ROW]
[ROW][C]Raw Input[/C][C]view raw input (R code) [/C][/ROW]
[ROW][C]Raw Output[/C][C]view raw output of R engine [/C][/ROW]
[ROW][C]Computing time[/C][C]1 seconds[/C][/ROW]
[ROW][C]R Server[/C][C]'Gwilym Jenkins' @ 72.249.127.135[/C][/ROW]
[/TABLE]
Source: https://freestatistics.org/blog/index.php?pk=16558&T=0

Globally Unique Identifier (entire table): ba.freestatistics.org/blog/index.php?pk=16558&T=0

As an alternative you can also use a QR Code:  

The GUIDs for individual cells are displayed in the table below:

Summary of computational transaction
Raw Inputview raw input (R code)
Raw Outputview raw output of R engine
Computing time1 seconds
R Server'Gwilym Jenkins' @ 72.249.127.135


Central Tendency - Ungrouped Data
MeasureValueS.E.Value/S.E.
Arithmetic Mean13249.1552941176223.10796107610059.3845025978184
Geometric Mean13095.3917123946
Harmonic Mean12945.358986721
Quadratic Mean13406.0209473382
Winsorized Mean ( 1 / 28 )13244.2223529412219.32849442341260.3853247055685
Winsorized Mean ( 2 / 28 )13237.2952941176214.39186194985261.7434597270951
Winsorized Mean ( 3 / 28 )13238.5023529412213.69189919472161.9513533401561
Winsorized Mean ( 4 / 28 )13247.6552941176209.87517621112963.1215922400983
Winsorized Mean ( 5 / 28 )13274.1788235294204.07537658422965.045470187094
Winsorized Mean ( 6 / 28 )13243.5364705882194.10950465624068.2271406237525
Winsorized Mean ( 7 / 28 )13213.0988235294187.48187206107270.476674242005
Winsorized Mean ( 8 / 28 )13224.1952941176184.86384547520971.5347842090143
Winsorized Mean ( 9 / 28 )13239.2517647059182.39900381512572.5840135515479
Winsorized Mean ( 10 / 28 )13217.4047058824177.80623877906074.3360007873862
Winsorized Mean ( 11 / 28 )13166.0929411765165.69507519351479.459772270237
Winsorized Mean ( 12 / 28 )13166.6858823529164.16165063206380.2056133796044
Winsorized Mean ( 13 / 28 )13170.4635294118162.53853766557181.0297897259938
Winsorized Mean ( 14 / 28 )13139.1364705882155.74255639844084.3644587223423
Winsorized Mean ( 15 / 28 )13130.7011764706153.71917278796685.4200613906668
Winsorized Mean ( 16 / 28 )13145.4964705882145.94575441219390.0711125413183
Winsorized Mean ( 17 / 28 )13122.4764705882141.99361397885592.4159622596998
Winsorized Mean ( 18 / 28 )13089.1023529412136.57651746615795.8371365427781
Winsorized Mean ( 19 / 28 )13100.48134.63669036186597.3024512470537
Winsorized Mean ( 20 / 28 )13097.1623529412133.96721967225097.7639334830068
Winsorized Mean ( 21 / 28 )13039.0047058824124.809386754945104.471346626225
Winsorized Mean ( 22 / 28 )13026.84121.335496112254107.362152192860
Winsorized Mean ( 23 / 28 )13037.0952941176117.119053531082111.314896262014
Winsorized Mean ( 24 / 28 )12993.5847058824110.166630190723117.944832145520
Winsorized Mean ( 25 / 28 )12957.1435294118105.109470684533123.272845396589
Winsorized Mean ( 26 / 28 )12942.7058823529101.573621894930127.421919597799
Winsorized Mean ( 27 / 28 )12963.956470588295.6126244908933135.588334067987
Winsorized Mean ( 28 / 28 )12965.175294117694.9930714251518136.485483621122
Trimmed Mean ( 1 / 28 )13232.0843373494212.43238029756462.2884530070914
Trimmed Mean ( 2 / 28 )13219.3469135802204.41895526558164.6679115271168
Trimmed Mean ( 3 / 28 )13209.6911392405198.19807707087466.6489369345234
Trimmed Mean ( 4 / 28 )13199.0896103896191.24363730394569.0171437673099
Trimmed Mean ( 5 / 28 )13185.3293333333184.46439786165471.4789926196067
Trimmed Mean ( 6 / 28 )13164.6383561644178.2416404228673.8583774528366
Trimmed Mean ( 7 / 28 )13148.8957746479173.65229736466775.7196764695571
Trimmed Mean ( 8 / 28 )13137.5971014493169.85637869036077.3453266974357
Trimmed Mean ( 9 / 28 )13123.8641791045165.89451652708879.109692434961
Trimmed Mean ( 10 / 28 )13107.0984615385161.6338323259381.0913054088105
Trimmed Mean ( 11 / 28 )13092.2158730159157.47279231193283.1395422714166
Trimmed Mean ( 12 / 28 )13082.8573770492154.88137089943684.4701806361454
Trimmed Mean ( 13 / 28 )13072.7932203390151.96254852266586.0264147148678
Trimmed Mean ( 14 / 28 )13061.5894736842148.63843866627987.8749103588871
Trimmed Mean ( 15 / 28 )13053.0290909091145.81526028669489.5175790602777
Trimmed Mean ( 16 / 28 )13044.7245283019142.63839000810791.4531110983547
Trimmed Mean ( 17 / 28 )13034.2274509804140.04559535053593.0713130845398
Trimmed Mean ( 18 / 28 )13025.2224489796137.46280348040194.754523545249
Trimmed Mean ( 19 / 28 )13018.8042553191135.15372773203696.3258984697115
Trimmed Mean ( 20 / 28 )13010.6844444444132.43259428801598.2438236930458
Trimmed Mean ( 21 / 28 )13002.1372093023128.928277297332100.847831692632
Trimmed Mean ( 22 / 28 )12998.4975609756126.267757432072102.943917159283
Trimmed Mean ( 23 / 28 )12995.6897435897123.365064477485105.343354689865
Trimmed Mean ( 24 / 28 )12991.5540540541120.278498436358108.012273373434
Trimmed Mean ( 25 / 28 )12991.3485714286117.616980236086110.454702589301
Trimmed Mean ( 26 / 28 )12994.8727272727114.980882656107113.017681088244
Trimmed Mean ( 27 / 28 )13000.3741935484111.946703713975116.130031186666
Trimmed Mean ( 28 / 28 )13004.3275862069109.095927293973119.200852944447
Median13012.6
Midrange13957.6
Midmean - Weighted Average at Xnp12967.2785714286
Midmean - Weighted Average at X(n+1)p13002.1372093023
Midmean - Empirical Distribution Function13002.1372093023
Midmean - Empirical Distribution Function - Averaging13002.1372093023
Midmean - Empirical Distribution Function - Interpolation13002.1372093023
Midmean - Closest Observation12971.9090909091
Midmean - True Basic - Statistics Graphics Toolkit13002.1372093023
Midmean - MS Excel (old versions)13002.1372093023
Number of observations85

\begin{tabular}{lllllllll}
\hline
Central Tendency - Ungrouped Data \tabularnewline
Measure & Value & S.E. & Value/S.E. \tabularnewline
Arithmetic Mean & 13249.1552941176 & 223.107961076100 & 59.3845025978184 \tabularnewline
Geometric Mean & 13095.3917123946 &  &  \tabularnewline
Harmonic Mean & 12945.358986721 &  &  \tabularnewline
Quadratic Mean & 13406.0209473382 &  &  \tabularnewline
Winsorized Mean ( 1 / 28 ) & 13244.2223529412 & 219.328494423412 & 60.3853247055685 \tabularnewline
Winsorized Mean ( 2 / 28 ) & 13237.2952941176 & 214.391861949852 & 61.7434597270951 \tabularnewline
Winsorized Mean ( 3 / 28 ) & 13238.5023529412 & 213.691899194721 & 61.9513533401561 \tabularnewline
Winsorized Mean ( 4 / 28 ) & 13247.6552941176 & 209.875176211129 & 63.1215922400983 \tabularnewline
Winsorized Mean ( 5 / 28 ) & 13274.1788235294 & 204.075376584229 & 65.045470187094 \tabularnewline
Winsorized Mean ( 6 / 28 ) & 13243.5364705882 & 194.109504656240 & 68.2271406237525 \tabularnewline
Winsorized Mean ( 7 / 28 ) & 13213.0988235294 & 187.481872061072 & 70.476674242005 \tabularnewline
Winsorized Mean ( 8 / 28 ) & 13224.1952941176 & 184.863845475209 & 71.5347842090143 \tabularnewline
Winsorized Mean ( 9 / 28 ) & 13239.2517647059 & 182.399003815125 & 72.5840135515479 \tabularnewline
Winsorized Mean ( 10 / 28 ) & 13217.4047058824 & 177.806238779060 & 74.3360007873862 \tabularnewline
Winsorized Mean ( 11 / 28 ) & 13166.0929411765 & 165.695075193514 & 79.459772270237 \tabularnewline
Winsorized Mean ( 12 / 28 ) & 13166.6858823529 & 164.161650632063 & 80.2056133796044 \tabularnewline
Winsorized Mean ( 13 / 28 ) & 13170.4635294118 & 162.538537665571 & 81.0297897259938 \tabularnewline
Winsorized Mean ( 14 / 28 ) & 13139.1364705882 & 155.742556398440 & 84.3644587223423 \tabularnewline
Winsorized Mean ( 15 / 28 ) & 13130.7011764706 & 153.719172787966 & 85.4200613906668 \tabularnewline
Winsorized Mean ( 16 / 28 ) & 13145.4964705882 & 145.945754412193 & 90.0711125413183 \tabularnewline
Winsorized Mean ( 17 / 28 ) & 13122.4764705882 & 141.993613978855 & 92.4159622596998 \tabularnewline
Winsorized Mean ( 18 / 28 ) & 13089.1023529412 & 136.576517466157 & 95.8371365427781 \tabularnewline
Winsorized Mean ( 19 / 28 ) & 13100.48 & 134.636690361865 & 97.3024512470537 \tabularnewline
Winsorized Mean ( 20 / 28 ) & 13097.1623529412 & 133.967219672250 & 97.7639334830068 \tabularnewline
Winsorized Mean ( 21 / 28 ) & 13039.0047058824 & 124.809386754945 & 104.471346626225 \tabularnewline
Winsorized Mean ( 22 / 28 ) & 13026.84 & 121.335496112254 & 107.362152192860 \tabularnewline
Winsorized Mean ( 23 / 28 ) & 13037.0952941176 & 117.119053531082 & 111.314896262014 \tabularnewline
Winsorized Mean ( 24 / 28 ) & 12993.5847058824 & 110.166630190723 & 117.944832145520 \tabularnewline
Winsorized Mean ( 25 / 28 ) & 12957.1435294118 & 105.109470684533 & 123.272845396589 \tabularnewline
Winsorized Mean ( 26 / 28 ) & 12942.7058823529 & 101.573621894930 & 127.421919597799 \tabularnewline
Winsorized Mean ( 27 / 28 ) & 12963.9564705882 & 95.6126244908933 & 135.588334067987 \tabularnewline
Winsorized Mean ( 28 / 28 ) & 12965.1752941176 & 94.9930714251518 & 136.485483621122 \tabularnewline
Trimmed Mean ( 1 / 28 ) & 13232.0843373494 & 212.432380297564 & 62.2884530070914 \tabularnewline
Trimmed Mean ( 2 / 28 ) & 13219.3469135802 & 204.418955265581 & 64.6679115271168 \tabularnewline
Trimmed Mean ( 3 / 28 ) & 13209.6911392405 & 198.198077070874 & 66.6489369345234 \tabularnewline
Trimmed Mean ( 4 / 28 ) & 13199.0896103896 & 191.243637303945 & 69.0171437673099 \tabularnewline
Trimmed Mean ( 5 / 28 ) & 13185.3293333333 & 184.464397861654 & 71.4789926196067 \tabularnewline
Trimmed Mean ( 6 / 28 ) & 13164.6383561644 & 178.24164042286 & 73.8583774528366 \tabularnewline
Trimmed Mean ( 7 / 28 ) & 13148.8957746479 & 173.652297364667 & 75.7196764695571 \tabularnewline
Trimmed Mean ( 8 / 28 ) & 13137.5971014493 & 169.856378690360 & 77.3453266974357 \tabularnewline
Trimmed Mean ( 9 / 28 ) & 13123.8641791045 & 165.894516527088 & 79.109692434961 \tabularnewline
Trimmed Mean ( 10 / 28 ) & 13107.0984615385 & 161.63383232593 & 81.0913054088105 \tabularnewline
Trimmed Mean ( 11 / 28 ) & 13092.2158730159 & 157.472792311932 & 83.1395422714166 \tabularnewline
Trimmed Mean ( 12 / 28 ) & 13082.8573770492 & 154.881370899436 & 84.4701806361454 \tabularnewline
Trimmed Mean ( 13 / 28 ) & 13072.7932203390 & 151.962548522665 & 86.0264147148678 \tabularnewline
Trimmed Mean ( 14 / 28 ) & 13061.5894736842 & 148.638438666279 & 87.8749103588871 \tabularnewline
Trimmed Mean ( 15 / 28 ) & 13053.0290909091 & 145.815260286694 & 89.5175790602777 \tabularnewline
Trimmed Mean ( 16 / 28 ) & 13044.7245283019 & 142.638390008107 & 91.4531110983547 \tabularnewline
Trimmed Mean ( 17 / 28 ) & 13034.2274509804 & 140.045595350535 & 93.0713130845398 \tabularnewline
Trimmed Mean ( 18 / 28 ) & 13025.2224489796 & 137.462803480401 & 94.754523545249 \tabularnewline
Trimmed Mean ( 19 / 28 ) & 13018.8042553191 & 135.153727732036 & 96.3258984697115 \tabularnewline
Trimmed Mean ( 20 / 28 ) & 13010.6844444444 & 132.432594288015 & 98.2438236930458 \tabularnewline
Trimmed Mean ( 21 / 28 ) & 13002.1372093023 & 128.928277297332 & 100.847831692632 \tabularnewline
Trimmed Mean ( 22 / 28 ) & 12998.4975609756 & 126.267757432072 & 102.943917159283 \tabularnewline
Trimmed Mean ( 23 / 28 ) & 12995.6897435897 & 123.365064477485 & 105.343354689865 \tabularnewline
Trimmed Mean ( 24 / 28 ) & 12991.5540540541 & 120.278498436358 & 108.012273373434 \tabularnewline
Trimmed Mean ( 25 / 28 ) & 12991.3485714286 & 117.616980236086 & 110.454702589301 \tabularnewline
Trimmed Mean ( 26 / 28 ) & 12994.8727272727 & 114.980882656107 & 113.017681088244 \tabularnewline
Trimmed Mean ( 27 / 28 ) & 13000.3741935484 & 111.946703713975 & 116.130031186666 \tabularnewline
Trimmed Mean ( 28 / 28 ) & 13004.3275862069 & 109.095927293973 & 119.200852944447 \tabularnewline
Median & 13012.6 &  &  \tabularnewline
Midrange & 13957.6 &  &  \tabularnewline
Midmean - Weighted Average at Xnp & 12967.2785714286 &  &  \tabularnewline
Midmean - Weighted Average at X(n+1)p & 13002.1372093023 &  &  \tabularnewline
Midmean - Empirical Distribution Function & 13002.1372093023 &  &  \tabularnewline
Midmean - Empirical Distribution Function - Averaging & 13002.1372093023 &  &  \tabularnewline
Midmean - Empirical Distribution Function - Interpolation & 13002.1372093023 &  &  \tabularnewline
Midmean - Closest Observation & 12971.9090909091 &  &  \tabularnewline
Midmean - True Basic - Statistics Graphics Toolkit & 13002.1372093023 &  &  \tabularnewline
Midmean - MS Excel (old versions) & 13002.1372093023 &  &  \tabularnewline
Number of observations & 85 &  &  \tabularnewline
\hline
\end{tabular}
%Source: https://freestatistics.org/blog/index.php?pk=16558&T=1

[TABLE]
[ROW][C]Central Tendency - Ungrouped Data[/C][/ROW]
[ROW][C]Measure[/C][C]Value[/C][C]S.E.[/C][C]Value/S.E.[/C][/ROW]
[ROW][C]Arithmetic Mean[/C][C]13249.1552941176[/C][C]223.107961076100[/C][C]59.3845025978184[/C][/ROW]
[ROW][C]Geometric Mean[/C][C]13095.3917123946[/C][C][/C][C][/C][/ROW]
[ROW][C]Harmonic Mean[/C][C]12945.358986721[/C][C][/C][C][/C][/ROW]
[ROW][C]Quadratic Mean[/C][C]13406.0209473382[/C][C][/C][C][/C][/ROW]
[ROW][C]Winsorized Mean ( 1 / 28 )[/C][C]13244.2223529412[/C][C]219.328494423412[/C][C]60.3853247055685[/C][/ROW]
[ROW][C]Winsorized Mean ( 2 / 28 )[/C][C]13237.2952941176[/C][C]214.391861949852[/C][C]61.7434597270951[/C][/ROW]
[ROW][C]Winsorized Mean ( 3 / 28 )[/C][C]13238.5023529412[/C][C]213.691899194721[/C][C]61.9513533401561[/C][/ROW]
[ROW][C]Winsorized Mean ( 4 / 28 )[/C][C]13247.6552941176[/C][C]209.875176211129[/C][C]63.1215922400983[/C][/ROW]
[ROW][C]Winsorized Mean ( 5 / 28 )[/C][C]13274.1788235294[/C][C]204.075376584229[/C][C]65.045470187094[/C][/ROW]
[ROW][C]Winsorized Mean ( 6 / 28 )[/C][C]13243.5364705882[/C][C]194.109504656240[/C][C]68.2271406237525[/C][/ROW]
[ROW][C]Winsorized Mean ( 7 / 28 )[/C][C]13213.0988235294[/C][C]187.481872061072[/C][C]70.476674242005[/C][/ROW]
[ROW][C]Winsorized Mean ( 8 / 28 )[/C][C]13224.1952941176[/C][C]184.863845475209[/C][C]71.5347842090143[/C][/ROW]
[ROW][C]Winsorized Mean ( 9 / 28 )[/C][C]13239.2517647059[/C][C]182.399003815125[/C][C]72.5840135515479[/C][/ROW]
[ROW][C]Winsorized Mean ( 10 / 28 )[/C][C]13217.4047058824[/C][C]177.806238779060[/C][C]74.3360007873862[/C][/ROW]
[ROW][C]Winsorized Mean ( 11 / 28 )[/C][C]13166.0929411765[/C][C]165.695075193514[/C][C]79.459772270237[/C][/ROW]
[ROW][C]Winsorized Mean ( 12 / 28 )[/C][C]13166.6858823529[/C][C]164.161650632063[/C][C]80.2056133796044[/C][/ROW]
[ROW][C]Winsorized Mean ( 13 / 28 )[/C][C]13170.4635294118[/C][C]162.538537665571[/C][C]81.0297897259938[/C][/ROW]
[ROW][C]Winsorized Mean ( 14 / 28 )[/C][C]13139.1364705882[/C][C]155.742556398440[/C][C]84.3644587223423[/C][/ROW]
[ROW][C]Winsorized Mean ( 15 / 28 )[/C][C]13130.7011764706[/C][C]153.719172787966[/C][C]85.4200613906668[/C][/ROW]
[ROW][C]Winsorized Mean ( 16 / 28 )[/C][C]13145.4964705882[/C][C]145.945754412193[/C][C]90.0711125413183[/C][/ROW]
[ROW][C]Winsorized Mean ( 17 / 28 )[/C][C]13122.4764705882[/C][C]141.993613978855[/C][C]92.4159622596998[/C][/ROW]
[ROW][C]Winsorized Mean ( 18 / 28 )[/C][C]13089.1023529412[/C][C]136.576517466157[/C][C]95.8371365427781[/C][/ROW]
[ROW][C]Winsorized Mean ( 19 / 28 )[/C][C]13100.48[/C][C]134.636690361865[/C][C]97.3024512470537[/C][/ROW]
[ROW][C]Winsorized Mean ( 20 / 28 )[/C][C]13097.1623529412[/C][C]133.967219672250[/C][C]97.7639334830068[/C][/ROW]
[ROW][C]Winsorized Mean ( 21 / 28 )[/C][C]13039.0047058824[/C][C]124.809386754945[/C][C]104.471346626225[/C][/ROW]
[ROW][C]Winsorized Mean ( 22 / 28 )[/C][C]13026.84[/C][C]121.335496112254[/C][C]107.362152192860[/C][/ROW]
[ROW][C]Winsorized Mean ( 23 / 28 )[/C][C]13037.0952941176[/C][C]117.119053531082[/C][C]111.314896262014[/C][/ROW]
[ROW][C]Winsorized Mean ( 24 / 28 )[/C][C]12993.5847058824[/C][C]110.166630190723[/C][C]117.944832145520[/C][/ROW]
[ROW][C]Winsorized Mean ( 25 / 28 )[/C][C]12957.1435294118[/C][C]105.109470684533[/C][C]123.272845396589[/C][/ROW]
[ROW][C]Winsorized Mean ( 26 / 28 )[/C][C]12942.7058823529[/C][C]101.573621894930[/C][C]127.421919597799[/C][/ROW]
[ROW][C]Winsorized Mean ( 27 / 28 )[/C][C]12963.9564705882[/C][C]95.6126244908933[/C][C]135.588334067987[/C][/ROW]
[ROW][C]Winsorized Mean ( 28 / 28 )[/C][C]12965.1752941176[/C][C]94.9930714251518[/C][C]136.485483621122[/C][/ROW]
[ROW][C]Trimmed Mean ( 1 / 28 )[/C][C]13232.0843373494[/C][C]212.432380297564[/C][C]62.2884530070914[/C][/ROW]
[ROW][C]Trimmed Mean ( 2 / 28 )[/C][C]13219.3469135802[/C][C]204.418955265581[/C][C]64.6679115271168[/C][/ROW]
[ROW][C]Trimmed Mean ( 3 / 28 )[/C][C]13209.6911392405[/C][C]198.198077070874[/C][C]66.6489369345234[/C][/ROW]
[ROW][C]Trimmed Mean ( 4 / 28 )[/C][C]13199.0896103896[/C][C]191.243637303945[/C][C]69.0171437673099[/C][/ROW]
[ROW][C]Trimmed Mean ( 5 / 28 )[/C][C]13185.3293333333[/C][C]184.464397861654[/C][C]71.4789926196067[/C][/ROW]
[ROW][C]Trimmed Mean ( 6 / 28 )[/C][C]13164.6383561644[/C][C]178.24164042286[/C][C]73.8583774528366[/C][/ROW]
[ROW][C]Trimmed Mean ( 7 / 28 )[/C][C]13148.8957746479[/C][C]173.652297364667[/C][C]75.7196764695571[/C][/ROW]
[ROW][C]Trimmed Mean ( 8 / 28 )[/C][C]13137.5971014493[/C][C]169.856378690360[/C][C]77.3453266974357[/C][/ROW]
[ROW][C]Trimmed Mean ( 9 / 28 )[/C][C]13123.8641791045[/C][C]165.894516527088[/C][C]79.109692434961[/C][/ROW]
[ROW][C]Trimmed Mean ( 10 / 28 )[/C][C]13107.0984615385[/C][C]161.63383232593[/C][C]81.0913054088105[/C][/ROW]
[ROW][C]Trimmed Mean ( 11 / 28 )[/C][C]13092.2158730159[/C][C]157.472792311932[/C][C]83.1395422714166[/C][/ROW]
[ROW][C]Trimmed Mean ( 12 / 28 )[/C][C]13082.8573770492[/C][C]154.881370899436[/C][C]84.4701806361454[/C][/ROW]
[ROW][C]Trimmed Mean ( 13 / 28 )[/C][C]13072.7932203390[/C][C]151.962548522665[/C][C]86.0264147148678[/C][/ROW]
[ROW][C]Trimmed Mean ( 14 / 28 )[/C][C]13061.5894736842[/C][C]148.638438666279[/C][C]87.8749103588871[/C][/ROW]
[ROW][C]Trimmed Mean ( 15 / 28 )[/C][C]13053.0290909091[/C][C]145.815260286694[/C][C]89.5175790602777[/C][/ROW]
[ROW][C]Trimmed Mean ( 16 / 28 )[/C][C]13044.7245283019[/C][C]142.638390008107[/C][C]91.4531110983547[/C][/ROW]
[ROW][C]Trimmed Mean ( 17 / 28 )[/C][C]13034.2274509804[/C][C]140.045595350535[/C][C]93.0713130845398[/C][/ROW]
[ROW][C]Trimmed Mean ( 18 / 28 )[/C][C]13025.2224489796[/C][C]137.462803480401[/C][C]94.754523545249[/C][/ROW]
[ROW][C]Trimmed Mean ( 19 / 28 )[/C][C]13018.8042553191[/C][C]135.153727732036[/C][C]96.3258984697115[/C][/ROW]
[ROW][C]Trimmed Mean ( 20 / 28 )[/C][C]13010.6844444444[/C][C]132.432594288015[/C][C]98.2438236930458[/C][/ROW]
[ROW][C]Trimmed Mean ( 21 / 28 )[/C][C]13002.1372093023[/C][C]128.928277297332[/C][C]100.847831692632[/C][/ROW]
[ROW][C]Trimmed Mean ( 22 / 28 )[/C][C]12998.4975609756[/C][C]126.267757432072[/C][C]102.943917159283[/C][/ROW]
[ROW][C]Trimmed Mean ( 23 / 28 )[/C][C]12995.6897435897[/C][C]123.365064477485[/C][C]105.343354689865[/C][/ROW]
[ROW][C]Trimmed Mean ( 24 / 28 )[/C][C]12991.5540540541[/C][C]120.278498436358[/C][C]108.012273373434[/C][/ROW]
[ROW][C]Trimmed Mean ( 25 / 28 )[/C][C]12991.3485714286[/C][C]117.616980236086[/C][C]110.454702589301[/C][/ROW]
[ROW][C]Trimmed Mean ( 26 / 28 )[/C][C]12994.8727272727[/C][C]114.980882656107[/C][C]113.017681088244[/C][/ROW]
[ROW][C]Trimmed Mean ( 27 / 28 )[/C][C]13000.3741935484[/C][C]111.946703713975[/C][C]116.130031186666[/C][/ROW]
[ROW][C]Trimmed Mean ( 28 / 28 )[/C][C]13004.3275862069[/C][C]109.095927293973[/C][C]119.200852944447[/C][/ROW]
[ROW][C]Median[/C][C]13012.6[/C][C][/C][C][/C][/ROW]
[ROW][C]Midrange[/C][C]13957.6[/C][C][/C][C][/C][/ROW]
[ROW][C]Midmean - Weighted Average at Xnp[/C][C]12967.2785714286[/C][C][/C][C][/C][/ROW]
[ROW][C]Midmean - Weighted Average at X(n+1)p[/C][C]13002.1372093023[/C][C][/C][C][/C][/ROW]
[ROW][C]Midmean - Empirical Distribution Function[/C][C]13002.1372093023[/C][C][/C][C][/C][/ROW]
[ROW][C]Midmean - Empirical Distribution Function - Averaging[/C][C]13002.1372093023[/C][C][/C][C][/C][/ROW]
[ROW][C]Midmean - Empirical Distribution Function - Interpolation[/C][C]13002.1372093023[/C][C][/C][C][/C][/ROW]
[ROW][C]Midmean - Closest Observation[/C][C]12971.9090909091[/C][C][/C][C][/C][/ROW]
[ROW][C]Midmean - True Basic - Statistics Graphics Toolkit[/C][C]13002.1372093023[/C][C][/C][C][/C][/ROW]
[ROW][C]Midmean - MS Excel (old versions)[/C][C]13002.1372093023[/C][C][/C][C][/C][/ROW]
[ROW][C]Number of observations[/C][C]85[/C][C][/C][C][/C][/ROW]
[/TABLE]
Source: https://freestatistics.org/blog/index.php?pk=16558&T=1

Globally Unique Identifier (entire table): ba.freestatistics.org/blog/index.php?pk=16558&T=1

As an alternative you can also use a QR Code:  

The GUIDs for individual cells are displayed in the table below:

Central Tendency - Ungrouped Data
MeasureValueS.E.Value/S.E.
Arithmetic Mean13249.1552941176223.10796107610059.3845025978184
Geometric Mean13095.3917123946
Harmonic Mean12945.358986721
Quadratic Mean13406.0209473382
Winsorized Mean ( 1 / 28 )13244.2223529412219.32849442341260.3853247055685
Winsorized Mean ( 2 / 28 )13237.2952941176214.39186194985261.7434597270951
Winsorized Mean ( 3 / 28 )13238.5023529412213.69189919472161.9513533401561
Winsorized Mean ( 4 / 28 )13247.6552941176209.87517621112963.1215922400983
Winsorized Mean ( 5 / 28 )13274.1788235294204.07537658422965.045470187094
Winsorized Mean ( 6 / 28 )13243.5364705882194.10950465624068.2271406237525
Winsorized Mean ( 7 / 28 )13213.0988235294187.48187206107270.476674242005
Winsorized Mean ( 8 / 28 )13224.1952941176184.86384547520971.5347842090143
Winsorized Mean ( 9 / 28 )13239.2517647059182.39900381512572.5840135515479
Winsorized Mean ( 10 / 28 )13217.4047058824177.80623877906074.3360007873862
Winsorized Mean ( 11 / 28 )13166.0929411765165.69507519351479.459772270237
Winsorized Mean ( 12 / 28 )13166.6858823529164.16165063206380.2056133796044
Winsorized Mean ( 13 / 28 )13170.4635294118162.53853766557181.0297897259938
Winsorized Mean ( 14 / 28 )13139.1364705882155.74255639844084.3644587223423
Winsorized Mean ( 15 / 28 )13130.7011764706153.71917278796685.4200613906668
Winsorized Mean ( 16 / 28 )13145.4964705882145.94575441219390.0711125413183
Winsorized Mean ( 17 / 28 )13122.4764705882141.99361397885592.4159622596998
Winsorized Mean ( 18 / 28 )13089.1023529412136.57651746615795.8371365427781
Winsorized Mean ( 19 / 28 )13100.48134.63669036186597.3024512470537
Winsorized Mean ( 20 / 28 )13097.1623529412133.96721967225097.7639334830068
Winsorized Mean ( 21 / 28 )13039.0047058824124.809386754945104.471346626225
Winsorized Mean ( 22 / 28 )13026.84121.335496112254107.362152192860
Winsorized Mean ( 23 / 28 )13037.0952941176117.119053531082111.314896262014
Winsorized Mean ( 24 / 28 )12993.5847058824110.166630190723117.944832145520
Winsorized Mean ( 25 / 28 )12957.1435294118105.109470684533123.272845396589
Winsorized Mean ( 26 / 28 )12942.7058823529101.573621894930127.421919597799
Winsorized Mean ( 27 / 28 )12963.956470588295.6126244908933135.588334067987
Winsorized Mean ( 28 / 28 )12965.175294117694.9930714251518136.485483621122
Trimmed Mean ( 1 / 28 )13232.0843373494212.43238029756462.2884530070914
Trimmed Mean ( 2 / 28 )13219.3469135802204.41895526558164.6679115271168
Trimmed Mean ( 3 / 28 )13209.6911392405198.19807707087466.6489369345234
Trimmed Mean ( 4 / 28 )13199.0896103896191.24363730394569.0171437673099
Trimmed Mean ( 5 / 28 )13185.3293333333184.46439786165471.4789926196067
Trimmed Mean ( 6 / 28 )13164.6383561644178.2416404228673.8583774528366
Trimmed Mean ( 7 / 28 )13148.8957746479173.65229736466775.7196764695571
Trimmed Mean ( 8 / 28 )13137.5971014493169.85637869036077.3453266974357
Trimmed Mean ( 9 / 28 )13123.8641791045165.89451652708879.109692434961
Trimmed Mean ( 10 / 28 )13107.0984615385161.6338323259381.0913054088105
Trimmed Mean ( 11 / 28 )13092.2158730159157.47279231193283.1395422714166
Trimmed Mean ( 12 / 28 )13082.8573770492154.88137089943684.4701806361454
Trimmed Mean ( 13 / 28 )13072.7932203390151.96254852266586.0264147148678
Trimmed Mean ( 14 / 28 )13061.5894736842148.63843866627987.8749103588871
Trimmed Mean ( 15 / 28 )13053.0290909091145.81526028669489.5175790602777
Trimmed Mean ( 16 / 28 )13044.7245283019142.63839000810791.4531110983547
Trimmed Mean ( 17 / 28 )13034.2274509804140.04559535053593.0713130845398
Trimmed Mean ( 18 / 28 )13025.2224489796137.46280348040194.754523545249
Trimmed Mean ( 19 / 28 )13018.8042553191135.15372773203696.3258984697115
Trimmed Mean ( 20 / 28 )13010.6844444444132.43259428801598.2438236930458
Trimmed Mean ( 21 / 28 )13002.1372093023128.928277297332100.847831692632
Trimmed Mean ( 22 / 28 )12998.4975609756126.267757432072102.943917159283
Trimmed Mean ( 23 / 28 )12995.6897435897123.365064477485105.343354689865
Trimmed Mean ( 24 / 28 )12991.5540540541120.278498436358108.012273373434
Trimmed Mean ( 25 / 28 )12991.3485714286117.616980236086110.454702589301
Trimmed Mean ( 26 / 28 )12994.8727272727114.980882656107113.017681088244
Trimmed Mean ( 27 / 28 )13000.3741935484111.946703713975116.130031186666
Trimmed Mean ( 28 / 28 )13004.3275862069109.095927293973119.200852944447
Median13012.6
Midrange13957.6
Midmean - Weighted Average at Xnp12967.2785714286
Midmean - Weighted Average at X(n+1)p13002.1372093023
Midmean - Empirical Distribution Function13002.1372093023
Midmean - Empirical Distribution Function - Averaging13002.1372093023
Midmean - Empirical Distribution Function - Interpolation13002.1372093023
Midmean - Closest Observation12971.9090909091
Midmean - True Basic - Statistics Graphics Toolkit13002.1372093023
Midmean - MS Excel (old versions)13002.1372093023
Number of observations85


Parameters (Session):
Parameters (R input):
R code (references can be found in the software module):
geomean <- function(x) {
return(exp(mean(log(x))))
}
harmean <- function(x) {
return(1/mean(1/x))
}
quamean <- function(x) {
return(sqrt(mean(x*x)))
}
winmean <- function(x) {
x <-sort(x[!is.na(x)])
n<-length(x)
denom <- 3
nodenom <- n/denom
if (nodenom>40) denom <- n/40
sqrtn = sqrt(n)
roundnodenom = floor(nodenom)
win <- array(NA,dim=c(roundnodenom,2))
for (j in 1:roundnodenom) {
win[j,1] <- (j*x[j+1]+sum(x[(j+1):(n-j)])+j*x[n-j])/n
win[j,2] <- sd(c(rep(x[j+1],j),x[(j+1):(n-j)],rep(x[n-j],j)))/sqrtn
}
return(win)
}
trimean <- function(x) {
x <-sort(x[!is.na(x)])
n<-length(x)
denom <- 3
nodenom <- n/denom
if (nodenom>40) denom <- n/40
sqrtn = sqrt(n)
roundnodenom = floor(nodenom)
tri <- array(NA,dim=c(roundnodenom,2))
for (j in 1:roundnodenom) {
tri[j,1] <- mean(x,trim=j/n)
tri[j,2] <- sd(x[(j+1):(n-j)]) / sqrt(n-j*2)
}
return(tri)
}
midrange <- function(x) {
return((max(x)+min(x))/2)
}
q1 <- function(data,n,p,i,f) {
np <- n*p;
i <<- floor(np)
f <<- np - i
qvalue <- (1-f)*data[i] + f*data[i+1]
}
q2 <- function(data,n,p,i,f) {
np <- (n+1)*p
i <<- floor(np)
f <<- np - i
qvalue <- (1-f)*data[i] + f*data[i+1]
}
q3 <- function(data,n,p,i,f) {
np <- n*p
i <<- floor(np)
f <<- np - i
if (f==0) {
qvalue <- data[i]
} else {
qvalue <- data[i+1]
}
}
q4 <- function(data,n,p,i,f) {
np <- n*p
i <<- floor(np)
f <<- np - i
if (f==0) {
qvalue <- (data[i]+data[i+1])/2
} else {
qvalue <- data[i+1]
}
}
q5 <- function(data,n,p,i,f) {
np <- (n-1)*p
i <<- floor(np)
f <<- np - i
if (f==0) {
qvalue <- data[i+1]
} else {
qvalue <- data[i+1] + f*(data[i+2]-data[i+1])
}
}
q6 <- function(data,n,p,i,f) {
np <- n*p+0.5
i <<- floor(np)
f <<- np - i
qvalue <- data[i]
}
q7 <- function(data,n,p,i,f) {
np <- (n+1)*p
i <<- floor(np)
f <<- np - i
if (f==0) {
qvalue <- data[i]
} else {
qvalue <- f*data[i] + (1-f)*data[i+1]
}
}
q8 <- function(data,n,p,i,f) {
np <- (n+1)*p
i <<- floor(np)
f <<- np - i
if (f==0) {
qvalue <- data[i]
} else {
if (f == 0.5) {
qvalue <- (data[i]+data[i+1])/2
} else {
if (f < 0.5) {
qvalue <- data[i]
} else {
qvalue <- data[i+1]
}
}
}
}
midmean <- function(x,def) {
x <-sort(x[!is.na(x)])
n<-length(x)
if (def==1) {
qvalue1 <- q1(x,n,0.25,i,f)
qvalue3 <- q1(x,n,0.75,i,f)
}
if (def==2) {
qvalue1 <- q2(x,n,0.25,i,f)
qvalue3 <- q2(x,n,0.75,i,f)
}
if (def==3) {
qvalue1 <- q3(x,n,0.25,i,f)
qvalue3 <- q3(x,n,0.75,i,f)
}
if (def==4) {
qvalue1 <- q4(x,n,0.25,i,f)
qvalue3 <- q4(x,n,0.75,i,f)
}
if (def==5) {
qvalue1 <- q5(x,n,0.25,i,f)
qvalue3 <- q5(x,n,0.75,i,f)
}
if (def==6) {
qvalue1 <- q6(x,n,0.25,i,f)
qvalue3 <- q6(x,n,0.75,i,f)
}
if (def==7) {
qvalue1 <- q7(x,n,0.25,i,f)
qvalue3 <- q7(x,n,0.75,i,f)
}
if (def==8) {
qvalue1 <- q8(x,n,0.25,i,f)
qvalue3 <- q8(x,n,0.75,i,f)
}
midm <- 0
myn <- 0
roundno4 <- round(n/4)
round3no4 <- round(3*n/4)
for (i in 1:n) {
if ((x[i]>=qvalue1) & (x[i]<=qvalue3)){
midm = midm + x[i]
myn = myn + 1
}
}
midm = midm / myn
return(midm)
}
(arm <- mean(x))
sqrtn <- sqrt(length(x))
(armse <- sd(x) / sqrtn)
(armose <- arm / armse)
(geo <- geomean(x))
(har <- harmean(x))
(qua <- quamean(x))
(win <- winmean(x))
(tri <- trimean(x))
(midr <- midrange(x))
midm <- array(NA,dim=8)
for (j in 1:8) midm[j] <- midmean(x,j)
midm
bitmap(file='test1.png')
lb <- win[,1] - 2*win[,2]
ub <- win[,1] + 2*win[,2]
if ((ylimmin == '') | (ylimmax == '')) plot(win[,1],type='b',main=main, xlab='j', pch=19, ylab='Winsorized Mean(j/n)', ylim=c(min(lb),max(ub))) else plot(win[,1],type='l',main=main, xlab='j', pch=19, ylab='Winsorized Mean(j/n)', ylim=c(ylimmin,ylimmax))
lines(ub,lty=3)
lines(lb,lty=3)
grid()
dev.off()
bitmap(file='test2.png')
lb <- tri[,1] - 2*tri[,2]
ub <- tri[,1] + 2*tri[,2]
if ((ylimmin == '') | (ylimmax == '')) plot(tri[,1],type='b',main=main, xlab='j', pch=19, ylab='Trimmed Mean(j/n)', ylim=c(min(lb),max(ub))) else plot(tri[,1],type='l',main=main, xlab='j', pch=19, ylab='Trimmed Mean(j/n)', ylim=c(ylimmin,ylimmax))
lines(ub,lty=3)
lines(lb,lty=3)
grid()
dev.off()
load(file='createtable')
a<-table.start()
a<-table.row.start(a)
a<-table.element(a,'Central Tendency - Ungrouped Data',4,TRUE)
a<-table.row.end(a)
a<-table.row.start(a)
a<-table.element(a,'Measure',header=TRUE)
a<-table.element(a,'Value',header=TRUE)
a<-table.element(a,'S.E.',header=TRUE)
a<-table.element(a,'Value/S.E.',header=TRUE)
a<-table.row.end(a)
a<-table.row.start(a)
a<-table.element(a,hyperlink('arithmetic_mean.htm', 'Arithmetic Mean', 'click to view the definition of the Arithmetic Mean'),header=TRUE)
a<-table.element(a,arm)
a<-table.element(a,hyperlink('arithmetic_mean_standard_error.htm', armse, 'click to view the definition of the Standard Error of the Arithmetic Mean'))
a<-table.element(a,armose)
a<-table.row.end(a)
a<-table.row.start(a)
a<-table.element(a,hyperlink('geometric_mean.htm', 'Geometric Mean', 'click to view the definition of the Geometric Mean'),header=TRUE)
a<-table.element(a,geo)
a<-table.element(a,'')
a<-table.row.end(a)
a<-table.row.start(a)
a<-table.element(a,hyperlink('harmonic_mean.htm', 'Harmonic Mean', 'click to view the definition of the Harmonic Mean'),header=TRUE)
a<-table.element(a,har)
a<-table.element(a,'')
a<-table.row.end(a)
a<-table.row.start(a)
a<-table.element(a,hyperlink('quadratic_mean.htm', 'Quadratic Mean', 'click to view the definition of the Quadratic Mean'),header=TRUE)
a<-table.element(a,qua)
a<-table.element(a,'')
a<-table.row.end(a)
for (j in 1:length(win[,1])) {
a<-table.row.start(a)
mylabel <- paste('Winsorized Mean (',j)
mylabel <- paste(mylabel,'/')
mylabel <- paste(mylabel,length(win[,1]))
mylabel <- paste(mylabel,')')
a<-table.element(a,hyperlink('winsorized_mean.htm', mylabel, 'click to view the definition of the Winsorized Mean'),header=TRUE)
a<-table.element(a,win[j,1])
a<-table.element(a,win[j,2])
a<-table.element(a,win[j,1]/win[j,2])
a<-table.row.end(a)
}
for (j in 1:length(tri[,1])) {
a<-table.row.start(a)
mylabel <- paste('Trimmed Mean (',j)
mylabel <- paste(mylabel,'/')
mylabel <- paste(mylabel,length(tri[,1]))
mylabel <- paste(mylabel,')')
a<-table.element(a,hyperlink('arithmetic_mean.htm', mylabel, 'click to view the definition of the Trimmed Mean'),header=TRUE)
a<-table.element(a,tri[j,1])
a<-table.element(a,tri[j,2])
a<-table.element(a,tri[j,1]/tri[j,2])
a<-table.row.end(a)
}
a<-table.row.start(a)
a<-table.element(a,hyperlink('median_1.htm', 'Median', 'click to view the definition of the Median'),header=TRUE)
a<-table.element(a,median(x))
a<-table.element(a,'')
a<-table.row.end(a)
a<-table.row.start(a)
a<-table.element(a,hyperlink('midrange.htm', 'Midrange', 'click to view the definition of the Midrange'),header=TRUE)
a<-table.element(a,midr)
a<-table.element(a,'')
a<-table.row.end(a)
a<-table.row.start(a)
mymid <- hyperlink('midmean.htm', 'Midmean', 'click to view the definition of the Midmean')
mylabel <- paste(mymid,hyperlink('method_1.htm','Weighted Average at Xnp',''),sep=' - ')
a<-table.element(a,mylabel,header=TRUE)
a<-table.element(a,midm[1])
a<-table.element(a,'')
a<-table.row.end(a)
a<-table.row.start(a)
mymid <- hyperlink('midmean.htm', 'Midmean', 'click to view the definition of the Midmean')
mylabel <- paste(mymid,hyperlink('method_2.htm','Weighted Average at X(n+1)p',''),sep=' - ')
a<-table.element(a,mylabel,header=TRUE)
a<-table.element(a,midm[2])
a<-table.element(a,'')
a<-table.row.end(a)
a<-table.row.start(a)
mymid <- hyperlink('midmean.htm', 'Midmean', 'click to view the definition of the Midmean')
mylabel <- paste(mymid,hyperlink('method_3.htm','Empirical Distribution Function',''),sep=' - ')
a<-table.element(a,mylabel,header=TRUE)
a<-table.element(a,midm[3])
a<-table.element(a,'')
a<-table.row.end(a)
a<-table.row.start(a)
mymid <- hyperlink('midmean.htm', 'Midmean', 'click to view the definition of the Midmean')
mylabel <- paste(mymid,hyperlink('method_4.htm','Empirical Distribution Function - Averaging',''),sep=' - ')
a<-table.element(a,mylabel,header=TRUE)
a<-table.element(a,midm[4])
a<-table.element(a,'')
a<-table.row.end(a)
a<-table.row.start(a)
mymid <- hyperlink('midmean.htm', 'Midmean', 'click to view the definition of the Midmean')
mylabel <- paste(mymid,hyperlink('method_5.htm','Empirical Distribution Function - Interpolation',''),sep=' - ')
a<-table.element(a,mylabel,header=TRUE)
a<-table.element(a,midm[5])
a<-table.element(a,'')
a<-table.row.end(a)
a<-table.row.start(a)
mymid <- hyperlink('midmean.htm', 'Midmean', 'click to view the definition of the Midmean')
mylabel <- paste(mymid,hyperlink('method_6.htm','Closest Observation',''),sep=' - ')
a<-table.element(a,mylabel,header=TRUE)
a<-table.element(a,midm[6])
a<-table.element(a,'')
a<-table.row.end(a)
a<-table.row.start(a)
mymid <- hyperlink('midmean.htm', 'Midmean', 'click to view the definition of the Midmean')
mylabel <- paste(mymid,hyperlink('method_7.htm','True Basic - Statistics Graphics Toolkit',''),sep=' - ')
a<-table.element(a,mylabel,header=TRUE)
a<-table.element(a,midm[7])
a<-table.element(a,'')
a<-table.row.end(a)
a<-table.row.start(a)
mymid <- hyperlink('midmean.htm', 'Midmean', 'click to view the definition of the Midmean')
mylabel <- paste(mymid,hyperlink('method_8.htm','MS Excel (old versions)',''),sep=' - ')
a<-table.element(a,mylabel,header=TRUE)
a<-table.element(a,midm[8])
a<-table.element(a,'')
a<-table.row.end(a)
a<-table.row.start(a)
a<-table.element(a,'Number of observations',header=TRUE)
a<-table.element(a,length(x))
a<-table.element(a,'')
a<-table.row.end(a)
a<-table.end(a)
table.save(a,file='mytable.tab')