Free Statistics
of Irreproducible Research!
Description of Statistical Computation | |||||||||||||||||||||||||||||||||||||||||
|---|---|---|---|---|---|---|---|---|---|---|---|---|---|---|---|---|---|---|---|---|---|---|---|---|---|---|---|---|---|---|---|---|---|---|---|---|---|---|---|---|---|
| Author's title | |||||||||||||||||||||||||||||||||||||||||
| Author | *The author of this computation has been verified* | ||||||||||||||||||||||||||||||||||||||||
| R Software Module | rwasp_univariatedataseries.wasp | ||||||||||||||||||||||||||||||||||||||||
| Title produced by software | Univariate Data Series | ||||||||||||||||||||||||||||||||||||||||
| Date of computation | Fri, 17 Oct 2008 04:32:53 -0600 | ||||||||||||||||||||||||||||||||||||||||
| Cite this page as follows | Statistical Computations at FreeStatistics.org, Office for Research Development and Education, URL https://freestatistics.org/blog/index.php?v=date/2008/Oct/17/t1224239836vcspkrku62gatpx.htm/, Retrieved Sun, 19 May 2024 15:40:37 +0000 | ||||||||||||||||||||||||||||||||||||||||
| Statistical Computations at FreeStatistics.org, Office for Research Development and Education, URL https://freestatistics.org/blog/index.php?pk=16414, Retrieved Sun, 19 May 2024 15:40:37 +0000 | |||||||||||||||||||||||||||||||||||||||||
| QR Codes: | |||||||||||||||||||||||||||||||||||||||||
|
| |||||||||||||||||||||||||||||||||||||||||
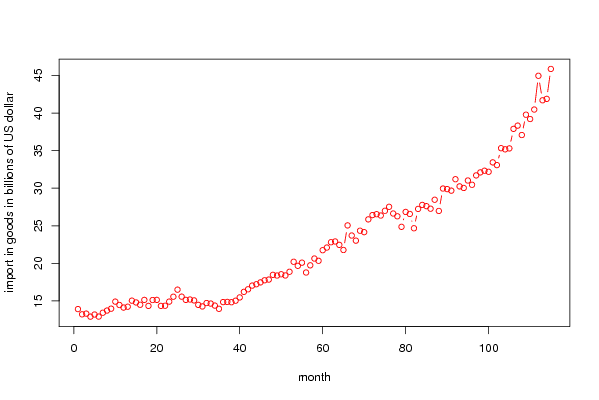
| Original text written by user: | Import in goods in billions of US dollars | ||||||||||||||||||||||||||||||||||||||||
| IsPrivate? | No (this computation is public) | ||||||||||||||||||||||||||||||||||||||||
| User-defined keywords | |||||||||||||||||||||||||||||||||||||||||
| Estimated Impact | 194 | ||||||||||||||||||||||||||||||||||||||||
Tree of Dependent Computations | |||||||||||||||||||||||||||||||||||||||||
| Family? (F = Feedback message, R = changed R code, M = changed R Module, P = changed Parameters, D = changed Data) | |||||||||||||||||||||||||||||||||||||||||
| - [Univariate Data Series] [Import in goods] [2008-10-17 10:32:53] [787873b6436f665b5b192a0bdb2e43c9] [Current] - RMPD [Pearson Correlation] [Relationship Impo...] [2008-10-20 15:38:08] [cb714085b233acee8e8acd879ea442b6] - RMPD [Pearson Correlation] [Relatie import - ...] [2008-10-20 15:51:38] [cb714085b233acee8e8acd879ea442b6] - RMPD [Pearson Correlation] [Relatie export - ...] [2008-10-20 16:11:28] [cb714085b233acee8e8acd879ea442b6] - RMPD [Pearson Correlation] [relatie inflatie ...] [2008-10-20 16:17:22] [cb714085b233acee8e8acd879ea442b6] - RMPD [Pearson Correlation] [Relatie inflatie ...] [2008-10-20 16:22:42] [cb714085b233acee8e8acd879ea442b6] - RMPD [Pearson Correlation] [Relatie inflatie ...] [2008-10-20 16:22:42] [cb714085b233acee8e8acd879ea442b6] - D [Pearson Correlation] [Relatie inflatie ...] [2008-10-20 16:34:25] [cb714085b233acee8e8acd879ea442b6] - RMPD [Back to Back Histogram] [back to back hist...] [2008-10-20 17:08:38] [cb714085b233acee8e8acd879ea442b6] - RMPD [Back to Back Histogram] [back to back hist...] [2008-10-20 17:16:15] [cb714085b233acee8e8acd879ea442b6] - RMPD [Back to Back Histogram] [back to back hist...] [2008-10-20 17:20:31] [cb714085b233acee8e8acd879ea442b6] - RM D [Central Tendency] [Export van belgi�] [2008-10-20 17:25:51] [cb714085b233acee8e8acd879ea442b6] | |||||||||||||||||||||||||||||||||||||||||
| Feedback Forum | |||||||||||||||||||||||||||||||||||||||||
Post a new message | |||||||||||||||||||||||||||||||||||||||||
Dataset | |||||||||||||||||||||||||||||||||||||||||
| Dataseries X: | |||||||||||||||||||||||||||||||||||||||||
13.92 13.22 13.31 12.91 13.19 12.92 13.43 13.72 13.97 14.91 14.46 14.12 14.23 15.04 14.80 14.49 15.14 14.34 15.12 15.14 14.34 14.36 14.91 15.56 16.50 15.57 15.14 15.19 15.07 14.48 14.27 14.72 14.65 14.38 13.95 14.85 14.87 14.83 15.03 15.47 16.21 16.55 17.04 17.22 17.47 17.75 17.84 18.47 18.38 18.55 18.39 18.88 20.21 19.67 20.09 18.78 19.74 20.64 20.34 21.75 22.10 22.81 22.91 22.46 21.78 25.05 23.70 23.02 24.34 24.15 25.85 26.42 26.54 26.36 26.99 27.52 26.63 26.26 24.86 26.84 26.57 24.67 27.24 27.77 27.61 27.27 28.46 26.97 29.95 29.88 29.67 31.19 30.24 30.03 31.02 30.45 31.70 32.10 32.32 32.18 33.43 33.07 35.32 35.17 35.29 37.89 38.32 37.07 39.77 39.20 40.46 44.95 41.69 41.88 45.86 | |||||||||||||||||||||||||||||||||||||||||
Tables (Output of Computation) | |||||||||||||||||||||||||||||||||||||||||
| |||||||||||||||||||||||||||||||||||||||||
Figures (Output of Computation) | |||||||||||||||||||||||||||||||||||||||||
Input Parameters & R Code | |||||||||||||||||||||||||||||||||||||||||
| Parameters (Session): | |||||||||||||||||||||||||||||||||||||||||
| par1 = Import in Belgi� ; par2 = http://stats.oecd.org/wbos/Index.aspx?datasetcode=MEI_TRD ; | |||||||||||||||||||||||||||||||||||||||||
| Parameters (R input): | |||||||||||||||||||||||||||||||||||||||||
| par1 = Import in Belgi� ; par2 = http://stats.oecd.org/wbos/Index.aspx?datasetcode=MEI_TRD ; par3 = ; | |||||||||||||||||||||||||||||||||||||||||
| R code (references can be found in the software module): | |||||||||||||||||||||||||||||||||||||||||
bitmap(file='test1.png') | |||||||||||||||||||||||||||||||||||||||||