Free Statistics
of Irreproducible Research!
Description of Statistical Computation | |||||||||||||||||||||||||||||||||||||||||
|---|---|---|---|---|---|---|---|---|---|---|---|---|---|---|---|---|---|---|---|---|---|---|---|---|---|---|---|---|---|---|---|---|---|---|---|---|---|---|---|---|---|
| Author's title | |||||||||||||||||||||||||||||||||||||||||
| Author | *Unverified author* | ||||||||||||||||||||||||||||||||||||||||
| R Software Module | rwasp_univariatedataseries.wasp | ||||||||||||||||||||||||||||||||||||||||
| Title produced by software | Univariate Data Series | ||||||||||||||||||||||||||||||||||||||||
| Date of computation | Thu, 16 Oct 2008 07:07:09 -0600 | ||||||||||||||||||||||||||||||||||||||||
| Cite this page as follows | Statistical Computations at FreeStatistics.org, Office for Research Development and Education, URL https://freestatistics.org/blog/index.php?v=date/2008/Oct/16/t1224163471607zsddmchpjfw8.htm/, Retrieved Sun, 19 May 2024 14:36:02 +0000 | ||||||||||||||||||||||||||||||||||||||||
| Statistical Computations at FreeStatistics.org, Office for Research Development and Education, URL https://freestatistics.org/blog/index.php?pk=16340, Retrieved Sun, 19 May 2024 14:36:02 +0000 | |||||||||||||||||||||||||||||||||||||||||
| QR Codes: | |||||||||||||||||||||||||||||||||||||||||
|
| |||||||||||||||||||||||||||||||||||||||||
| Original text written by user: | |||||||||||||||||||||||||||||||||||||||||
| IsPrivate? | No (this computation is public) | ||||||||||||||||||||||||||||||||||||||||
| User-defined keywords | |||||||||||||||||||||||||||||||||||||||||
| Estimated Impact | 181 | ||||||||||||||||||||||||||||||||||||||||
Tree of Dependent Computations | |||||||||||||||||||||||||||||||||||||||||
| Family? (F = Feedback message, R = changed R code, M = changed R Module, P = changed Parameters, D = changed Data) | |||||||||||||||||||||||||||||||||||||||||
| - [Univariate Data Series] [] [2008-10-16 13:07:09] [c0a347e3519123f7eef62b705326dad9] [Current] - PD [Univariate Data Series] [] [2008-10-16 13:42:01] [7c33e759a6f7358dc2f6505c3a7a1eae] - PD [Univariate Data Series] [] [2008-10-16 13:47:11] [7c33e759a6f7358dc2f6505c3a7a1eae] | |||||||||||||||||||||||||||||||||||||||||
| Feedback Forum | |||||||||||||||||||||||||||||||||||||||||
Post a new message | |||||||||||||||||||||||||||||||||||||||||
Dataset | |||||||||||||||||||||||||||||||||||||||||
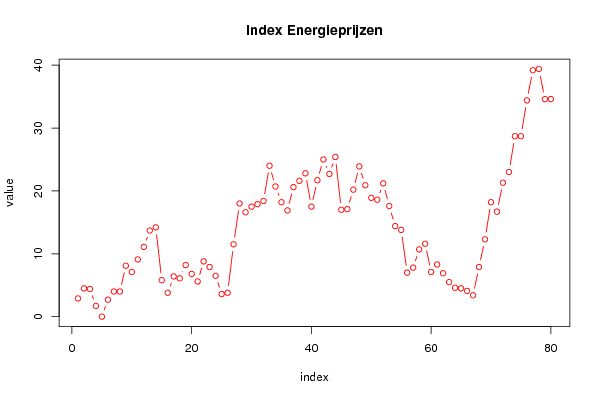
| Dataseries X: | |||||||||||||||||||||||||||||||||||||||||
2.9 4.5 4.4 1.7 0 2.7 4 4 8.1 7.1 9.1 11.1 13.7 14.2 5.8 3.8 6.4 6.1 8.2 6.8 5.6 8.8 7.9 6.5 3.6 3.8 11.5 18 16.6 17.5 17.9 18.4 24 20.7 18.2 16.9 20.6 21.6 22.8 17.5 21.7 25 22.7 25.4 17 17.1 20.2 23.9 20.9 18.9 18.6 21.2 17.6 14.4 13.8 7 7.8 10.7 11.6 7.1 8.3 6.9 5.5 4.6 4.5 4.1 3.4 7.9 12.3 18.2 16.7 21.3 23 28.7 28.7 34.4 39.2 39.4 34.6 34.6 | |||||||||||||||||||||||||||||||||||||||||
Tables (Output of Computation) | |||||||||||||||||||||||||||||||||||||||||
| |||||||||||||||||||||||||||||||||||||||||
Figures (Output of Computation) | |||||||||||||||||||||||||||||||||||||||||
Input Parameters & R Code | |||||||||||||||||||||||||||||||||||||||||
| Parameters (Session): | |||||||||||||||||||||||||||||||||||||||||
| par2 = http://www.nbb.be/belgostat/PublicatieSelectieLinker?LinkID=607000039|910000082&Lang=N ; | |||||||||||||||||||||||||||||||||||||||||
| Parameters (R input): | |||||||||||||||||||||||||||||||||||||||||
| par1 = ; par2 = http://www.nbb.be/belgostat/PublicatieSelectieLinker?LinkID=607000039|910000082&Lang=N ; par3 = ; | |||||||||||||||||||||||||||||||||||||||||
| R code (references can be found in the software module): | |||||||||||||||||||||||||||||||||||||||||
bitmap(file='test1.png') | |||||||||||||||||||||||||||||||||||||||||