Free Statistics
of Irreproducible Research!
Description of Statistical Computation | |||||||||||||||||||||||||||||||||||||||||
|---|---|---|---|---|---|---|---|---|---|---|---|---|---|---|---|---|---|---|---|---|---|---|---|---|---|---|---|---|---|---|---|---|---|---|---|---|---|---|---|---|---|
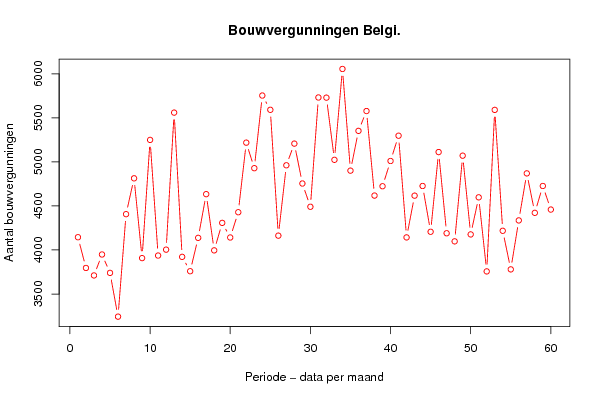
| Author's title | Bouwvergunningen volgens effectieve datum van toekenning - woongebouwen - B... | ||||||||||||||||||||||||||||||||||||||||
| Author | *The author of this computation has been verified* | ||||||||||||||||||||||||||||||||||||||||
| R Software Module | rwasp_univariatedataseries.wasp | ||||||||||||||||||||||||||||||||||||||||
| Title produced by software | Univariate Data Series | ||||||||||||||||||||||||||||||||||||||||
| Date of computation | Wed, 15 Oct 2008 08:38:51 -0600 | ||||||||||||||||||||||||||||||||||||||||
| Cite this page as follows | Statistical Computations at FreeStatistics.org, Office for Research Development and Education, URL https://freestatistics.org/blog/index.php?v=date/2008/Oct/15/t1224081580x24pn9wo5oiz6h3.htm/, Retrieved Sun, 19 May 2024 16:30:10 +0000 | ||||||||||||||||||||||||||||||||||||||||
| Statistical Computations at FreeStatistics.org, Office for Research Development and Education, URL https://freestatistics.org/blog/index.php?pk=16291, Retrieved Sun, 19 May 2024 16:30:10 +0000 | |||||||||||||||||||||||||||||||||||||||||
| QR Codes: | |||||||||||||||||||||||||||||||||||||||||
|
| |||||||||||||||||||||||||||||||||||||||||
| Original text written by user: | |||||||||||||||||||||||||||||||||||||||||
| IsPrivate? | No (this computation is public) | ||||||||||||||||||||||||||||||||||||||||
| User-defined keywords | |||||||||||||||||||||||||||||||||||||||||
| Estimated Impact | 234 | ||||||||||||||||||||||||||||||||||||||||
Tree of Dependent Computations | |||||||||||||||||||||||||||||||||||||||||
| Family? (F = Feedback message, R = changed R code, M = changed R Module, P = changed Parameters, D = changed Data) | |||||||||||||||||||||||||||||||||||||||||
| F [Univariate Data Series] [Indicator van het...] [2008-10-13 07:49:48] [fdafc09d93b3f1f7b53d2097951a84d1] - PD [Univariate Data Series] [Bouwvergunningen ...] [2008-10-15 14:38:51] [b23db733701c4d62df5e228d507c1c6a] [Current] | |||||||||||||||||||||||||||||||||||||||||
| Feedback Forum | |||||||||||||||||||||||||||||||||||||||||
Post a new message | |||||||||||||||||||||||||||||||||||||||||
Dataset | |||||||||||||||||||||||||||||||||||||||||
| Dataseries X: | |||||||||||||||||||||||||||||||||||||||||
4145 3796 3711 3949 3740 3243 4407 4814 3908 5250 3937 4004 5560 3922 3759 4138 4634 3996 4308 4142 4429 5219 4929 5754 5592 4163 4962 5208 4755 4491 5732 5730 5024 6056 4901 5353 5578 4618 4724 5011 5298 4143 4617 4727 4207 5112 4190 4098 5071 4177 4598 3757 5591 4218 3780 4336 4870 4422 4727 4459 | |||||||||||||||||||||||||||||||||||||||||
Tables (Output of Computation) | |||||||||||||||||||||||||||||||||||||||||
| |||||||||||||||||||||||||||||||||||||||||
Figures (Output of Computation) | |||||||||||||||||||||||||||||||||||||||||
Input Parameters & R Code | |||||||||||||||||||||||||||||||||||||||||
| Parameters (Session): | |||||||||||||||||||||||||||||||||||||||||
| par1 = Bouwvergunningen volgens de effectieve datum van toekenning - woongebouwen - Belgi� ; par2 = http://www.nbb.be/belgostat/PublicatieSelectieLinker?LinkID=321000001|910000082&Lang=N ; par3 = Bouwvergunningen volgens de effectieve datum van toekenning - woongebouwen - Belgi� - Periode 2003-06 tem 2008-05 ; | |||||||||||||||||||||||||||||||||||||||||
| Parameters (R input): | |||||||||||||||||||||||||||||||||||||||||
| par1 = Bouwvergunningen volgens de effectieve datum van toekenning - woongebouwen - Belgi� ; par2 = http://www.nbb.be/belgostat/PublicatieSelectieLinker?LinkID=321000001|910000082&Lang=N ; par3 = Bouwvergunningen volgens de effectieve datum van toekenning - woongebouwen - Belgi� - Periode 2003-06 tem 2008-05 ; | |||||||||||||||||||||||||||||||||||||||||
| R code (references can be found in the software module): | |||||||||||||||||||||||||||||||||||||||||
bitmap(file='test1.png') | |||||||||||||||||||||||||||||||||||||||||