Free Statistics
of Irreproducible Research!
Description of Statistical Computation | |
|---|---|
| Author's title | |
| Author | *The author of this computation has been verified* |
| R Software Module | Rscript (source code is shown below) |
| Title produced by software | R console |
| Date of computation | Wed, 15 Oct 2008 03:31:39 -0600 |
| Cite this page as follows | Statistical Computations at FreeStatistics.org, Office for Research Development and Education, URL https://freestatistics.org/blog/index.php?v=date/2008/Oct/15/t1224063100ttwrq1hpmkzn8at.htm/, Retrieved Sun, 19 May 2024 15:22:03 +0000 |
| Statistical Computations at FreeStatistics.org, Office for Research Development and Education, URL https://freestatistics.org/blog/index.php?pk=16273, Retrieved Sun, 19 May 2024 15:22:03 +0000 | |
| QR Codes: | |
|
| |
| Original text written by user: | no comments |
| IsPrivate? | No (this computation is public) |
| User-defined keywords | key1,key2 |
| Estimated Impact | 203 |
Tree of Dependent Computations | |
| Family? (F = Feedback message, R = changed R code, M = changed R Module, P = changed Parameters, D = changed Data) | |
| - [R console] [RC test] [2008-10-15 09:31:39] [9871d3a2c554b27151cacf1422eec048] [Current] | |
| Feedback Forum | |
Post a new message | |
Dataset | |
| Dataseries X: | |
-0.786367111459549 0.167170927069469 -0.127540608087943 0.93750585491392 1.39676581980954 1.05050456824455 0.111990077145168 0.666097179043269 -0.450746236900181 -0.736638098050093 0.549324527489978 0.995838437291142 -1.22020102277997 -1.32409563244472 -0.673975461984422 1.61421283335922 0.406594911126205 0.0722045210937808 -1.52425220335409 0.41721124913196 1.40318991384783 -0.453598933291087 -0.157833987488512 1.48614262264171 0.576881453172316 1.14069162516285 -0.565462169491638 -0.432483146270262 -1.97142690249425 0.747232619285749 -0.315291047752275 -0.0956193031016848 1.15627296347218 0.539335015299911 1.14446074204899 -0.142835371971715 0.786663055798535 2.36591672676155 -1.25410199489413 -1.33718942223620 2.37048987107716 0.82524674731736 -0.550079554654199 0.792291893791687 0.276014202242250 -0.96790580404296 -1.22267006995827 -0.201019918490694 -0.730389084851283 0.222887673434925 1.75159467219643 -0.0449513394802157 0.892387369644558 -0.186645921070938 1.64330714437877 0.815037228841058 0.576702250971827 0.257866790808344 2.01784605729602 1.12208031818350 1.57138257540577 0.314001282701490 -0.320607194333748 -0.209251933357265 -1.36046377638057 -1.63045666386982 0.710084777320341 -0.615301149158649 -1.03524024718018 -1.11180882982167 -1.50090553302382 0.752855557383579 2.54963626890298 1.01208364504167 0.0413933051153449 0.178986158804589 1.43584538847895 0.079096971844526 -0.232822166970124 1.75286108053017 -0.324818228369469 1.34980959283856 1.90034271103629 -0.944692168606846 -1.91904903956642 1.00453931633599 0.0955911015139073 -0.973211902370692 1.11535733287996 -0.512042025945919 -0.486903452569586 -0.329401289935006 0.49813126256602 -1.40009177513729 1.6885118874613 -0.937397702044849 -0.97873674920859 -0.479794296647733 -0.290072501600166 -0.175360913754221 | |
Tables (Output of Computation) | |
> first_number = 5
> second_number = 7
> strpar = 'hello'
> {
+ myfun <- function(x, y) {
+ x + y
+ }
+
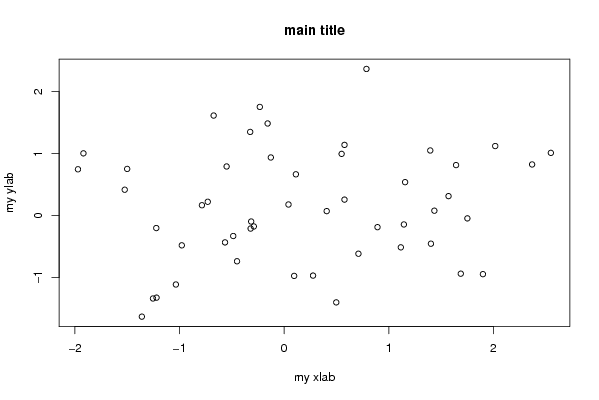
+ plot(RCx, main = 'main title', xlab = 'my xlab', ylab = 'my ylab')
+ .... [TRUNCATED]
[1] 12
| |
Figures (Output of Computation) | |
Input Parameters & R Code | |
| Parameters (Session): | |
| par1 = 5 ; par2 = 7 ; par3 = hello ; | |
| Parameters (R input): | |
| R code (body of R function): | |
{ | |