Free Statistics
of Irreproducible Research!
Description of Statistical Computation | |||||||||||||||||||||||||||||||||||||||||
|---|---|---|---|---|---|---|---|---|---|---|---|---|---|---|---|---|---|---|---|---|---|---|---|---|---|---|---|---|---|---|---|---|---|---|---|---|---|---|---|---|---|
| Author's title | |||||||||||||||||||||||||||||||||||||||||
| Author | *Unverified author* | ||||||||||||||||||||||||||||||||||||||||
| R Software Module | rwasp_univariatedataseries.wasp | ||||||||||||||||||||||||||||||||||||||||
| Title produced by software | Univariate Data Series | ||||||||||||||||||||||||||||||||||||||||
| Date of computation | Mon, 13 Oct 2008 17:24:38 -0600 | ||||||||||||||||||||||||||||||||||||||||
| Cite this page as follows | Statistical Computations at FreeStatistics.org, Office for Research Development and Education, URL https://freestatistics.org/blog/index.php?v=date/2008/Oct/14/t1223940312kghag4kpo7zs6s0.htm/, Retrieved Sun, 19 May 2024 15:55:50 +0000 | ||||||||||||||||||||||||||||||||||||||||
| Statistical Computations at FreeStatistics.org, Office for Research Development and Education, URL https://freestatistics.org/blog/index.php?pk=16166, Retrieved Sun, 19 May 2024 15:55:50 +0000 | |||||||||||||||||||||||||||||||||||||||||
| QR Codes: | |||||||||||||||||||||||||||||||||||||||||
|
| |||||||||||||||||||||||||||||||||||||||||
| Original text written by user: | |||||||||||||||||||||||||||||||||||||||||
| IsPrivate? | No (this computation is public) | ||||||||||||||||||||||||||||||||||||||||
| User-defined keywords | |||||||||||||||||||||||||||||||||||||||||
| Estimated Impact | 160 | ||||||||||||||||||||||||||||||||||||||||
Tree of Dependent Computations | |||||||||||||||||||||||||||||||||||||||||
| Family? (F = Feedback message, R = changed R code, M = changed R Module, P = changed Parameters, D = changed Data) | |||||||||||||||||||||||||||||||||||||||||
| F [Univariate Data Series] [Superplusbenzine ...] [2008-10-13 23:24:38] [721fbc57bdc4e4e6ec78137fe5a723c9] [Current] | |||||||||||||||||||||||||||||||||||||||||
| Feedback Forum | |||||||||||||||||||||||||||||||||||||||||
Post a new message | |||||||||||||||||||||||||||||||||||||||||
Dataset | |||||||||||||||||||||||||||||||||||||||||
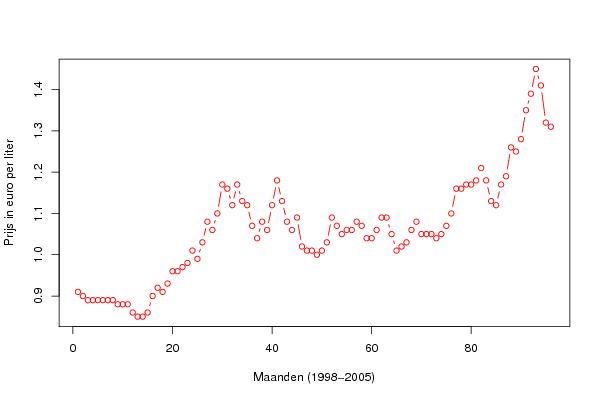
| Dataseries X: | |||||||||||||||||||||||||||||||||||||||||
0,91 0,9 0,89 0,89 0,89 0,89 0,89 0,89 0,88 0,88 0,88 0,86 0,85 0,85 0,86 0,9 0,92 0,91 0,93 0,96 0,96 0,97 0,98 1,01 0,99 1,03 1,08 1,06 1,1 1,17 1,16 1,12 1,17 1,13 1,12 1,07 1,04 1,08 1,06 1,12 1,18 1,13 1,08 1,06 1,09 1,02 1,01 1,01 1 1,01 1,03 1,09 1,07 1,05 1,06 1,06 1,08 1,07 1,04 1,04 1,06 1,09 1,09 1,05 1,01 1,02 1,03 1,06 1,08 1,05 1,05 1,05 1,04 1,05 1,07 1,1 1,16 1,16 1,17 1,17 1,18 1,21 1,18 1,13 1,12 1,17 1,19 1,26 1,25 1,28 1,35 1,39 1,45 1,41 1,32 1,31 | |||||||||||||||||||||||||||||||||||||||||
Tables (Output of Computation) | |||||||||||||||||||||||||||||||||||||||||
| |||||||||||||||||||||||||||||||||||||||||
Figures (Output of Computation) | |||||||||||||||||||||||||||||||||||||||||
Input Parameters & R Code | |||||||||||||||||||||||||||||||||||||||||
| Parameters (Session): | |||||||||||||||||||||||||||||||||||||||||
| par1 = Superplusbenzine loodvrij 98 (1998-2005) ; par2 = http://www.nbb.be/belgostat/PresentationLinker?TableId=251000019&Lang=N ; par3 = Superplusbenzine loodvrij 98 (1998-2005) ; | |||||||||||||||||||||||||||||||||||||||||
| Parameters (R input): | |||||||||||||||||||||||||||||||||||||||||
| par1 = Superplusbenzine loodvrij 98 (1998-2005) ; par2 = http://www.nbb.be/belgostat/PresentationLinker?TableId=251000019&Lang=N ; par3 = Superplusbenzine loodvrij 98 (1998-2005) ; | |||||||||||||||||||||||||||||||||||||||||
| R code (references can be found in the software module): | |||||||||||||||||||||||||||||||||||||||||
bitmap(file='test1.png') | |||||||||||||||||||||||||||||||||||||||||