Free Statistics
of Irreproducible Research!
Description of Statistical Computation | |||||||||||||||||||||||||||||||||||||||||
|---|---|---|---|---|---|---|---|---|---|---|---|---|---|---|---|---|---|---|---|---|---|---|---|---|---|---|---|---|---|---|---|---|---|---|---|---|---|---|---|---|---|
| Author's title | |||||||||||||||||||||||||||||||||||||||||
| Author | *Unverified author* | ||||||||||||||||||||||||||||||||||||||||
| R Software Module | rwasp_univariatedataseries.wasp | ||||||||||||||||||||||||||||||||||||||||
| Title produced by software | Univariate Data Series | ||||||||||||||||||||||||||||||||||||||||
| Date of computation | Mon, 13 Oct 2008 16:15:41 -0600 | ||||||||||||||||||||||||||||||||||||||||
| Cite this page as follows | Statistical Computations at FreeStatistics.org, Office for Research Development and Education, URL https://freestatistics.org/blog/index.php?v=date/2008/Oct/14/t1223936186em7xl1r6dchrrxw.htm/, Retrieved Sun, 19 May 2024 13:53:44 +0000 | ||||||||||||||||||||||||||||||||||||||||
| Statistical Computations at FreeStatistics.org, Office for Research Development and Education, URL https://freestatistics.org/blog/index.php?pk=16125, Retrieved Sun, 19 May 2024 13:53:44 +0000 | |||||||||||||||||||||||||||||||||||||||||
| QR Codes: | |||||||||||||||||||||||||||||||||||||||||
|
| |||||||||||||||||||||||||||||||||||||||||
| Original text written by user: | |||||||||||||||||||||||||||||||||||||||||
| IsPrivate? | No (this computation is public) | ||||||||||||||||||||||||||||||||||||||||
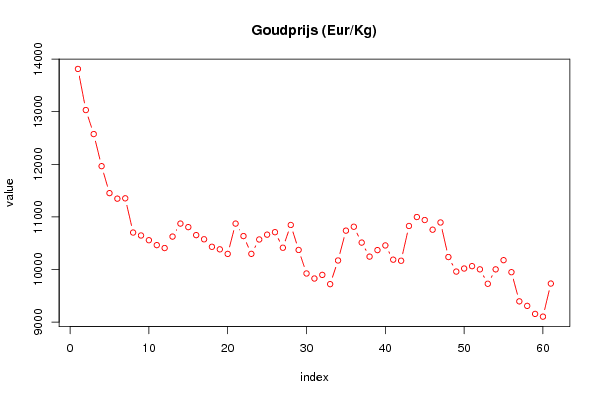
| User-defined keywords | Goudprijs (Eur/Kg) | ||||||||||||||||||||||||||||||||||||||||
| Estimated Impact | 180 | ||||||||||||||||||||||||||||||||||||||||
Tree of Dependent Computations | |||||||||||||||||||||||||||||||||||||||||
| Family? (F = Feedback message, R = changed R code, M = changed R Module, P = changed Parameters, D = changed Data) | |||||||||||||||||||||||||||||||||||||||||
| F [Univariate Data Series] [Tijdsreek 3] [2008-10-13 22:15:41] [6d5cd2fe15d123a10639b4bf141c23b5] [Current] | |||||||||||||||||||||||||||||||||||||||||
| Feedback Forum | |||||||||||||||||||||||||||||||||||||||||
Post a new message | |||||||||||||||||||||||||||||||||||||||||
Dataset | |||||||||||||||||||||||||||||||||||||||||
| Dataseries X: | |||||||||||||||||||||||||||||||||||||||||
13812,00 13031,00 12574,00 11964,00 11451,00 11346,00 11353,00 10702,00 10646,00 10556,00 10463,00 10407,00 10625,00 10872,00 10805,00 10653,00 10574,00 10431,00 10383,00 10296,00 10872,00 10635,00 10297,00 10570,00 10662,00 10709,00 10413,00 10846,00 10371,00 9924,00 9828,00 9897,00 9721,00 10171,00 10738,00 10812,00 10511,00 10244,00 10368,00 10457,00 10186,00 10166,00 10827,00 10997,00 10940,00 10756,00 10893,00 10236,00 9960,00 10018,00 10063,00 10002,00 9728,00 10002,00 10177,00 9948,00 9394,00 9308,00 9155,00 9103,00 9732,00 | |||||||||||||||||||||||||||||||||||||||||
Tables (Output of Computation) | |||||||||||||||||||||||||||||||||||||||||
| |||||||||||||||||||||||||||||||||||||||||
Figures (Output of Computation) | |||||||||||||||||||||||||||||||||||||||||
Input Parameters & R Code | |||||||||||||||||||||||||||||||||||||||||
| Parameters (Session): | |||||||||||||||||||||||||||||||||||||||||
| par1 = Goudprijs (Eur/Kg) ; par2 = Belgostat ; par3 = Tijdsreeks ; | |||||||||||||||||||||||||||||||||||||||||
| Parameters (R input): | |||||||||||||||||||||||||||||||||||||||||
| par1 = Goudprijs (Eur/Kg) ; par2 = Belgostat ; par3 = Tijdsreeks ; | |||||||||||||||||||||||||||||||||||||||||
| R code (references can be found in the software module): | |||||||||||||||||||||||||||||||||||||||||
bitmap(file='test1.png') | |||||||||||||||||||||||||||||||||||||||||