Free Statistics
of Irreproducible Research!
Description of Statistical Computation | |||||||||||||||||||||||||||||||||||||||||||||
|---|---|---|---|---|---|---|---|---|---|---|---|---|---|---|---|---|---|---|---|---|---|---|---|---|---|---|---|---|---|---|---|---|---|---|---|---|---|---|---|---|---|---|---|---|---|
| Author's title | |||||||||||||||||||||||||||||||||||||||||||||
| Author | *The author of this computation has been verified* | ||||||||||||||||||||||||||||||||||||||||||||
| R Software Module | rwasp_univariatedataseries.wasp | ||||||||||||||||||||||||||||||||||||||||||||
| Title produced by software | Univariate Data Series | ||||||||||||||||||||||||||||||||||||||||||||
| Date of computation | Mon, 13 Oct 2008 14:55:30 -0600 | ||||||||||||||||||||||||||||||||||||||||||||
| Cite this page as follows | Statistical Computations at FreeStatistics.org, Office for Research Development and Education, URL https://freestatistics.org/blog/index.php?v=date/2008/Oct/13/t12239314155r222btucgxrimt.htm/, Retrieved Sun, 19 May 2024 13:07:31 +0000 | ||||||||||||||||||||||||||||||||||||||||||||
| Statistical Computations at FreeStatistics.org, Office for Research Development and Education, URL https://freestatistics.org/blog/index.php?pk=16063, Retrieved Sun, 19 May 2024 13:07:31 +0000 | |||||||||||||||||||||||||||||||||||||||||||||
| QR Codes: | |||||||||||||||||||||||||||||||||||||||||||||
|
| |||||||||||||||||||||||||||||||||||||||||||||
| Original text written by user: | |||||||||||||||||||||||||||||||||||||||||||||
| IsPrivate? | No (this computation is public) | ||||||||||||||||||||||||||||||||||||||||||||
| User-defined keywords | |||||||||||||||||||||||||||||||||||||||||||||
| Estimated Impact | 284 | ||||||||||||||||||||||||||||||||||||||||||||
Tree of Dependent Computations | |||||||||||||||||||||||||||||||||||||||||||||
| Family? (F = Feedback message, R = changed R code, M = changed R Module, P = changed Parameters, D = changed Data) | |||||||||||||||||||||||||||||||||||||||||||||
| F [Univariate Data Series] [tijdreeks verkoop...] [2008-10-13 20:55:30] [f6a332ba2d530c028d935c5a5bbb53af] [Current] - PD [Univariate Data Series] [indicator consume...] [2008-10-19 11:29:07] [d2d412c7f4d35ffbf5ee5ee89db327d4] - PD [Univariate Data Series] [algemene indicato...] [2008-10-19 11:36:13] [d2d412c7f4d35ffbf5ee5ee89db327d4] - PD [Univariate Data Series] [werkloosheidsindi...] [2008-10-19 11:38:38] [d2d412c7f4d35ffbf5ee5ee89db327d4] - PD [Univariate Data Series] [financiele indica...] [2008-10-19 11:40:44] [d2d412c7f4d35ffbf5ee5ee89db327d4] - PD [Univariate Data Series] [spaarvermogens in...] [2008-10-19 11:42:41] [a18c43c8b63fa6800a53bb187b9ddd45] - PD [Univariate Data Series] [totale werkloosheid] [2008-10-19 15:02:07] [d2d412c7f4d35ffbf5ee5ee89db327d4] - D [Univariate Data Series] [werloosheid mannen] [2008-10-19 15:03:59] [d2d412c7f4d35ffbf5ee5ee89db327d4] - D [Univariate Data Series] [werkloosheid vrou...] [2008-10-19 15:06:34] [d2d412c7f4d35ffbf5ee5ee89db327d4] - D [Univariate Data Series] [werkloosheid oude...] [2008-10-19 15:09:00] [d2d412c7f4d35ffbf5ee5ee89db327d4] - RMPD [Cross Correlation Function] [] [2008-11-28 11:47:25] [d2d412c7f4d35ffbf5ee5ee89db327d4] - P [Cross Correlation Function] [] [2008-11-28 12:10:30] [d2d412c7f4d35ffbf5ee5ee89db327d4] F P [Cross Correlation Function] [Q9] [2008-11-28 13:54:38] [87cabf13a90315c7085b765dcebb7412] - P [Cross Correlation Function] [Non Stationary Ti...] [2008-11-28 12:34:34] [063e4b67ad7d3a8a83eccec794cd5aa7] - P [Cross Correlation Function] [Non Stationary Ti...] [2008-11-30 13:27:08] [063e4b67ad7d3a8a83eccec794cd5aa7] F P [Cross Correlation Function] [Q7] [2008-11-28 13:38:36] [87cabf13a90315c7085b765dcebb7412] - RMP [Variance Reduction Matrix] [] [2008-11-28 11:55:17] [d2d412c7f4d35ffbf5ee5ee89db327d4] F PD [Variance Reduction Matrix] [Q8 1] [2008-11-28 13:45:14] [87cabf13a90315c7085b765dcebb7412] - D [Variance Reduction Matrix] [Non Stationary Ti...] [2008-11-30 13:11:49] [063e4b67ad7d3a8a83eccec794cd5aa7] - RMPD [Variance Reduction Matrix] [] [2008-11-28 11:58:49] [d2d412c7f4d35ffbf5ee5ee89db327d4] F PD [Variance Reduction Matrix] [Q8 2] [2008-11-28 13:47:24] [87cabf13a90315c7085b765dcebb7412] - D [Variance Reduction Matrix] [Non Stationary Ti...] [2008-11-30 13:16:54] [063e4b67ad7d3a8a83eccec794cd5aa7] | |||||||||||||||||||||||||||||||||||||||||||||
| Feedback Forum | |||||||||||||||||||||||||||||||||||||||||||||
Post a new message | |||||||||||||||||||||||||||||||||||||||||||||
Dataset | |||||||||||||||||||||||||||||||||||||||||||||
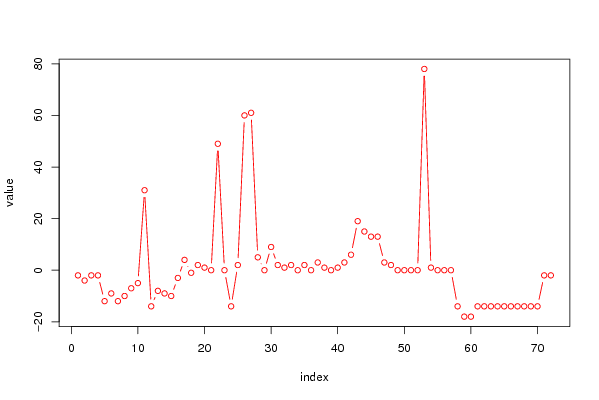
| Dataseries X: | |||||||||||||||||||||||||||||||||||||||||||||
-2 -4 -2 -2 -12 -9 -12 -10 -7 -5 31 -14 -8 -9 -10 -3 4 -1 2 1 0 49 0 -14 2 60 61 5 0 9 2 1 2 0 2 0 3 1 0 1 3 6 19 15 13 13 3 2 0 0 0 0 78 1 0 0 0 -14 -18 -18 -14 -14 -14 -14 -14 -14 -14 -14 -14 -14 -2 -2 | |||||||||||||||||||||||||||||||||||||||||||||
Tables (Output of Computation) | |||||||||||||||||||||||||||||||||||||||||||||
| |||||||||||||||||||||||||||||||||||||||||||||
Figures (Output of Computation) | |||||||||||||||||||||||||||||||||||||||||||||
Input Parameters & R Code | |||||||||||||||||||||||||||||||||||||||||||||
| Parameters (Session): | |||||||||||||||||||||||||||||||||||||||||||||
| par1 = verkoopprijzen scheepsbouw ; par2 = belgostat ; | |||||||||||||||||||||||||||||||||||||||||||||
| Parameters (R input): | |||||||||||||||||||||||||||||||||||||||||||||
| par1 = verkoopprijzen scheepsbouw ; par2 = belgostat ; par3 = ; | |||||||||||||||||||||||||||||||||||||||||||||
| R code (references can be found in the software module): | |||||||||||||||||||||||||||||||||||||||||||||
bitmap(file='test1.png') | |||||||||||||||||||||||||||||||||||||||||||||