Free Statistics
of Irreproducible Research!
Description of Statistical Computation | |||||||||||||||||||||||||||||||||||||||||||||||||||
|---|---|---|---|---|---|---|---|---|---|---|---|---|---|---|---|---|---|---|---|---|---|---|---|---|---|---|---|---|---|---|---|---|---|---|---|---|---|---|---|---|---|---|---|---|---|---|---|---|---|---|---|
| Author's title | |||||||||||||||||||||||||||||||||||||||||||||||||||
| Author | *Unverified author* | ||||||||||||||||||||||||||||||||||||||||||||||||||
| R Software Module | rwasp_univariatedataseries.wasp | ||||||||||||||||||||||||||||||||||||||||||||||||||
| Title produced by software | Univariate Data Series | ||||||||||||||||||||||||||||||||||||||||||||||||||
| Date of computation | Mon, 13 Oct 2008 13:11:39 -0600 | ||||||||||||||||||||||||||||||||||||||||||||||||||
| Cite this page as follows | Statistical Computations at FreeStatistics.org, Office for Research Development and Education, URL https://freestatistics.org/blog/index.php?v=date/2008/Oct/13/t1223925134v0auqyas5nloiyn.htm/, Retrieved Sun, 19 May 2024 13:18:09 +0000 | ||||||||||||||||||||||||||||||||||||||||||||||||||
| Statistical Computations at FreeStatistics.org, Office for Research Development and Education, URL https://freestatistics.org/blog/index.php?pk=15958, Retrieved Sun, 19 May 2024 13:18:09 +0000 | |||||||||||||||||||||||||||||||||||||||||||||||||||
| QR Codes: | |||||||||||||||||||||||||||||||||||||||||||||||||||
|
| |||||||||||||||||||||||||||||||||||||||||||||||||||
| Original text written by user: | |||||||||||||||||||||||||||||||||||||||||||||||||||
| IsPrivate? | No (this computation is public) | ||||||||||||||||||||||||||||||||||||||||||||||||||
| User-defined keywords | |||||||||||||||||||||||||||||||||||||||||||||||||||
| Estimated Impact | 197 | ||||||||||||||||||||||||||||||||||||||||||||||||||
Tree of Dependent Computations | |||||||||||||||||||||||||||||||||||||||||||||||||||
| Family? (F = Feedback message, R = changed R code, M = changed R Module, P = changed Parameters, D = changed Data) | |||||||||||||||||||||||||||||||||||||||||||||||||||
| F [Univariate Data Series] [invoer vanuit vs] [2008-10-13 19:11:39] [a8228479d4547a92e2d3f176a5299609] [Current] - PD [Univariate Data Series] [Productie voedsel...] [2008-10-19 13:35:18] [ed2ba3b6182103c15c0ab511ae4e6284] - PD [Univariate Data Series] [Productie Voedsel...] [2008-10-19 14:08:24] [ed2ba3b6182103c15c0ab511ae4e6284] F RMPD [Central Tendency] [Central tend voed...] [2008-10-20 15:19:10] [ed2ba3b6182103c15c0ab511ae4e6284] - RM [Percentiles] [Percentielen pred...] [2008-10-22 16:03:31] [ed2ba3b6182103c15c0ab511ae4e6284] F RMPD [Pearson Correlation] [Correl voedsel en...] [2008-10-20 16:30:30] [ed2ba3b6182103c15c0ab511ae4e6284] F D [Pearson Correlation] [correl consumpt v...] [2008-10-20 16:37:08] [ed2ba3b6182103c15c0ab511ae4e6284] F D [Pearson Correlation] [correl tot pro en...] [2008-10-20 16:45:16] [ed2ba3b6182103c15c0ab511ae4e6284] F D [Pearson Correlation] [correl tot en tab] [2008-10-20 16:49:04] [ed2ba3b6182103c15c0ab511ae4e6284] F D [Pearson Correlation] [correl consu en t...] [2008-10-20 16:54:01] [ed2ba3b6182103c15c0ab511ae4e6284] F D [Pearson Correlation] [corre consu en tota] [2008-10-20 16:57:40] [ed2ba3b6182103c15c0ab511ae4e6284] - D [Pearson Correlation] [correlatie gezond...] [2008-10-20 17:32:21] [4ad596f10399a71ad29b7d76e6ab90ac] - D [Pearson Correlation] [correlatie tussen...] [2008-10-20 17:38:26] [4ad596f10399a71ad29b7d76e6ab90ac] - D [Pearson Correlation] [correlatie tussen...] [2008-10-20 17:49:20] [4ad596f10399a71ad29b7d76e6ab90ac] - D [Pearson Correlation] [correlatie tussen...] [2008-10-20 17:57:05] [4ad596f10399a71ad29b7d76e6ab90ac] - D [Pearson Correlation] [correlatie index ...] [2008-10-20 18:04:28] [4ad596f10399a71ad29b7d76e6ab90ac] - D [Pearson Correlation] [correlatie tussen...] [2008-10-20 18:09:23] [4ad596f10399a71ad29b7d76e6ab90ac] F PD [Univariate Data Series] [Totale productie ...] [2008-10-19 13:44:22] [ed2ba3b6182103c15c0ab511ae4e6284] F RMPD [Univariate Explorative Data Analysis] [Totale productie ...] [2008-10-27 19:47:56] [ed2ba3b6182103c15c0ab511ae4e6284] - P [Univariate Explorative Data Analysis] [Totale productie ...] [2008-10-29 14:28:38] [ed2ba3b6182103c15c0ab511ae4e6284] - RMPD [Central Tendency] [central tend produ] [2008-10-27 20:18:10] [ed2ba3b6182103c15c0ab511ae4e6284] - PD [Univariate Data Series] [Productie bestemm...] [2008-10-19 13:50:01] [ed2ba3b6182103c15c0ab511ae4e6284] F RMPD [Univariate Explorative Data Analysis] [consumptie goederen] [2008-10-27 19:57:13] [ed2ba3b6182103c15c0ab511ae4e6284] - P [Univariate Explorative Data Analysis] [lag plot] [2008-10-29 14:33:00] [ed2ba3b6182103c15c0ab511ae4e6284] - PD [Univariate Data Series] [Productie tabak] [2008-10-19 14:02:13] [ed2ba3b6182103c15c0ab511ae4e6284] F RMPD [Univariate Explorative Data Analysis] [blog tabak EDA uni] [2008-10-27 20:01:06] [ed2ba3b6182103c15c0ab511ae4e6284] F RM [Tukey lambda PPCC Plot] [blog symmetrisch] [2008-10-27 20:11:50] [ed2ba3b6182103c15c0ab511ae4e6284] - RM D [Harrell-Davis Quantiles] [betrouwbaarheidin...] [2008-10-27 20:22:12] [ed2ba3b6182103c15c0ab511ae4e6284] | |||||||||||||||||||||||||||||||||||||||||||||||||||
| Feedback Forum | |||||||||||||||||||||||||||||||||||||||||||||||||||
Post a new message | |||||||||||||||||||||||||||||||||||||||||||||||||||
Dataset | |||||||||||||||||||||||||||||||||||||||||||||||||||
| Dataseries X: | |||||||||||||||||||||||||||||||||||||||||||||||||||
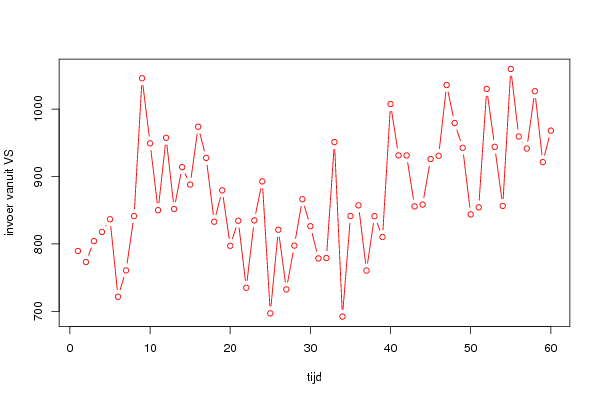
789,6 773,3 804,3 817,8 836,7 721,8 760,8 841,4 1045,6 949,2 850,1 957,4 851,8 913,9 888 973,8 927,6 833 879,5 797,3 834,5 735,1 835 892,8 697,2 821,1 732,7 797,6 866,3 826,3 778,6 779,2 951 692,3 841,4 857,3 760,7 841,2 810,3 1007,4 931,3 931,2 855,8 858,4 925,9 930,7 1035,6 979,2 942,6 843,9 854,3 1029,8 944 856,4 1059,4 959,3 941,5 1026,4 921,3 968 | |||||||||||||||||||||||||||||||||||||||||||||||||||
Tables (Output of Computation) | |||||||||||||||||||||||||||||||||||||||||||||||||||
| |||||||||||||||||||||||||||||||||||||||||||||||||||
Figures (Output of Computation) | |||||||||||||||||||||||||||||||||||||||||||||||||||
Input Parameters & R Code | |||||||||||||||||||||||||||||||||||||||||||||||||||
| Parameters (Session): | |||||||||||||||||||||||||||||||||||||||||||||||||||
| par1 = Invoer vanuit VS ; par2 = http://www.nbb.be/belgostat/PresentationLinker?TableId=365000041&Lang=N ; par3 = invoer vanuit VS ; | |||||||||||||||||||||||||||||||||||||||||||||||||||
| Parameters (R input): | |||||||||||||||||||||||||||||||||||||||||||||||||||
| par1 = Invoer vanuit VS ; par2 = http://www.nbb.be/belgostat/PresentationLinker?TableId=365000041&Lang=N ; par3 = invoer vanuit VS ; | |||||||||||||||||||||||||||||||||||||||||||||||||||
| R code (references can be found in the software module): | |||||||||||||||||||||||||||||||||||||||||||||||||||
bitmap(file='test1.png') | |||||||||||||||||||||||||||||||||||||||||||||||||||