Free Statistics
of Irreproducible Research!
Description of Statistical Computation | |||||||||||||||||||||||||||||||||||||||||
|---|---|---|---|---|---|---|---|---|---|---|---|---|---|---|---|---|---|---|---|---|---|---|---|---|---|---|---|---|---|---|---|---|---|---|---|---|---|---|---|---|---|
| Author's title | |||||||||||||||||||||||||||||||||||||||||
| Author | *Unverified author* | ||||||||||||||||||||||||||||||||||||||||
| R Software Module | rwasp_univariatedataseries.wasp | ||||||||||||||||||||||||||||||||||||||||
| Title produced by software | Univariate Data Series | ||||||||||||||||||||||||||||||||||||||||
| Date of computation | Mon, 13 Oct 2008 12:50:00 -0600 | ||||||||||||||||||||||||||||||||||||||||
| Cite this page as follows | Statistical Computations at FreeStatistics.org, Office for Research Development and Education, URL https://freestatistics.org/blog/index.php?v=date/2008/Oct/13/t12239238419dvrv911k4kkfaa.htm/, Retrieved Sun, 19 May 2024 15:20:43 +0000 | ||||||||||||||||||||||||||||||||||||||||
| Statistical Computations at FreeStatistics.org, Office for Research Development and Education, URL https://freestatistics.org/blog/index.php?pk=15912, Retrieved Sun, 19 May 2024 15:20:43 +0000 | |||||||||||||||||||||||||||||||||||||||||
| QR Codes: | |||||||||||||||||||||||||||||||||||||||||
|
| |||||||||||||||||||||||||||||||||||||||||
| Original text written by user: | |||||||||||||||||||||||||||||||||||||||||
| IsPrivate? | No (this computation is public) | ||||||||||||||||||||||||||||||||||||||||
| User-defined keywords | |||||||||||||||||||||||||||||||||||||||||
| Estimated Impact | 141 | ||||||||||||||||||||||||||||||||||||||||
Tree of Dependent Computations | |||||||||||||||||||||||||||||||||||||||||
| Family? (F = Feedback message, R = changed R code, M = changed R Module, P = changed Parameters, D = changed Data) | |||||||||||||||||||||||||||||||||||||||||
| F [Univariate Data Series] [Invoer Belgi� VS] [2008-10-13 18:50:00] [21d7d81e7693ad6dde5aadefb1046611] [Current] F RMPD [Central Tendency] [Central Tendency ...] [2008-10-20 22:47:54] [bc937651ef42bf891200cf0e0edc7238] F RMPD [Back to Back Histogram] [BB Histo invoer u...] [2008-10-20 22:56:16] [bc937651ef42bf891200cf0e0edc7238] F RMPD [Pearson Correlation] [Invoer uitvoer co...] [2008-10-20 22:59:34] [bc937651ef42bf891200cf0e0edc7238] F RMPD [Pearson Correlation] [Correlatie inflat...] [2008-10-20 23:02:55] [bc937651ef42bf891200cf0e0edc7238] | |||||||||||||||||||||||||||||||||||||||||
| Feedback Forum | |||||||||||||||||||||||||||||||||||||||||
Post a new message | |||||||||||||||||||||||||||||||||||||||||
Dataset | |||||||||||||||||||||||||||||||||||||||||
| Dataseries X: | |||||||||||||||||||||||||||||||||||||||||
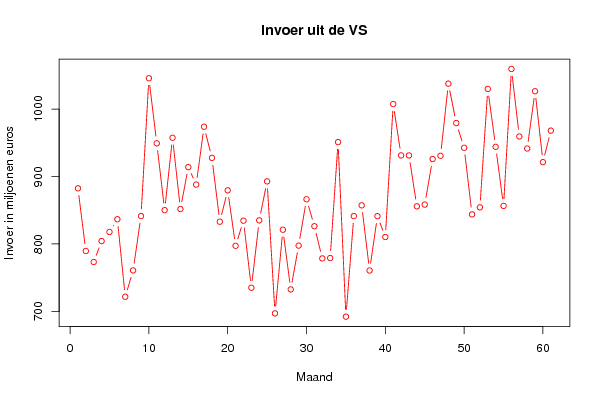
882,5 789,6 773,3 804,3 817,8 836,7 721,8 760,8 841,4 1045,6 949,2 850,1 957,4 851,8 913,9 888,0 973,8 927,6 833,0 879,5 797,3 834,5 735,1 835,0 892,8 697,2 821,1 732,7 797,6 866,3 826,3 778,6 779,2 951,0 692,3 841,4 857,3 760,7 841,2 810,3 1007,4 931,3 931,2 855,8 858,4 925,9 930,7 1037,6 979,2 942,6 843,9 854,3 1029,8 944,0 856,4 1059,4 959,3 941,5 1026,4 921,3 968,0 | |||||||||||||||||||||||||||||||||||||||||
Tables (Output of Computation) | |||||||||||||||||||||||||||||||||||||||||
| |||||||||||||||||||||||||||||||||||||||||
Figures (Output of Computation) | |||||||||||||||||||||||||||||||||||||||||
Input Parameters & R Code | |||||||||||||||||||||||||||||||||||||||||
| Parameters (Session): | |||||||||||||||||||||||||||||||||||||||||
| par1 = Belgische invoer van de Verenigde Staten ; par2 = http://www.nbb.be/belgostat/PresentationLinker?TableId=365000041&Lang=N ; | |||||||||||||||||||||||||||||||||||||||||
| Parameters (R input): | |||||||||||||||||||||||||||||||||||||||||
| par1 = Belgische invoer van de Verenigde Staten ; par2 = http://www.nbb.be/belgostat/PresentationLinker?TableId=365000041&Lang=N ; par3 = ; | |||||||||||||||||||||||||||||||||||||||||
| R code (references can be found in the software module): | |||||||||||||||||||||||||||||||||||||||||
bitmap(file='test1.png') | |||||||||||||||||||||||||||||||||||||||||