Free Statistics
of Irreproducible Research!
Description of Statistical Computation | |||||||||||||||||||||||||||||||||||||||||
|---|---|---|---|---|---|---|---|---|---|---|---|---|---|---|---|---|---|---|---|---|---|---|---|---|---|---|---|---|---|---|---|---|---|---|---|---|---|---|---|---|---|
| Author's title | |||||||||||||||||||||||||||||||||||||||||
| Author | *Unverified author* | ||||||||||||||||||||||||||||||||||||||||
| R Software Module | rwasp_univariatedataseries.wasp | ||||||||||||||||||||||||||||||||||||||||
| Title produced by software | Univariate Data Series | ||||||||||||||||||||||||||||||||||||||||
| Date of computation | Mon, 13 Oct 2008 11:40:51 -0600 | ||||||||||||||||||||||||||||||||||||||||
| Cite this page as follows | Statistical Computations at FreeStatistics.org, Office for Research Development and Education, URL https://freestatistics.org/blog/index.php?v=date/2008/Oct/13/t1223919718nz66upq8wvkh65x.htm/, Retrieved Sun, 19 May 2024 13:18:38 +0000 | ||||||||||||||||||||||||||||||||||||||||
| Statistical Computations at FreeStatistics.org, Office for Research Development and Education, URL https://freestatistics.org/blog/index.php?pk=15789, Retrieved Sun, 19 May 2024 13:18:38 +0000 | |||||||||||||||||||||||||||||||||||||||||
| QR Codes: | |||||||||||||||||||||||||||||||||||||||||
|
| |||||||||||||||||||||||||||||||||||||||||
| Original text written by user: | |||||||||||||||||||||||||||||||||||||||||
| IsPrivate? | No (this computation is public) | ||||||||||||||||||||||||||||||||||||||||
| User-defined keywords | leeftijdscategorie= -25 jaar | ||||||||||||||||||||||||||||||||||||||||
| Estimated Impact | 124 | ||||||||||||||||||||||||||||||||||||||||
Tree of Dependent Computations | |||||||||||||||||||||||||||||||||||||||||
| Family? (F = Feedback message, R = changed R code, M = changed R Module, P = changed Parameters, D = changed Data) | |||||||||||||||||||||||||||||||||||||||||
| F [Univariate Data Series] [Niet-werkende wer...] [2008-10-13 17:40:51] [27189814204044fdc56e2241a9375b9f] [Current] | |||||||||||||||||||||||||||||||||||||||||
| Feedback Forum | |||||||||||||||||||||||||||||||||||||||||
Post a new message | |||||||||||||||||||||||||||||||||||||||||
Dataset | |||||||||||||||||||||||||||||||||||||||||
| Dataseries X: | |||||||||||||||||||||||||||||||||||||||||
85947 83138 79141 75644 71666 69808 92251 100051 101455 98878 97959 97694 96431 92625 88174 83895 79144 77229 97469 106524 107818 104753 100177 97188 94098 88866 82412 75789 72097 68925 87535 98297 98580 96842 93845 88875 90495 83043 77835 73267 69082 62981 82702 89055 89386 84483 80635 80042 77916 71476 65571 60436 56905 55383 74650 79473 80696 80539 75302 76664 73818 66230 61090 56536 52175 50263 68360 71597 72175 69191 65296 64057 61134 55141 49646 44986 40882 39822 58054 61988 61102 57018 54425 53138 50631 44720 41603 35751 32802 31552 47454 52650 51346 48598 46334 45679 43941 39184 34663 31522 29311 29273 46795 50339 51698 49846 48181 48266 47250 45475 41751 38817 36513 35991 53604 58572 59870 58255 56212 56457 55220 51239 47462 45098 42210 42443 57853 63344 63748 62154 60695 62449 61841 59419 56570 53674 51499 51974 70378 76647 78264 76239 75096 75174 73930 69988 64961 60288 56176 54316 69566 75703 75446 72923 69192 68241 66902 64102 60741 57440 53374 52054 68334 75004 75428 74380 71309 70865 70503 67125 62783 60189 56070 54392 70933 77613 77018 73135 69686 68322 66678 64213 61064 58499 54794 53985 67728 73433 75623 69853 65634 64786 62589 60780 57771 54734 51282 48507 63088 73683 72490 66614 62271 61832 61297 58947 56512 53497 50304 48022 60945 69225 68171 62655 58020 56502 55418 53017 49398 47447 44221 42619 54722 63947 62530 58703 53609 51760 51978 50330 48538 46636 44574 43028 56924 65193 67132 64398 57591 56279 56331 55015 53405 51200 48695 48057 65964 71371 72184 69400 65605 64727 64506 62751 59938 57870 55263 55777 73944 78201 78715 75009 69705 69979 69755 68155 64211 61110 58373 58288 74822 79606 80232 75631 70996 69144 67141 65413 63391 60964 58412 57539 73377 77413 78932 74789 70076 67944 64076 63136 60198 59057 57388 56708 70019 72263 74152 67057 61941 58331 59252 56568 53031 51840 48290 45817 59421 61621 60976 57497 53037 53088 53119 51644 47866 47691 42401 43069 55797 57170 58335 | |||||||||||||||||||||||||||||||||||||||||
Tables (Output of Computation) | |||||||||||||||||||||||||||||||||||||||||
| |||||||||||||||||||||||||||||||||||||||||
Figures (Output of Computation) | |||||||||||||||||||||||||||||||||||||||||
Input Parameters & R Code | |||||||||||||||||||||||||||||||||||||||||
| Parameters (Session): | |||||||||||||||||||||||||||||||||||||||||
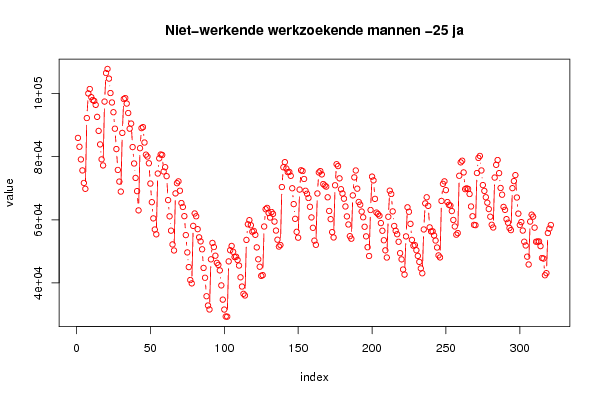
| par1 = Niet-werkende werkzoekende mannen -25 jaar ; par2 = belgostat ; par3 = Totale niet-werkende werkzoekenden mannen -25 jaar ; | |||||||||||||||||||||||||||||||||||||||||
| Parameters (R input): | |||||||||||||||||||||||||||||||||||||||||
| par1 = Niet-werkende werkzoekende mannen -25 jaar ; par2 = belgostat ; par3 = Totale niet-werkende werkzoekenden mannen -25 jaar ; | |||||||||||||||||||||||||||||||||||||||||
| R code (references can be found in the software module): | |||||||||||||||||||||||||||||||||||||||||
bitmap(file='test1.png') | |||||||||||||||||||||||||||||||||||||||||