Free Statistics
of Irreproducible Research!
Description of Statistical Computation | |||||||||||||||||||||||||||||||||||||||||
|---|---|---|---|---|---|---|---|---|---|---|---|---|---|---|---|---|---|---|---|---|---|---|---|---|---|---|---|---|---|---|---|---|---|---|---|---|---|---|---|---|---|
| Author's title | |||||||||||||||||||||||||||||||||||||||||
| Author | *Unverified author* | ||||||||||||||||||||||||||||||||||||||||
| R Software Module | rwasp_univariatedataseries.wasp | ||||||||||||||||||||||||||||||||||||||||
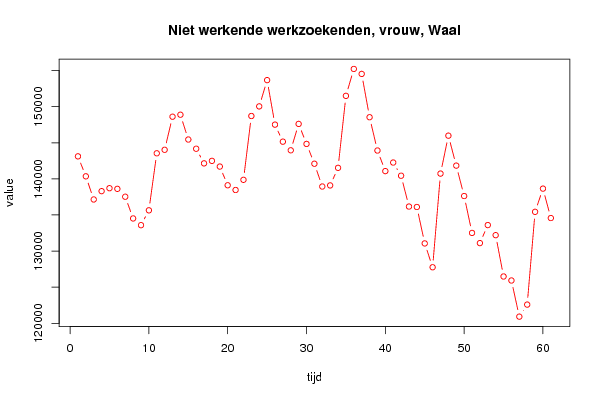
| Title produced by software | Univariate Data Series | ||||||||||||||||||||||||||||||||||||||||
| Date of computation | Mon, 13 Oct 2008 11:30:07 -0600 | ||||||||||||||||||||||||||||||||||||||||
| Cite this page as follows | Statistical Computations at FreeStatistics.org, Office for Research Development and Education, URL https://freestatistics.org/blog/index.php?v=date/2008/Oct/13/t1223919040s57d3o8oijgcht1.htm/, Retrieved Sun, 19 May 2024 13:32:29 +0000 | ||||||||||||||||||||||||||||||||||||||||
| Statistical Computations at FreeStatistics.org, Office for Research Development and Education, URL https://freestatistics.org/blog/index.php?pk=15780, Retrieved Sun, 19 May 2024 13:32:29 +0000 | |||||||||||||||||||||||||||||||||||||||||
| QR Codes: | |||||||||||||||||||||||||||||||||||||||||
|
| |||||||||||||||||||||||||||||||||||||||||
| Original text written by user: | |||||||||||||||||||||||||||||||||||||||||
| IsPrivate? | No (this computation is public) | ||||||||||||||||||||||||||||||||||||||||
| User-defined keywords | |||||||||||||||||||||||||||||||||||||||||
| Estimated Impact | 208 | ||||||||||||||||||||||||||||||||||||||||
Tree of Dependent Computations | |||||||||||||||||||||||||||||||||||||||||
| Family? (F = Feedback message, R = changed R code, M = changed R Module, P = changed Parameters, D = changed Data) | |||||||||||||||||||||||||||||||||||||||||
| F [Univariate Data Series] [Niet werkende wer...] [2008-10-13 17:30:07] [5e9e099b83e50415d7642e10d74756e4] [Current] - RMP [Histogram] [Histogram vrouwel...] [2008-10-21 07:31:09] [deb3c14ac9e4607a6d84fc9d0e0e6cc2] F RMPD [Partial Correlation] [Partial Correlati...] [2008-11-11 19:49:25] [deb3c14ac9e4607a6d84fc9d0e0e6cc2] F D [Partial Correlation] [Partial Correlati...] [2008-11-11 19:56:04] [deb3c14ac9e4607a6d84fc9d0e0e6cc2] F RMPD [Hierarchical Clustering] [Hierarchical Clus...] [2008-11-11 20:56:26] [deb3c14ac9e4607a6d84fc9d0e0e6cc2] F RM D [Box-Cox Linearity Plot] [Box-Cox Linearity...] [2008-11-11 21:16:20] [deb3c14ac9e4607a6d84fc9d0e0e6cc2] F RM D [Box-Cox Normality Plot] [Box-Cox Normality...] [2008-11-11 21:26:55] [deb3c14ac9e4607a6d84fc9d0e0e6cc2] F RM [Maximum-likelihood Fitting - Normal Distribution] [Maximum-likelihoo...] [2008-11-11 21:28:51] [deb3c14ac9e4607a6d84fc9d0e0e6cc2] F PD [Maximum-likelihood Fitting - Normal Distribution] [] [2008-11-12 13:54:54] [8d2ae74f923b31b35e9e42977c3c4399] - PD [Maximum-likelihood Fitting - Normal Distribution] [Various EDA topic...] [2008-11-18 20:01:30] [82970caad4b026be9dd352fdec547fe4] - RM D [Box-Cox Linearity Plot] [Box-Cox Linearity...] [2008-11-11 21:18:29] [deb3c14ac9e4607a6d84fc9d0e0e6cc2] | |||||||||||||||||||||||||||||||||||||||||
| Feedback Forum | |||||||||||||||||||||||||||||||||||||||||
Post a new message | |||||||||||||||||||||||||||||||||||||||||
Dataset | |||||||||||||||||||||||||||||||||||||||||
| Dataseries X: | |||||||||||||||||||||||||||||||||||||||||
143119 140353 137149 138301 138709 138619 137528 134523 133593 135647 143541 144024 148607 148881 145447 144170 142148 142492 141703 139116 138461 139870 148703 150034 153670 147508 145150 143955 147608 144839 142096 138941 139093 141526 151492 155217 154530 148533 143923 141075 142261 140435 136169 136107 131063 127765 140731 145981 141834 137625 132515 131111 133603 132207 126488 125933 120927 122597 135437 138649 134576 | |||||||||||||||||||||||||||||||||||||||||
Tables (Output of Computation) | |||||||||||||||||||||||||||||||||||||||||
| |||||||||||||||||||||||||||||||||||||||||
Figures (Output of Computation) | |||||||||||||||||||||||||||||||||||||||||
Input Parameters & R Code | |||||||||||||||||||||||||||||||||||||||||
| Parameters (Session): | |||||||||||||||||||||||||||||||||||||||||
| par1 = Niet werkende werkzoekenden, vrouw, Waals gewest, Belgi� ; par2 = http://www.nbb.be/belgostat/PresentationLinker?TableId=217000021&Lang=N ; | |||||||||||||||||||||||||||||||||||||||||
| Parameters (R input): | |||||||||||||||||||||||||||||||||||||||||
| par1 = Niet werkende werkzoekenden, vrouw, Waals gewest, Belgi� ; par2 = http://www.nbb.be/belgostat/PresentationLinker?TableId=217000021&Lang=N ; par3 = ; | |||||||||||||||||||||||||||||||||||||||||
| R code (references can be found in the software module): | |||||||||||||||||||||||||||||||||||||||||
bitmap(file='test1.png') | |||||||||||||||||||||||||||||||||||||||||