Free Statistics

of Irreproducible Research!

Author's title

Author*Unverified author*
R Software Modulerwasp_babies.wasp
Title produced by softwareExercise 1.13
Date of computationMon, 13 Oct 2008 04:15:40 -0600
Cite this page as followsStatistical Computations at FreeStatistics.org, Office for Research Development and Education, URL https://freestatistics.org/blog/index.php?v=date/2008/Oct/13/t1223893222fy2k5cc16q1vwxn.htm/, Retrieved Sun, 19 May 2024 16:37:15 +0000
Statistical Computations at FreeStatistics.org, Office for Research Development and Education, URL https://freestatistics.org/blog/index.php?pk=15625, Retrieved Sun, 19 May 2024 16:37:15 +0000
QR Codes:

Original text written by user:
IsPrivate?No (this computation is public)
User-defined keywordsVraag 1: 60%
Estimated Impact159
Family? (F = Feedback message, R = changed R code, M = changed R Module, P = changed Parameters, D = changed Data)
F     [Exercise 1.13] [Exercise 1.13 (Wo...] [2008-10-01 13:28:34] [b98453cac15ba1066b407e146608df68]
F   P     [Exercise 1.13] [Exercise 1.13] [2008-10-13 10:15:40] [d2e7ed9b08467bcf35f072cd8cd6be16] [Current]
-   P       [Exercise 1.13] [EX 1.13 Vr 1 & 2 ...] [2008-10-19 13:37:03] [0996801648c22721e57e03a7deb595f2]
Feedback Forum
2008-10-17 12:32:06 [Christy Masson] [reply
de oplossing is slechts gebasseerd op 1 calculatie. Het zou juister zijn als er enkele calculaties gebeuren zodat de percentages kunnen worden vergeleken en kan worden vastgesteld dat de juiste oplossing tussen de laagste en hoogste waarde van de calculaties moet liggen.
2008-10-19 13:04:47 [Natascha Meeus] [reply
De student had de berekening beter meerdere malen uitgevoerd, zo had hij zijn oplossing op meerdere percentages kunnen baseren.
2008-10-19 13:28:59 [Olivier Uyttendaele] [reply
Student schreef voor vraag 1 en B: No, the population where the results are based on is too small to have an accurate result. Fifteen expected births per day is a very narrow population figure to base the results on. Every result, we compute, is different.
The number of expected births in the small hospital has to be changed. The more births, the more stabilized the results are. If we use a high number of expected births the result doesn’t fluctuate that much anymore just because the population on witch we base the results is now much bigger and more accurate


Mijn verbetering, Student heeft gelijk als hij het aantal waarnemingen wil verhogen om de nauwkeurigheid te verbeteren. Alleen verhoogt hij de foute parameter. Het aantal dagen dient verhoogt te worden om een constanter resultaat te bekomen. Bij het verhogen van het aantal geboortes wordt aan de vraagstelling geraakt.
Voorbeeld van een oplossing:
http://www.freestatistics.org/blog/index.php?v=date/2008/Oct/18/t122433098798n7i1pugfzklua.htm/
2008-10-19 13:43:00 [Olivier Uyttendaele] [reply
Gereproduceerde oplossing op basis van model student:
http://www.freestatistics.org/blog/index.php?v=date/2008/Oct/19/t12244234859x0iwepd04u53fn.htm

Zoals andere studenten al schreven, heeft student maar 1 calculatie uitgevoerd. Bij het uitvoeren van enkele calculaties zal hij de percentages kunnen vergelijken. Misschien heeft hij dit gedaan maar de modellen niet geblogt.
2008-10-20 11:02:27 [0da8ca6c46830c93169756afa1dc11e0] [reply
De eerste en tweede vraag zijn correct beantwoord. De derde vraag is net zoals bij velen wel juist maar verandert de opgave. In plaats van het verwachte aantal geboortes moet men het aantal dagen verhogen. Ik verwijs hier naar de wet van de grote getallen.

Post a new message


Summary of computational transaction
Raw Inputview raw input (R code)
Raw Outputview raw output of R engine
Computing time1 seconds
R Server'Gwilym Jenkins' @ 72.249.127.135

\begin{tabular}{lllllllll}
\hline
Summary of computational transaction \tabularnewline
Raw Input & view raw input (R code)  \tabularnewline
Raw Output & view raw output of R engine  \tabularnewline
Computing time & 1 seconds \tabularnewline
R Server & 'Gwilym Jenkins' @ 72.249.127.135 \tabularnewline
\hline
\end{tabular}
%Source: https://freestatistics.org/blog/index.php?pk=15625&T=0

[TABLE]
[ROW][C]Summary of computational transaction[/C][/ROW]
[ROW][C]Raw Input[/C][C]view raw input (R code) [/C][/ROW]
[ROW][C]Raw Output[/C][C]view raw output of R engine [/C][/ROW]
[ROW][C]Computing time[/C][C]1 seconds[/C][/ROW]
[ROW][C]R Server[/C][C]'Gwilym Jenkins' @ 72.249.127.135[/C][/ROW]
[/TABLE]
Source: https://freestatistics.org/blog/index.php?pk=15625&T=0

Globally Unique Identifier (entire table): ba.freestatistics.org/blog/index.php?pk=15625&T=0

As an alternative you can also use a QR Code:  

The GUIDs for individual cells are displayed in the table below:

Summary of computational transaction
Raw Inputview raw input (R code)
Raw Outputview raw output of R engine
Computing time1 seconds
R Server'Gwilym Jenkins' @ 72.249.127.135


Exercise 1.13 p. 14 (Introduction to Probability, 2nd ed.)
Number of simulated days365
Expected number of births in Large Hospital45
Expected number of births in Small Hospital15
Percentage of Male births per day(for which the probability is computed)0.6
#Females births in Large Hospital8208
#Males births in Large Hospital8217
#Female births in Small Hospital2728
#Male births in Small Hospital2747
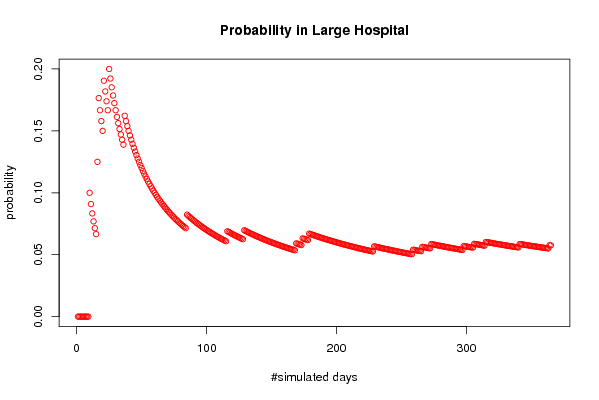
Probability of more than 60 % of male births in Large Hospital0.0575342465753425
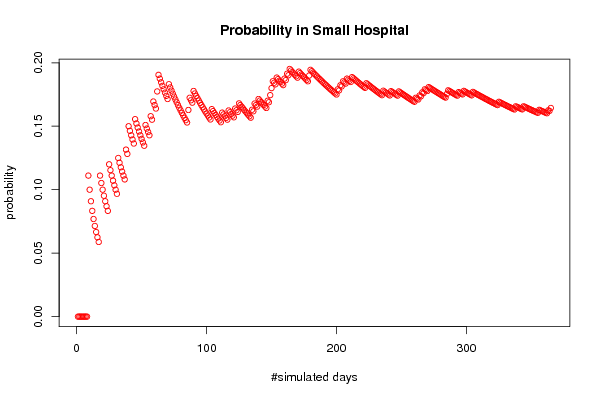
Probability of more than 60 % of male births in Small Hospital0.164383561643836
#Days per Year when more than 60 % of male births occur in Large Hospital21
#Days per Year when more than 60 % of male births occur in Small Hospital60

\begin{tabular}{lllllllll}
\hline
Exercise 1.13 p. 14 (Introduction to Probability, 2nd ed.) \tabularnewline
Number of simulated days & 365 \tabularnewline
Expected number of births in Large Hospital & 45 \tabularnewline
Expected number of births in Small Hospital & 15 \tabularnewline
Percentage of Male births per day(for which the probability is computed) & 0.6 \tabularnewline
#Females births in Large Hospital & 8208 \tabularnewline
#Males births in Large Hospital & 8217 \tabularnewline
#Female births in Small Hospital & 2728 \tabularnewline
#Male births in Small Hospital & 2747 \tabularnewline
Probability of more than 60 % of male births in Large Hospital & 0.0575342465753425 \tabularnewline
Probability of more than 60 % of male births in Small Hospital & 0.164383561643836 \tabularnewline
#Days per Year when more than 60 % of male births occur in Large Hospital & 21 \tabularnewline
#Days per Year when more than 60 % of male births occur in Small Hospital & 60 \tabularnewline
\hline
\end{tabular}
%Source: https://freestatistics.org/blog/index.php?pk=15625&T=1

[TABLE]
[ROW][C]Exercise 1.13 p. 14 (Introduction to Probability, 2nd ed.)[/C][/ROW]
[ROW][C]Number of simulated days[/C][C]365[/C][/ROW]
[ROW][C]Expected number of births in Large Hospital[/C][C]45[/C][/ROW]
[ROW][C]Expected number of births in Small Hospital[/C][C]15[/C][/ROW]
[ROW][C]Percentage of Male births per day(for which the probability is computed)[/C][C]0.6[/C][/ROW]
[ROW][C]#Females births in Large Hospital[/C][C]8208[/C][/ROW]
[ROW][C]#Males births in Large Hospital[/C][C]8217[/C][/ROW]
[ROW][C]#Female births in Small Hospital[/C][C]2728[/C][/ROW]
[ROW][C]#Male births in Small Hospital[/C][C]2747[/C][/ROW]
[ROW][C]Probability of more than 60 % of male births in Large Hospital[/C][C]0.0575342465753425[/C][/ROW]
[C]Probability of more than 60 % of male births in Small Hospital[/C][C]0.164383561643836[/C][/ROW]
[ROW][C]#Days per Year when more than 60 % of male births occur in Large Hospital[/C][C]21[/C][/ROW]
[C]#Days per Year when more than 60 % of male births occur in Small Hospital[/C][C]60[/C][/ROW]
[/TABLE]
Source: https://freestatistics.org/blog/index.php?pk=15625&T=1

Globally Unique Identifier (entire table): ba.freestatistics.org/blog/index.php?pk=15625&T=1

As an alternative you can also use a QR Code:  

The GUIDs for individual cells are displayed in the table below:

Exercise 1.13 p. 14 (Introduction to Probability, 2nd ed.)
Number of simulated days365
Expected number of births in Large Hospital45
Expected number of births in Small Hospital15
Percentage of Male births per day(for which the probability is computed)0.6
#Females births in Large Hospital8208
#Males births in Large Hospital8217
#Female births in Small Hospital2728
#Male births in Small Hospital2747
Probability of more than 60 % of male births in Large Hospital0.0575342465753425
Probability of more than 60 % of male births in Small Hospital0.164383561643836
#Days per Year when more than 60 % of male births occur in Large Hospital21
#Days per Year when more than 60 % of male births occur in Small Hospital60


Parameters (Session):
par1 = 365 ; par2 = 45 ; par3 = 15 ; par4 = 0.6 ;
Parameters (R input):
par1 = 365 ; par2 = 45 ; par3 = 15 ; par4 = 0.6 ; par5 = ; par6 = ; par7 = ; par8 = ; par9 = ; par10 = ; par11 = ; par12 = ; par13 = ; par14 = ; par15 = ; par16 = ; par17 = ; par18 = ; par19 = ; par20 = ;
R code (references can be found in the software module):
par1 <- as.numeric(par1)
par2 <- as.numeric(par2)
par3 <- as.numeric(par3)
par4 <- as.numeric(par4)
numsuccessbig <- 0
numsuccesssmall <- 0
bighospital <- array(NA,dim=c(par1,par2))
smallhospital <- array(NA,dim=c(par1,par3))
bigprob <- array(NA,dim=par1)
smallprob <- array(NA,dim=par1)
for (i in 1:par1) {
bighospital[i,] <- sample(c('F','M'),par2,replace=TRUE)
if (as.matrix(table(bighospital[i,]))[2] > par4*par2) numsuccessbig = numsuccessbig + 1
bigprob[i] <- numsuccessbig/i
smallhospital[i,] <- sample(c('F','M'),par3,replace=TRUE)
if (as.matrix(table(smallhospital[i,]))[2] > par4*par3) numsuccesssmall = numsuccesssmall + 1
smallprob[i] <- numsuccesssmall/i
}
tbig <- as.matrix(table(bighospital))
tsmall <- as.matrix(table(smallhospital))
tbig
tsmall
numsuccessbig/par1
bigprob[par1]
numsuccesssmall/par1
smallprob[par1]
numsuccessbig/par1*365
bigprob[par1]*365
numsuccesssmall/par1*365
smallprob[par1]*365
bitmap(file='test1.png')
plot(bigprob,col=2,main='Probability in Large Hospital',xlab='#simulated days',ylab='probability')
dev.off()
bitmap(file='test2.png')
plot(smallprob,col=2,main='Probability in Small Hospital',xlab='#simulated days',ylab='probability')
dev.off()
load(file='createtable')
a<-table.start()
a<-table.row.start(a)
a<-table.element(a,'Exercise 1.13 p. 14 (Introduction to Probability, 2nd ed.)',2,TRUE)
a<-table.row.end(a)
a<-table.row.start(a)
a<-table.element(a,'Number of simulated days',header=TRUE)
a<-table.element(a,par1)
a<-table.row.end(a)
a<-table.row.start(a)
a<-table.element(a,'Expected number of births in Large Hospital',header=TRUE)
a<-table.element(a,par2)
a<-table.row.end(a)
a<-table.row.start(a)
a<-table.element(a,'Expected number of births in Small Hospital',header=TRUE)
a<-table.element(a,par3)
a<-table.row.end(a)
a<-table.row.start(a)
a<-table.element(a,'Percentage of Male births per day
(for which the probability is computed)',header=TRUE)
a<-table.element(a,par4)
a<-table.row.end(a)
a<-table.row.start(a)
a<-table.element(a,'#Females births in Large Hospital',header=TRUE)
a<-table.element(a,tbig[1])
a<-table.row.end(a)
a<-table.row.start(a)
a<-table.element(a,'#Males births in Large Hospital',header=TRUE)
a<-table.element(a,tbig[2])
a<-table.row.end(a)
a<-table.row.start(a)
a<-table.element(a,'#Female births in Small Hospital',header=TRUE)
a<-table.element(a,tsmall[1])
a<-table.row.end(a)
a<-table.row.start(a)
a<-table.element(a,'#Male births in Small Hospital',header=TRUE)
a<-table.element(a,tsmall[2])
a<-table.row.end(a)
a<-table.row.start(a)
dum1 <- paste('Probability of more than', par4*100, sep=' ')
dum <- paste(dum1, '% of male births in Large Hospital', sep=' ')
a<-table.element(a, dum, header=TRUE)
a<-table.element(a, bigprob[par1])
a<-table.row.end(a)
dum <- paste(dum1, '% of male births in Small Hospital', sep=' ')
a<-table.element(a, dum, header=TRUE)
a<-table.element(a, smallprob[par1])
a<-table.row.end(a)
a<-table.row.start(a)
dum1 <- paste('#Days per Year when more than', par4*100, sep=' ')
dum <- paste(dum1, '% of male births occur in Large Hospital', sep=' ')
a<-table.element(a, dum, header=TRUE)
a<-table.element(a, bigprob[par1]*365)
a<-table.row.end(a)
dum <- paste(dum1, '% of male births occur in Small Hospital', sep=' ')
a<-table.element(a, dum, header=TRUE)
a<-table.element(a, smallprob[par1]*365)
a<-table.row.end(a)
a<-table.end(a)
table.save(a,file='mytable.tab')