Free Statistics

of Irreproducible Research!

Author's title

Author*Unverified author*
R Software Modulerwasp_babies.wasp
Title produced by softwareExercise 1.13
Date of computationMon, 13 Oct 2008 03:43:07 -0600
Cite this page as followsStatistical Computations at FreeStatistics.org, Office for Research Development and Education, URL https://freestatistics.org/blog/index.php?v=date/2008/Oct/13/t1223891066wgfe0sylsljmtp2.htm/, Retrieved Sun, 19 May 2024 16:28:52 +0000
Statistical Computations at FreeStatistics.org, Office for Research Development and Education, URL https://freestatistics.org/blog/index.php?pk=15603, Retrieved Sun, 19 May 2024 16:28:52 +0000
QR Codes:

Original text written by user:
IsPrivate?No (this computation is public)
User-defined keywords
Estimated Impact194
Family? (F = Feedback message, R = changed R code, M = changed R Module, P = changed Parameters, D = changed Data)
F     [Exercise 1.13] [Exercise 1.13 (Wo...] [2008-10-01 13:28:34] [b98453cac15ba1066b407e146608df68]
F   P     [Exercise 1.13] [Exercise 1.13] [2008-10-13 09:43:07] [d41d8cd98f00b204e9800998ecf8427e] [Current]
Feedback Forum
2008-10-15 15:22:51 [Gert De la Haye] [reply
je hebt gelijk over de accuracy die bijna stabiel blijft, als het juiste antwoord niet in de les was gezegd geweest had ik dit volledig juist gerekend!
2008-10-17 09:06:42 [90714a39acc78a7b2ecd294ecc6b2864] [reply
De parameter die moet veranderd worden is het aantal gesimuleerde dagen ipv het aantal verwachte geboortes in het kleine ziekenhuis. Het aantal geboortes in de ziekenhuizen zijn twee vaststaande gegevens die niet gewijzigd mogen worden, anders verandert de opdracht. In de opdracht wordt er één jaar gesimuleerd maar elk jaar bekom je andere random getallen. Het is dus aangewezen om meer simulaties uit te voeren zodat het resultaat nauwkeuriger wordt. Je kan bijvoorbeeld enkel simuleren voor vijf jaar of voor vijf tot en met tien jaar en de resultaten onder elkaar weergeven.
2008-10-17 11:33:53 [Kim Wester] [reply
Om de nauwkeurigheid van de berekening te verhogen moet de parameter 'dagen' aangepast worden i.p.v. het aantal verwachte geboortes in het kleine ziekenhuis. De wet van de grote getallen is hierop van toepassing --> hoe groter de tijdspanne hoe groter de nauwkeurigheid.
2008-10-17 12:57:48 [Christy Masson] [reply
hier kan ik mij bij aansluiten, de paramter die dient gewijzigd te worden zijn het aantal dagen
2008-10-18 18:27:35 [Astrid Sniekers] [reply
Uitleg oplossing c:
De student heeft gelijk als hij of zij zegt dat de nauwkeurigheid gaat toenemen door het verwachte aantal geboortes in het kleine ziekenhuis te verhogen. Dit is echter een wijziging van de opdracht en hierdoor niet correct. De student heeft spijtig genoeg niet gedacht om het aantal dagen te verhogen. Hij of zij had de berekening een aantal keer over een grotere tijdspanne (bv. 3650 dagen = 10 jaar) moeten uitvoeren. De wet van de grote getallen zegt namelijk dat hoe meer simulaties u doet, hoe nauwkeuriger uw resultaat wordt.
2008-10-19 16:57:15 [Bonifer Spillemaeckers] [reply
De student baseert zich op aantal geboortes. Zij verhoogt de parameter (aantal geboortes) om een stabieler resultaat te verkrijgen, maar deze parameter kunnen we niet zomaar veranderen. Immers niemand heeft in de hand hoeveel geboortes er per dag plaatsvinden. Het aantal dagen waarop we de metingen gaan toepassen is een parameter die wel kan aangepast worden om een accuratere oplossing te bekomen.

Post a new message


Summary of computational transaction
Raw Inputview raw input (R code)
Raw Outputview raw output of R engine
Computing time2 seconds
R Server'Gwilym Jenkins' @ 72.249.127.135

\begin{tabular}{lllllllll}
\hline
Summary of computational transaction \tabularnewline
Raw Input & view raw input (R code)  \tabularnewline
Raw Output & view raw output of R engine  \tabularnewline
Computing time & 2 seconds \tabularnewline
R Server & 'Gwilym Jenkins' @ 72.249.127.135 \tabularnewline
\hline
\end{tabular}
%Source: https://freestatistics.org/blog/index.php?pk=15603&T=0

[TABLE]
[ROW][C]Summary of computational transaction[/C][/ROW]
[ROW][C]Raw Input[/C][C]view raw input (R code) [/C][/ROW]
[ROW][C]Raw Output[/C][C]view raw output of R engine [/C][/ROW]
[ROW][C]Computing time[/C][C]2 seconds[/C][/ROW]
[ROW][C]R Server[/C][C]'Gwilym Jenkins' @ 72.249.127.135[/C][/ROW]
[/TABLE]
Source: https://freestatistics.org/blog/index.php?pk=15603&T=0

Globally Unique Identifier (entire table): ba.freestatistics.org/blog/index.php?pk=15603&T=0

As an alternative you can also use a QR Code:  

The GUIDs for individual cells are displayed in the table below:

Summary of computational transaction
Raw Inputview raw input (R code)
Raw Outputview raw output of R engine
Computing time2 seconds
R Server'Gwilym Jenkins' @ 72.249.127.135


Exercise 1.13 p. 14 (Introduction to Probability, 2nd ed.)
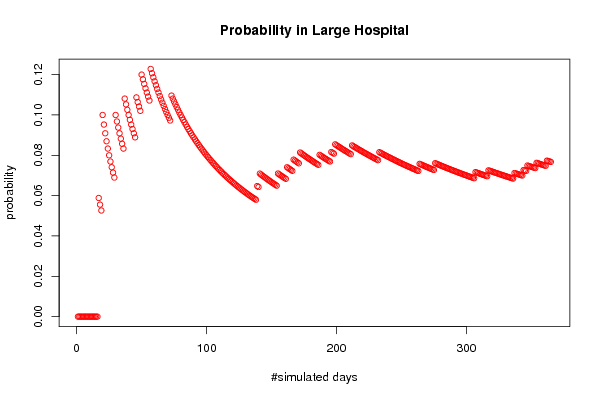
Number of simulated days365
Expected number of births in Large Hospital45
Expected number of births in Small Hospital40
Percentage of Male births per day(for which the probability is computed)0.6
#Females births in Large Hospital8168
#Males births in Large Hospital8257
#Female births in Small Hospital7366
#Male births in Small Hospital7234
Probability of more than 60 % of male births in Large Hospital0.0767123287671233
Probability of more than 60 % of male births in Small Hospital0.084931506849315
#Days per Year when more than 60 % of male births occur in Large Hospital28
#Days per Year when more than 60 % of male births occur in Small Hospital31

\begin{tabular}{lllllllll}
\hline
Exercise 1.13 p. 14 (Introduction to Probability, 2nd ed.) \tabularnewline
Number of simulated days & 365 \tabularnewline
Expected number of births in Large Hospital & 45 \tabularnewline
Expected number of births in Small Hospital & 40 \tabularnewline
Percentage of Male births per day(for which the probability is computed) & 0.6 \tabularnewline
#Females births in Large Hospital & 8168 \tabularnewline
#Males births in Large Hospital & 8257 \tabularnewline
#Female births in Small Hospital & 7366 \tabularnewline
#Male births in Small Hospital & 7234 \tabularnewline
Probability of more than 60 % of male births in Large Hospital & 0.0767123287671233 \tabularnewline
Probability of more than 60 % of male births in Small Hospital & 0.084931506849315 \tabularnewline
#Days per Year when more than 60 % of male births occur in Large Hospital & 28 \tabularnewline
#Days per Year when more than 60 % of male births occur in Small Hospital & 31 \tabularnewline
\hline
\end{tabular}
%Source: https://freestatistics.org/blog/index.php?pk=15603&T=1

[TABLE]
[ROW][C]Exercise 1.13 p. 14 (Introduction to Probability, 2nd ed.)[/C][/ROW]
[ROW][C]Number of simulated days[/C][C]365[/C][/ROW]
[ROW][C]Expected number of births in Large Hospital[/C][C]45[/C][/ROW]
[ROW][C]Expected number of births in Small Hospital[/C][C]40[/C][/ROW]
[ROW][C]Percentage of Male births per day(for which the probability is computed)[/C][C]0.6[/C][/ROW]
[ROW][C]#Females births in Large Hospital[/C][C]8168[/C][/ROW]
[ROW][C]#Males births in Large Hospital[/C][C]8257[/C][/ROW]
[ROW][C]#Female births in Small Hospital[/C][C]7366[/C][/ROW]
[ROW][C]#Male births in Small Hospital[/C][C]7234[/C][/ROW]
[ROW][C]Probability of more than 60 % of male births in Large Hospital[/C][C]0.0767123287671233[/C][/ROW]
[C]Probability of more than 60 % of male births in Small Hospital[/C][C]0.084931506849315[/C][/ROW]
[ROW][C]#Days per Year when more than 60 % of male births occur in Large Hospital[/C][C]28[/C][/ROW]
[C]#Days per Year when more than 60 % of male births occur in Small Hospital[/C][C]31[/C][/ROW]
[/TABLE]
Source: https://freestatistics.org/blog/index.php?pk=15603&T=1

Globally Unique Identifier (entire table): ba.freestatistics.org/blog/index.php?pk=15603&T=1

As an alternative you can also use a QR Code:  

The GUIDs for individual cells are displayed in the table below:

Exercise 1.13 p. 14 (Introduction to Probability, 2nd ed.)
Number of simulated days365
Expected number of births in Large Hospital45
Expected number of births in Small Hospital40
Percentage of Male births per day(for which the probability is computed)0.6
#Females births in Large Hospital8168
#Males births in Large Hospital8257
#Female births in Small Hospital7366
#Male births in Small Hospital7234
Probability of more than 60 % of male births in Large Hospital0.0767123287671233
Probability of more than 60 % of male births in Small Hospital0.084931506849315
#Days per Year when more than 60 % of male births occur in Large Hospital28
#Days per Year when more than 60 % of male births occur in Small Hospital31


Parameters (Session):
par1 = 365 ; par2 = 45 ; par3 = 40 ; par4 = 0.6 ;
Parameters (R input):
par1 = 365 ; par2 = 45 ; par3 = 40 ; par4 = 0.6 ;
R code (references can be found in the software module):
par1 <- as.numeric(par1)
par2 <- as.numeric(par2)
par3 <- as.numeric(par3)
par4 <- as.numeric(par4)
numsuccessbig <- 0
numsuccesssmall <- 0
bighospital <- array(NA,dim=c(par1,par2))
smallhospital <- array(NA,dim=c(par1,par3))
bigprob <- array(NA,dim=par1)
smallprob <- array(NA,dim=par1)
for (i in 1:par1) {
bighospital[i,] <- sample(c('F','M'),par2,replace=TRUE)
if (as.matrix(table(bighospital[i,]))[2] > par4*par2) numsuccessbig = numsuccessbig + 1
bigprob[i] <- numsuccessbig/i
smallhospital[i,] <- sample(c('F','M'),par3,replace=TRUE)
if (as.matrix(table(smallhospital[i,]))[2] > par4*par3) numsuccesssmall = numsuccesssmall + 1
smallprob[i] <- numsuccesssmall/i
}
tbig <- as.matrix(table(bighospital))
tsmall <- as.matrix(table(smallhospital))
tbig
tsmall
numsuccessbig/par1
bigprob[par1]
numsuccesssmall/par1
smallprob[par1]
numsuccessbig/par1*365
bigprob[par1]*365
numsuccesssmall/par1*365
smallprob[par1]*365
bitmap(file='test1.png')
plot(bigprob,col=2,main='Probability in Large Hospital',xlab='#simulated days',ylab='probability')
dev.off()
bitmap(file='test2.png')
plot(smallprob,col=2,main='Probability in Small Hospital',xlab='#simulated days',ylab='probability')
dev.off()
load(file='createtable')
a<-table.start()
a<-table.row.start(a)
a<-table.element(a,'Exercise 1.13 p. 14 (Introduction to Probability, 2nd ed.)',2,TRUE)
a<-table.row.end(a)
a<-table.row.start(a)
a<-table.element(a,'Number of simulated days',header=TRUE)
a<-table.element(a,par1)
a<-table.row.end(a)
a<-table.row.start(a)
a<-table.element(a,'Expected number of births in Large Hospital',header=TRUE)
a<-table.element(a,par2)
a<-table.row.end(a)
a<-table.row.start(a)
a<-table.element(a,'Expected number of births in Small Hospital',header=TRUE)
a<-table.element(a,par3)
a<-table.row.end(a)
a<-table.row.start(a)
a<-table.element(a,'Percentage of Male births per day
(for which the probability is computed)',header=TRUE)
a<-table.element(a,par4)
a<-table.row.end(a)
a<-table.row.start(a)
a<-table.element(a,'#Females births in Large Hospital',header=TRUE)
a<-table.element(a,tbig[1])
a<-table.row.end(a)
a<-table.row.start(a)
a<-table.element(a,'#Males births in Large Hospital',header=TRUE)
a<-table.element(a,tbig[2])
a<-table.row.end(a)
a<-table.row.start(a)
a<-table.element(a,'#Female births in Small Hospital',header=TRUE)
a<-table.element(a,tsmall[1])
a<-table.row.end(a)
a<-table.row.start(a)
a<-table.element(a,'#Male births in Small Hospital',header=TRUE)
a<-table.element(a,tsmall[2])
a<-table.row.end(a)
a<-table.row.start(a)
dum1 <- paste('Probability of more than', par4*100, sep=' ')
dum <- paste(dum1, '% of male births in Large Hospital', sep=' ')
a<-table.element(a, dum, header=TRUE)
a<-table.element(a, bigprob[par1])
a<-table.row.end(a)
dum <- paste(dum1, '% of male births in Small Hospital', sep=' ')
a<-table.element(a, dum, header=TRUE)
a<-table.element(a, smallprob[par1])
a<-table.row.end(a)
a<-table.row.start(a)
dum1 <- paste('#Days per Year when more than', par4*100, sep=' ')
dum <- paste(dum1, '% of male births occur in Large Hospital', sep=' ')
a<-table.element(a, dum, header=TRUE)
a<-table.element(a, bigprob[par1]*365)
a<-table.row.end(a)
dum <- paste(dum1, '% of male births occur in Small Hospital', sep=' ')
a<-table.element(a, dum, header=TRUE)
a<-table.element(a, smallprob[par1]*365)
a<-table.row.end(a)
a<-table.end(a)
table.save(a,file='mytable.tab')