Free Statistics

of Irreproducible Research!

Author's title

Author*The author of this computation has been verified*
R Software Modulerwasp_babies.wasp
Title produced by softwareExercise 1.13
Date of computationMon, 13 Oct 2008 02:45:11 -0600
Cite this page as followsStatistical Computations at FreeStatistics.org, Office for Research Development and Education, URL https://freestatistics.org/blog/index.php?v=date/2008/Oct/13/t1223887638ydmwi18ken0of5b.htm/, Retrieved Sun, 19 May 2024 16:35:15 +0000
Statistical Computations at FreeStatistics.org, Office for Research Development and Education, URL https://freestatistics.org/blog/index.php?pk=15578, Retrieved Sun, 19 May 2024 16:35:15 +0000
QR Codes:

Original text written by user:
IsPrivate?No (this computation is public)
User-defined keywordsgrafieken waar de geboorten van jongens meer is dan 60% bij de grootst mogelijke steekproef
Estimated Impact177
Family? (F = Feedback message, R = changed R code, M = changed R Module, P = changed Parameters, D = changed Data)
F       [Exercise 1.13] [Grafieken 60%, gr...] [2008-10-13 08:45:11] [28deb8481dba3cc87d2d53a86e0e0d0b] [Current]
Feedback Forum
2008-10-16 16:33:09 [Ken Van den Heuvel] [reply
Je hebt bij deze reproductie het aantal geboortes gemaximaliseerd teneinde de nauwkeurigheid van de berekening te vergroten.

Merk op da het verkregen resultaat (7,9%) toch wel sterk afwijkt van de initieel gegeven 16,4% ... door het aantal geboortes te vergroten verbeter je immers niet te nauwkeurigheid, maar pas je in wezen de vraag aan. Je wijst nu een nieuw aantal geboortes aan ieder ziekenhuis toe, dus in principe bestudeer je dan de kans in 2 nieuwe ziekenhuizen en niet in de 2 originele uit de vraagstelling.

Ik zou volgende keer een aantal keren meer reproduceren en ook wat 'spelen' met de parameters zodat je de verschillende effecten hiervan kan zien op het resultaat.
2008-10-17 12:49:35 [Julie Leurentop] [reply
De parameter die ,volgens de vraag die gesteld werd, veranderd moest worden is het 'aantal dagen' ipv het aantal geboorten in beide ziekenhuizen. Aangezien er in jou berekening 2 parameters volledig gewijzigd zijn begin je een vergelijking te maken voor 2 andere ziekenhuizen.

Je kon beter enkele reproducties maken met de eigenlijke ingegeven parameters en zo zou je reeds opmerken dat de gegeven oplossing (16,438%) niet accuraat is. De oplossingen die je uit de simulaties zou verkrijgen variëren wel (door de random generator), maar zeker niet zo sterk als de oplossing 7,9% die jij vond.

Daarna kon je nog even het resultaat testen bij bv. 2 jaar ipv 1 jaar want hoe meer jaren, hoe accurater de oplossing.
2008-10-17 14:31:56 [Tom Ardies] [reply
Deze link staat bij vraag 1 (en hoort waarschijnlijk bij vraag 2) en je had de nauwkeurigheid op deze vraag kunnen aantonen door de oplossing enkele malen te reproduceren in volgende link van Professor Wessa: http://www.freestatistics.org/blog/index.php?v=date/2008/Oct/01/t1222867750ippdfjhbtfyawkc.htm/

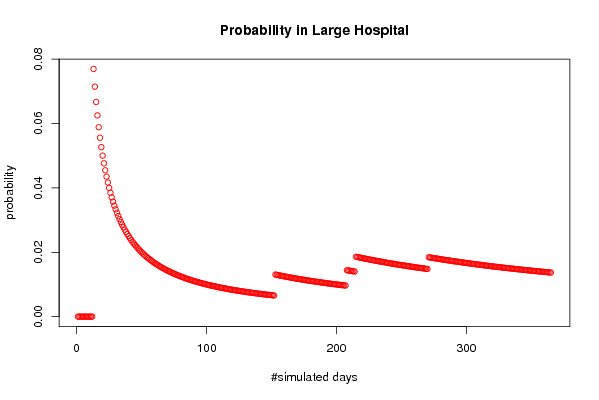
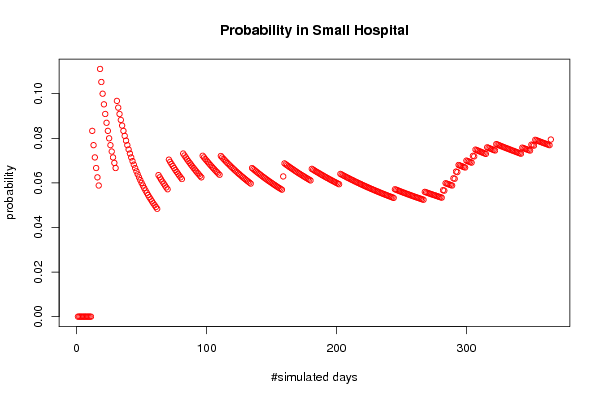
Om de nauwkeurigheid te vergroten zoals in vraag 2 gevraagd, moest je namelijk de tijd aanpassen. Je kan dit zien als je naar de grafiek kijkt. Hoe verder in de tijd hoe minder uitschieters er zullen zijn.
2008-10-18 15:35:27 [Hidde Van Kerckhoven] [reply
Zoals hierboven al vermeld, was het inderdaad de bedoeling parameter dagen aan te passen. Wanneer je het aantal geboortes aanpast, ga je de vraag veranderen... Je krijgt een gans nieuwe situatie.
2008-10-20 14:55:40 [Siem Van Opstal] [reply
fout antwoord. nu heb ik drie keer berekend hoe groot de kans is dat er meer dan 60% jongens geboren worden in een klein ziekenhuis. ik komt uit op een verschil van 3% en dat is niet nauwkeurig. http://www.freestatistics.org/blog/date/2008/Oct/18/t12243421070ormh8cijwzqawr.htm
http://www.freestatistics.org/blog/date/2008/Oct/18/t1224342199sap2lqvju9s2j82.htm
http://www.freestatistics.org/blog/date/2008/Oct/18/t12243423307ds2o6espzvl8v8.htm


Post a new message


Summary of computational transaction
Raw Inputview raw input (R code)
Raw Outputview raw output of R engine
Computing time2 seconds
R Server'Gwilym Jenkins' @ 72.249.127.135

\begin{tabular}{lllllllll}
\hline
Summary of computational transaction \tabularnewline
Raw Input & view raw input (R code)  \tabularnewline
Raw Output & view raw output of R engine  \tabularnewline
Computing time & 2 seconds \tabularnewline
R Server & 'Gwilym Jenkins' @ 72.249.127.135 \tabularnewline
\hline
\end{tabular}
%Source: https://freestatistics.org/blog/index.php?pk=15578&T=0

[TABLE]
[ROW][C]Summary of computational transaction[/C][/ROW]
[ROW][C]Raw Input[/C][C]view raw input (R code) [/C][/ROW]
[ROW][C]Raw Output[/C][C]view raw output of R engine [/C][/ROW]
[ROW][C]Computing time[/C][C]2 seconds[/C][/ROW]
[ROW][C]R Server[/C][C]'Gwilym Jenkins' @ 72.249.127.135[/C][/ROW]
[/TABLE]
Source: https://freestatistics.org/blog/index.php?pk=15578&T=0

Globally Unique Identifier (entire table): ba.freestatistics.org/blog/index.php?pk=15578&T=0

As an alternative you can also use a QR Code:  

The GUIDs for individual cells are displayed in the table below:

Summary of computational transaction
Raw Inputview raw input (R code)
Raw Outputview raw output of R engine
Computing time2 seconds
R Server'Gwilym Jenkins' @ 72.249.127.135


Exercise 1.13 p. 14 (Introduction to Probability, 2nd ed.)
Number of simulated days365
Expected number of births in Large Hospital110
Expected number of births in Small Hospital40
Percentage of Male births per day(for which the probability is computed)0.6
#Females births in Large Hospital19939
#Males births in Large Hospital20211
#Female births in Small Hospital7307
#Male births in Small Hospital7293
Probability of more than 60 % of male births in Large Hospital0.0136986301369863
Probability of more than 60 % of male births in Small Hospital0.0794520547945206
#Days per Year when more than 60 % of male births occur in Large Hospital5
#Days per Year when more than 60 % of male births occur in Small Hospital29

\begin{tabular}{lllllllll}
\hline
Exercise 1.13 p. 14 (Introduction to Probability, 2nd ed.) \tabularnewline
Number of simulated days & 365 \tabularnewline
Expected number of births in Large Hospital & 110 \tabularnewline
Expected number of births in Small Hospital & 40 \tabularnewline
Percentage of Male births per day(for which the probability is computed) & 0.6 \tabularnewline
#Females births in Large Hospital & 19939 \tabularnewline
#Males births in Large Hospital & 20211 \tabularnewline
#Female births in Small Hospital & 7307 \tabularnewline
#Male births in Small Hospital & 7293 \tabularnewline
Probability of more than 60 % of male births in Large Hospital & 0.0136986301369863 \tabularnewline
Probability of more than 60 % of male births in Small Hospital & 0.0794520547945206 \tabularnewline
#Days per Year when more than 60 % of male births occur in Large Hospital & 5 \tabularnewline
#Days per Year when more than 60 % of male births occur in Small Hospital & 29 \tabularnewline
\hline
\end{tabular}
%Source: https://freestatistics.org/blog/index.php?pk=15578&T=1

[TABLE]
[ROW][C]Exercise 1.13 p. 14 (Introduction to Probability, 2nd ed.)[/C][/ROW]
[ROW][C]Number of simulated days[/C][C]365[/C][/ROW]
[ROW][C]Expected number of births in Large Hospital[/C][C]110[/C][/ROW]
[ROW][C]Expected number of births in Small Hospital[/C][C]40[/C][/ROW]
[ROW][C]Percentage of Male births per day(for which the probability is computed)[/C][C]0.6[/C][/ROW]
[ROW][C]#Females births in Large Hospital[/C][C]19939[/C][/ROW]
[ROW][C]#Males births in Large Hospital[/C][C]20211[/C][/ROW]
[ROW][C]#Female births in Small Hospital[/C][C]7307[/C][/ROW]
[ROW][C]#Male births in Small Hospital[/C][C]7293[/C][/ROW]
[ROW][C]Probability of more than 60 % of male births in Large Hospital[/C][C]0.0136986301369863[/C][/ROW]
[C]Probability of more than 60 % of male births in Small Hospital[/C][C]0.0794520547945206[/C][/ROW]
[ROW][C]#Days per Year when more than 60 % of male births occur in Large Hospital[/C][C]5[/C][/ROW]
[C]#Days per Year when more than 60 % of male births occur in Small Hospital[/C][C]29[/C][/ROW]
[/TABLE]
Source: https://freestatistics.org/blog/index.php?pk=15578&T=1

Globally Unique Identifier (entire table): ba.freestatistics.org/blog/index.php?pk=15578&T=1

As an alternative you can also use a QR Code:  

The GUIDs for individual cells are displayed in the table below:

Exercise 1.13 p. 14 (Introduction to Probability, 2nd ed.)
Number of simulated days365
Expected number of births in Large Hospital110
Expected number of births in Small Hospital40
Percentage of Male births per day(for which the probability is computed)0.6
#Females births in Large Hospital19939
#Males births in Large Hospital20211
#Female births in Small Hospital7307
#Male births in Small Hospital7293
Probability of more than 60 % of male births in Large Hospital0.0136986301369863
Probability of more than 60 % of male births in Small Hospital0.0794520547945206
#Days per Year when more than 60 % of male births occur in Large Hospital5
#Days per Year when more than 60 % of male births occur in Small Hospital29


Parameters (Session):
par1 = 365 ; par2 = 110 ; par3 = 40 ; par4 = 0.6 ;
Parameters (R input):
par1 = 365 ; par2 = 110 ; par3 = 40 ; par4 = 0.6 ;
R code (references can be found in the software module):
par1 <- as.numeric(par1)
par2 <- as.numeric(par2)
par3 <- as.numeric(par3)
par4 <- as.numeric(par4)
numsuccessbig <- 0
numsuccesssmall <- 0
bighospital <- array(NA,dim=c(par1,par2))
smallhospital <- array(NA,dim=c(par1,par3))
bigprob <- array(NA,dim=par1)
smallprob <- array(NA,dim=par1)
for (i in 1:par1) {
bighospital[i,] <- sample(c('F','M'),par2,replace=TRUE)
if (as.matrix(table(bighospital[i,]))[2] > par4*par2) numsuccessbig = numsuccessbig + 1
bigprob[i] <- numsuccessbig/i
smallhospital[i,] <- sample(c('F','M'),par3,replace=TRUE)
if (as.matrix(table(smallhospital[i,]))[2] > par4*par3) numsuccesssmall = numsuccesssmall + 1
smallprob[i] <- numsuccesssmall/i
}
tbig <- as.matrix(table(bighospital))
tsmall <- as.matrix(table(smallhospital))
tbig
tsmall
numsuccessbig/par1
bigprob[par1]
numsuccesssmall/par1
smallprob[par1]
numsuccessbig/par1*365
bigprob[par1]*365
numsuccesssmall/par1*365
smallprob[par1]*365
bitmap(file='test1.png')
plot(bigprob,col=2,main='Probability in Large Hospital',xlab='#simulated days',ylab='probability')
dev.off()
bitmap(file='test2.png')
plot(smallprob,col=2,main='Probability in Small Hospital',xlab='#simulated days',ylab='probability')
dev.off()
load(file='createtable')
a<-table.start()
a<-table.row.start(a)
a<-table.element(a,'Exercise 1.13 p. 14 (Introduction to Probability, 2nd ed.)',2,TRUE)
a<-table.row.end(a)
a<-table.row.start(a)
a<-table.element(a,'Number of simulated days',header=TRUE)
a<-table.element(a,par1)
a<-table.row.end(a)
a<-table.row.start(a)
a<-table.element(a,'Expected number of births in Large Hospital',header=TRUE)
a<-table.element(a,par2)
a<-table.row.end(a)
a<-table.row.start(a)
a<-table.element(a,'Expected number of births in Small Hospital',header=TRUE)
a<-table.element(a,par3)
a<-table.row.end(a)
a<-table.row.start(a)
a<-table.element(a,'Percentage of Male births per day
(for which the probability is computed)',header=TRUE)
a<-table.element(a,par4)
a<-table.row.end(a)
a<-table.row.start(a)
a<-table.element(a,'#Females births in Large Hospital',header=TRUE)
a<-table.element(a,tbig[1])
a<-table.row.end(a)
a<-table.row.start(a)
a<-table.element(a,'#Males births in Large Hospital',header=TRUE)
a<-table.element(a,tbig[2])
a<-table.row.end(a)
a<-table.row.start(a)
a<-table.element(a,'#Female births in Small Hospital',header=TRUE)
a<-table.element(a,tsmall[1])
a<-table.row.end(a)
a<-table.row.start(a)
a<-table.element(a,'#Male births in Small Hospital',header=TRUE)
a<-table.element(a,tsmall[2])
a<-table.row.end(a)
a<-table.row.start(a)
dum1 <- paste('Probability of more than', par4*100, sep=' ')
dum <- paste(dum1, '% of male births in Large Hospital', sep=' ')
a<-table.element(a, dum, header=TRUE)
a<-table.element(a, bigprob[par1])
a<-table.row.end(a)
dum <- paste(dum1, '% of male births in Small Hospital', sep=' ')
a<-table.element(a, dum, header=TRUE)
a<-table.element(a, smallprob[par1])
a<-table.row.end(a)
a<-table.row.start(a)
dum1 <- paste('#Days per Year when more than', par4*100, sep=' ')
dum <- paste(dum1, '% of male births occur in Large Hospital', sep=' ')
a<-table.element(a, dum, header=TRUE)
a<-table.element(a, bigprob[par1]*365)
a<-table.row.end(a)
dum <- paste(dum1, '% of male births occur in Small Hospital', sep=' ')
a<-table.element(a, dum, header=TRUE)
a<-table.element(a, smallprob[par1]*365)
a<-table.row.end(a)
a<-table.end(a)
table.save(a,file='mytable.tab')