Free Statistics

of Irreproducible Research!

Author's title

Author*The author of this computation has been verified*
R Software Modulerwasp_babies.wasp
Title produced by softwareExercise 1.13
Date of computationMon, 13 Oct 2008 02:03:43 -0600
Cite this page as followsStatistical Computations at FreeStatistics.org, Office for Research Development and Education, URL https://freestatistics.org/blog/index.php?v=date/2008/Oct/13/t1223885241he6xzui0kwpipyq.htm/, Retrieved Sun, 19 May 2024 15:23:15 +0000
Statistical Computations at FreeStatistics.org, Office for Research Development and Education, URL https://freestatistics.org/blog/index.php?pk=15568, Retrieved Sun, 19 May 2024 15:23:15 +0000
QR Codes:

Original text written by user:
IsPrivate?No (this computation is public)
User-defined keywords
Estimated Impact190
Family? (F = Feedback message, R = changed R code, M = changed R Module, P = changed Parameters, D = changed Data)
F     [Exercise 1.13] [Exercise 1.13 (Wo...] [2008-10-01 13:28:34] [b98453cac15ba1066b407e146608df68]
F   P     [Exercise 1.13] [Herberekening 60%] [2008-10-13 08:03:43] [54ae75b68e6a45c6d55fa4235827d5b3] [Current]
-           [Exercise 1.13] [Herberekening 60%] [2008-10-13 15:31:30] [4396f984ebeab43316cd6baa88a4fd40]
Feedback Forum
2008-10-17 09:07:54 [Jan Helsen] [reply
Zoals opgegeven heeft de student de berekening opnieuw gemaakt. Dit heeft ze een enkele keren gedaan om tot een correcte conclusie te komen (dat de resultaten niet heel nauwkeurig zijn).

Alle parameters werden correct ingevuld en ook de manier van reproducen is op een correcte wijze gebeurd. De student heeft haar berekeningen ook op een correcte manier geblogd zodat je direct weet van wie de berekening is.

Een eventuele opmerking die ik kan maken is de titel/omschrijving die ze aan de berekening heeft gegeven. Deze had misschien iets duidelijker kunnen zijn zodat je onmiddellijk weet waarover de berekening gaat.
2008-10-17 09:39:43 [Ine Coremans] [reply
Deze student heeft de berekening 4 keer opnieuw gemaakt, en kwam tot de conclusie dat de verschillende percentages duidelijk afweken van de originele 16.438%. De oplossing is daarom, zoals ze ook vermeldt niet heel accuraat.

Dit heeft ze op een correcte manier herberekend en geblogd, je kan ook duidelijk haar naam zien bij de herberekeningen. Enkel de titel had misschien duidelijker gekunnen.
De opmerking die ze bij haar antwoord geeft dat het ook een uitzonderlijk jaar kan zijn, is in verband met de volgende vraag, maar is ook correct.

Ook zou ik nog opmerken dat de student voor de duidelijkheid de verschillende oplossingen die ze uitkwam na de herberekeningen in het worddocument best herhaalt, nu heeft ze enkel de link erin gezet. Op deze manier kan je ook in het worddocument snel nakijken wat de uitkomsten en verschillen zijn.
2008-10-18 19:13:20 [Astrid Sniekers] [reply
Uitleg oplossing vraag 1:
Ik heb de opgave goed begrepen en goed opgelost. Alleen had ik beter nog een aantal keer meer de berekening gedaan over een tijdspanne van 3650 dagen of 10 jaar. Zo had ik met zekerheid kunnen zeggen dat het resultaat dan nauwkeuriger wordt.
2008-10-19 12:09:01 [Bob Leysen] [reply
Ik kan hier weinig aan toevoegen, het antwoord is correct.
In tegenstelling tot veel andere studenten is dit document geverifieerd, dat staat vanboven te lezen.

Post a new message


Summary of computational transaction
Raw Inputview raw input (R code)
Raw Outputview raw output of R engine
Computing time3 seconds
R Server'Sir Ronald Aylmer Fisher' @ 193.190.124.24

\begin{tabular}{lllllllll}
\hline
Summary of computational transaction \tabularnewline
Raw Input & view raw input (R code)  \tabularnewline
Raw Output & view raw output of R engine  \tabularnewline
Computing time & 3 seconds \tabularnewline
R Server & 'Sir Ronald Aylmer Fisher' @ 193.190.124.24 \tabularnewline
\hline
\end{tabular}
%Source: https://freestatistics.org/blog/index.php?pk=15568&T=0

[TABLE]
[ROW][C]Summary of computational transaction[/C][/ROW]
[ROW][C]Raw Input[/C][C]view raw input (R code) [/C][/ROW]
[ROW][C]Raw Output[/C][C]view raw output of R engine [/C][/ROW]
[ROW][C]Computing time[/C][C]3 seconds[/C][/ROW]
[ROW][C]R Server[/C][C]'Sir Ronald Aylmer Fisher' @ 193.190.124.24[/C][/ROW]
[/TABLE]
Source: https://freestatistics.org/blog/index.php?pk=15568&T=0

Globally Unique Identifier (entire table): ba.freestatistics.org/blog/index.php?pk=15568&T=0

As an alternative you can also use a QR Code:  

The GUIDs for individual cells are displayed in the table below:

Summary of computational transaction
Raw Inputview raw input (R code)
Raw Outputview raw output of R engine
Computing time3 seconds
R Server'Sir Ronald Aylmer Fisher' @ 193.190.124.24


Exercise 1.13 p. 14 (Introduction to Probability, 2nd ed.)
Number of simulated days365
Expected number of births in Large Hospital45
Expected number of births in Small Hospital15
Percentage of Male births per day(for which the probability is computed)0.6
#Females births in Large Hospital8361
#Males births in Large Hospital8064
#Female births in Small Hospital2728
#Male births in Small Hospital2747
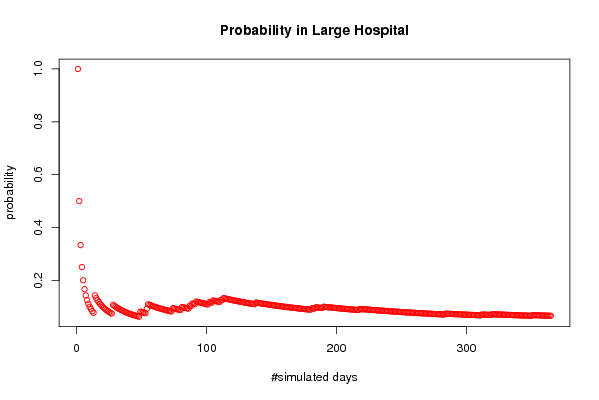
Probability of more than 60 % of male births in Large Hospital0.0657534246575342
Probability of more than 60 % of male births in Small Hospital0.128767123287671
#Days per Year when more than 60 % of male births occur in Large Hospital24
#Days per Year when more than 60 % of male births occur in Small Hospital47

\begin{tabular}{lllllllll}
\hline
Exercise 1.13 p. 14 (Introduction to Probability, 2nd ed.) \tabularnewline
Number of simulated days & 365 \tabularnewline
Expected number of births in Large Hospital & 45 \tabularnewline
Expected number of births in Small Hospital & 15 \tabularnewline
Percentage of Male births per day(for which the probability is computed) & 0.6 \tabularnewline
#Females births in Large Hospital & 8361 \tabularnewline
#Males births in Large Hospital & 8064 \tabularnewline
#Female births in Small Hospital & 2728 \tabularnewline
#Male births in Small Hospital & 2747 \tabularnewline
Probability of more than 60 % of male births in Large Hospital & 0.0657534246575342 \tabularnewline
Probability of more than 60 % of male births in Small Hospital & 0.128767123287671 \tabularnewline
#Days per Year when more than 60 % of male births occur in Large Hospital & 24 \tabularnewline
#Days per Year when more than 60 % of male births occur in Small Hospital & 47 \tabularnewline
\hline
\end{tabular}
%Source: https://freestatistics.org/blog/index.php?pk=15568&T=1

[TABLE]
[ROW][C]Exercise 1.13 p. 14 (Introduction to Probability, 2nd ed.)[/C][/ROW]
[ROW][C]Number of simulated days[/C][C]365[/C][/ROW]
[ROW][C]Expected number of births in Large Hospital[/C][C]45[/C][/ROW]
[ROW][C]Expected number of births in Small Hospital[/C][C]15[/C][/ROW]
[ROW][C]Percentage of Male births per day(for which the probability is computed)[/C][C]0.6[/C][/ROW]
[ROW][C]#Females births in Large Hospital[/C][C]8361[/C][/ROW]
[ROW][C]#Males births in Large Hospital[/C][C]8064[/C][/ROW]
[ROW][C]#Female births in Small Hospital[/C][C]2728[/C][/ROW]
[ROW][C]#Male births in Small Hospital[/C][C]2747[/C][/ROW]
[ROW][C]Probability of more than 60 % of male births in Large Hospital[/C][C]0.0657534246575342[/C][/ROW]
[C]Probability of more than 60 % of male births in Small Hospital[/C][C]0.128767123287671[/C][/ROW]
[ROW][C]#Days per Year when more than 60 % of male births occur in Large Hospital[/C][C]24[/C][/ROW]
[C]#Days per Year when more than 60 % of male births occur in Small Hospital[/C][C]47[/C][/ROW]
[/TABLE]
Source: https://freestatistics.org/blog/index.php?pk=15568&T=1

Globally Unique Identifier (entire table): ba.freestatistics.org/blog/index.php?pk=15568&T=1

As an alternative you can also use a QR Code:  

The GUIDs for individual cells are displayed in the table below:

Exercise 1.13 p. 14 (Introduction to Probability, 2nd ed.)
Number of simulated days365
Expected number of births in Large Hospital45
Expected number of births in Small Hospital15
Percentage of Male births per day(for which the probability is computed)0.6
#Females births in Large Hospital8361
#Males births in Large Hospital8064
#Female births in Small Hospital2728
#Male births in Small Hospital2747
Probability of more than 60 % of male births in Large Hospital0.0657534246575342
Probability of more than 60 % of male births in Small Hospital0.128767123287671
#Days per Year when more than 60 % of male births occur in Large Hospital24
#Days per Year when more than 60 % of male births occur in Small Hospital47


Parameters (Session):
par1 = 365 ; par2 = 45 ; par3 = 15 ; par4 = 0.6 ;
Parameters (R input):
par1 = 365 ; par2 = 45 ; par3 = 15 ; par4 = 0.6 ; par5 = ; par6 = ; par7 = ; par8 = ; par9 = ; par10 = ; par11 = ; par12 = ; par13 = ; par14 = ; par15 = ; par16 = ; par17 = ; par18 = ; par19 = ; par20 = ;
R code (references can be found in the software module):
par1 <- as.numeric(par1)
par2 <- as.numeric(par2)
par3 <- as.numeric(par3)
par4 <- as.numeric(par4)
numsuccessbig <- 0
numsuccesssmall <- 0
bighospital <- array(NA,dim=c(par1,par2))
smallhospital <- array(NA,dim=c(par1,par3))
bigprob <- array(NA,dim=par1)
smallprob <- array(NA,dim=par1)
for (i in 1:par1) {
bighospital[i,] <- sample(c('F','M'),par2,replace=TRUE)
if (as.matrix(table(bighospital[i,]))[2] > par4*par2) numsuccessbig = numsuccessbig + 1
bigprob[i] <- numsuccessbig/i
smallhospital[i,] <- sample(c('F','M'),par3,replace=TRUE)
if (as.matrix(table(smallhospital[i,]))[2] > par4*par3) numsuccesssmall = numsuccesssmall + 1
smallprob[i] <- numsuccesssmall/i
}
tbig <- as.matrix(table(bighospital))
tsmall <- as.matrix(table(smallhospital))
tbig
tsmall
numsuccessbig/par1
bigprob[par1]
numsuccesssmall/par1
smallprob[par1]
numsuccessbig/par1*365
bigprob[par1]*365
numsuccesssmall/par1*365
smallprob[par1]*365
bitmap(file='test1.png')
plot(bigprob,col=2,main='Probability in Large Hospital',xlab='#simulated days',ylab='probability')
dev.off()
bitmap(file='test2.png')
plot(smallprob,col=2,main='Probability in Small Hospital',xlab='#simulated days',ylab='probability')
dev.off()
load(file='createtable')
a<-table.start()
a<-table.row.start(a)
a<-table.element(a,'Exercise 1.13 p. 14 (Introduction to Probability, 2nd ed.)',2,TRUE)
a<-table.row.end(a)
a<-table.row.start(a)
a<-table.element(a,'Number of simulated days',header=TRUE)
a<-table.element(a,par1)
a<-table.row.end(a)
a<-table.row.start(a)
a<-table.element(a,'Expected number of births in Large Hospital',header=TRUE)
a<-table.element(a,par2)
a<-table.row.end(a)
a<-table.row.start(a)
a<-table.element(a,'Expected number of births in Small Hospital',header=TRUE)
a<-table.element(a,par3)
a<-table.row.end(a)
a<-table.row.start(a)
a<-table.element(a,'Percentage of Male births per day
(for which the probability is computed)',header=TRUE)
a<-table.element(a,par4)
a<-table.row.end(a)
a<-table.row.start(a)
a<-table.element(a,'#Females births in Large Hospital',header=TRUE)
a<-table.element(a,tbig[1])
a<-table.row.end(a)
a<-table.row.start(a)
a<-table.element(a,'#Males births in Large Hospital',header=TRUE)
a<-table.element(a,tbig[2])
a<-table.row.end(a)
a<-table.row.start(a)
a<-table.element(a,'#Female births in Small Hospital',header=TRUE)
a<-table.element(a,tsmall[1])
a<-table.row.end(a)
a<-table.row.start(a)
a<-table.element(a,'#Male births in Small Hospital',header=TRUE)
a<-table.element(a,tsmall[2])
a<-table.row.end(a)
a<-table.row.start(a)
dum1 <- paste('Probability of more than', par4*100, sep=' ')
dum <- paste(dum1, '% of male births in Large Hospital', sep=' ')
a<-table.element(a, dum, header=TRUE)
a<-table.element(a, bigprob[par1])
a<-table.row.end(a)
dum <- paste(dum1, '% of male births in Small Hospital', sep=' ')
a<-table.element(a, dum, header=TRUE)
a<-table.element(a, smallprob[par1])
a<-table.row.end(a)
a<-table.row.start(a)
dum1 <- paste('#Days per Year when more than', par4*100, sep=' ')
dum <- paste(dum1, '% of male births occur in Large Hospital', sep=' ')
a<-table.element(a, dum, header=TRUE)
a<-table.element(a, bigprob[par1]*365)
a<-table.row.end(a)
dum <- paste(dum1, '% of male births occur in Small Hospital', sep=' ')
a<-table.element(a, dum, header=TRUE)
a<-table.element(a, smallprob[par1]*365)
a<-table.row.end(a)
a<-table.end(a)
table.save(a,file='mytable.tab')