Free Statistics
of Irreproducible Research!
Description of Statistical Computation | |||||||||||||||||||||||||||||||||||||||||
|---|---|---|---|---|---|---|---|---|---|---|---|---|---|---|---|---|---|---|---|---|---|---|---|---|---|---|---|---|---|---|---|---|---|---|---|---|---|---|---|---|---|
| Author's title | |||||||||||||||||||||||||||||||||||||||||
| Author | *The author of this computation has been verified* | ||||||||||||||||||||||||||||||||||||||||
| R Software Module | rwasp_univariatedataseries.wasp | ||||||||||||||||||||||||||||||||||||||||
| Title produced by software | Univariate Data Series | ||||||||||||||||||||||||||||||||||||||||
| Date of computation | Sun, 12 Oct 2008 09:06:53 -0600 | ||||||||||||||||||||||||||||||||||||||||
| Cite this page as follows | Statistical Computations at FreeStatistics.org, Office for Research Development and Education, URL https://freestatistics.org/blog/index.php?v=date/2008/Oct/12/t1223824068qq5avj399lp1ybt.htm/, Retrieved Wed, 29 May 2024 06:40:42 +0000 | ||||||||||||||||||||||||||||||||||||||||
| Statistical Computations at FreeStatistics.org, Office for Research Development and Education, URL https://freestatistics.org/blog/index.php?pk=15483, Retrieved Wed, 29 May 2024 06:40:42 +0000 | |||||||||||||||||||||||||||||||||||||||||
| QR Codes: | |||||||||||||||||||||||||||||||||||||||||
|
| |||||||||||||||||||||||||||||||||||||||||
| Original text written by user: | |||||||||||||||||||||||||||||||||||||||||
| IsPrivate? | No (this computation is public) | ||||||||||||||||||||||||||||||||||||||||
| User-defined keywords | |||||||||||||||||||||||||||||||||||||||||
| Estimated Impact | 177 | ||||||||||||||||||||||||||||||||||||||||
Tree of Dependent Computations | |||||||||||||||||||||||||||||||||||||||||
| Family? (F = Feedback message, R = changed R code, M = changed R Module, P = changed Parameters, D = changed Data) | |||||||||||||||||||||||||||||||||||||||||
| F [Univariate Data Series] [Werkloosheid <25 ...] [2008-10-12 15:06:53] [924502d03698cd41cacbcd1327858815] [Current] - RMPD [Central Tendency] [Central tendency ...] [2008-10-18 19:48:27] [44ec60eb6065a3f81a5f756bd5af1faf] - RMPD [Pearson Correlation] [Correlatie totaal...] [2008-10-18 20:00:53] [755e6edbd621238167fee25e32900134] - RMPD [Pearson Correlation] [Correlatie totaal...] [2008-10-18 20:00:53] [44ec60eb6065a3f81a5f756bd5af1faf] - RMPD [Pearson Correlation] [Corelatie totaal ...] [2008-10-18 20:03:43] [44ec60eb6065a3f81a5f756bd5af1faf] - RMPD [Pearson Correlation] [Corelatie werkloo...] [2008-10-18 20:08:27] [44ec60eb6065a3f81a5f756bd5af1faf] - RMPD [Pearson Correlation] [Corelatie totaal ...] [2008-10-18 20:20:39] [44ec60eb6065a3f81a5f756bd5af1faf] - D [Pearson Correlation] [Correlatie totaal...] [2008-10-27 10:02:33] [7d3039e6253bb5fb3b26df1537d500b4] - RMPD [Pearson Correlation] [Corelatie mannen ...] [2008-10-18 20:23:31] [44ec60eb6065a3f81a5f756bd5af1faf] - [Pearson Correlation] [Q10 correlatie tu...] [2008-10-27 20:04:08] [7d3039e6253bb5fb3b26df1537d500b4] - D [Pearson Correlation] [Q10 correlatie ma...] [2008-10-27 20:06:09] [7d3039e6253bb5fb3b26df1537d500b4] - D [Pearson Correlation] [Q10 correlatie tu...] [2008-10-27 20:07:59] [7d3039e6253bb5fb3b26df1537d500b4] - D [Pearson Correlation] [Q10 correlatie tu...] [2008-10-27 20:10:45] [7d3039e6253bb5fb3b26df1537d500b4] - D [Pearson Correlation] [Q10 correlatie tu...] [2008-10-27 20:12:32] [7d3039e6253bb5fb3b26df1537d500b4] - RMPD [Pearson Correlation] [Corelatie vrouwen...] [2008-10-18 20:27:54] [44ec60eb6065a3f81a5f756bd5af1faf] - RMPD [Pearson Correlation] [Corelatie vrouwen...] [2008-10-18 20:30:34] [44ec60eb6065a3f81a5f756bd5af1faf] - RMPD [Pearson Correlation] [Corelatie vrouwen...] [2008-10-18 20:33:18] [44ec60eb6065a3f81a5f756bd5af1faf] - RMPD [Pearson Correlation] [Corelatie vrouwen...] [2008-10-18 20:35:23] [44ec60eb6065a3f81a5f756bd5af1faf] - RMPD [Pearson Correlation] [Corelatie mannen ...] [2008-10-18 20:38:30] [44ec60eb6065a3f81a5f756bd5af1faf] F RMPD [Univariate Explorative Data Analysis] [Werloosheid <25 U...] [2008-10-26 22:11:46] [44ec60eb6065a3f81a5f756bd5af1faf] F RMPD [Tukey lambda PPCC Plot] [Werloosheid <25 T...] [2008-10-26 22:14:41] [44ec60eb6065a3f81a5f756bd5af1faf] F RMPD [Mean Plot] [Werkloosheid <25 ...] [2008-11-02 17:15:02] [44ec60eb6065a3f81a5f756bd5af1faf] | |||||||||||||||||||||||||||||||||||||||||
| Feedback Forum | |||||||||||||||||||||||||||||||||||||||||
Post a new message | |||||||||||||||||||||||||||||||||||||||||
Dataset | |||||||||||||||||||||||||||||||||||||||||
| Dataseries X: | |||||||||||||||||||||||||||||||||||||||||
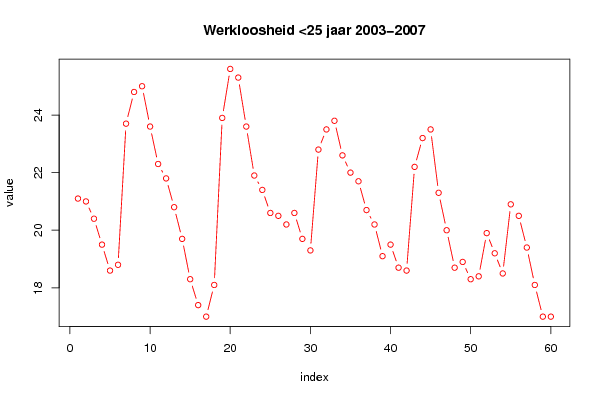
21,1 21 20,4 19,5 18,6 18,8 23,7 24,8 25 23,6 22,3 21,8 20,8 19,7 18,3 17,4 17 18,1 23,9 25,6 25,3 23,6 21,9 21,4 20,6 20,5 20,2 20,6 19,7 19,3 22,8 23,5 23,8 22,6 22 21,7 20,7 20,2 19,1 19,5 18,7 18,6 22,2 23,2 23,5 21,3 20 18,7 18,9 18,3 18,4 19,9 19,2 18,5 20,9 20,5 19,4 18,1 17 17 | |||||||||||||||||||||||||||||||||||||||||
Tables (Output of Computation) | |||||||||||||||||||||||||||||||||||||||||
| |||||||||||||||||||||||||||||||||||||||||
Figures (Output of Computation) | |||||||||||||||||||||||||||||||||||||||||
Input Parameters & R Code | |||||||||||||||||||||||||||||||||||||||||
| Parameters (Session): | |||||||||||||||||||||||||||||||||||||||||
| par1 = Werkloosheid <25 jaar 2003-2007 ; par2 = Belgostat - NBB ; | |||||||||||||||||||||||||||||||||||||||||
| Parameters (R input): | |||||||||||||||||||||||||||||||||||||||||
| par1 = Werkloosheid <25 jaar 2003-2007 ; par2 = Belgostat - NBB ; par3 = ; | |||||||||||||||||||||||||||||||||||||||||
| R code (references can be found in the software module): | |||||||||||||||||||||||||||||||||||||||||
bitmap(file='test1.png') | |||||||||||||||||||||||||||||||||||||||||