Free Statistics

of Irreproducible Research!

Author's title

Author*The author of this computation has been verified*
R Software Modulerwasp_babies.wasp
Title produced by softwareExercise 1.13
Date of computationSun, 12 Oct 2008 06:20:22 -0600
Cite this page as followsStatistical Computations at FreeStatistics.org, Office for Research Development and Education, URL https://freestatistics.org/blog/index.php?v=date/2008/Oct/12/t1223814133itcd9lo289luf3d.htm/, Retrieved Sun, 19 May 2024 14:06:26 +0000
Statistical Computations at FreeStatistics.org, Office for Research Development and Education, URL https://freestatistics.org/blog/index.php?pk=15454, Retrieved Sun, 19 May 2024 14:06:26 +0000
QR Codes:

Original text written by user:
IsPrivate?No (this computation is public)
User-defined keywords
Estimated Impact200
Family? (F = Feedback message, R = changed R code, M = changed R Module, P = changed Parameters, D = changed Data)
F     [Exercise 1.13] [Exercise 1.13 (Wo...] [2008-10-01 13:28:34] [b98453cac15ba1066b407e146608df68]
F   P   [Exercise 1.13] [Vraag 1: Result 2] [2008-10-12 10:09:14] [70cb582895831af4be81fec73c607e93]
F R         [Exercise 1.13] [Vraag 4: Result 2] [2008-10-12 12:20:22] [96c9291ce335a5c9abba7b920811c2df] [Current]
Feedback Forum
2008-10-17 14:55:44 [Matthieu Blondeau] [reply
Het > teken moest veranderd worden in de R code in <. Dit is hier het geval:
if (as.matrix(table(bighospital[i,]))[2] < par4*par2)
if (as.matrix(table(smallhospital[i,]))[2] < par4*par3)
2008-10-18 16:23:37 [Hidde Van Kerckhoven] [reply
Idd het teken is van > -> naar < veranderd, ook de namen van de assen zijn goed vertaald... Dit is een correcte oplossing
2008-10-19 14:29:35 [Dries Van Gheluwe] [reply
Correcte oplossing van deze oefening
2008-10-19 14:59:54 [Stijn Loomans] [reply
Je hebt hier laten zien dat je de R-Code goed snapt . En je wist dat je > naar < moest aanpassen , en ook de assen gaan vertalen. Een goede oplossing
2008-10-19 15:01:05 [Evelyn Ongena] [reply
de R code is correct aangepast : > is veranderd naar <
en in de tekst is ook 'more' gewijzigd naar 'less'
2008-10-19 16:17:54 [Kristof Augustyns] [reply
Om hier een antwoord op te geven moeten er elementen gewijzigd worden in de R-code omdat men de vraagstelling hier omdraait.
Nu wilt men weten welk ziekenhuis het meeste aantal dagen heeft met minder dan 60% van de mannelijke geboorten.
Dit is gewoon een omkering van de oorspronkelijke vraag en daardoor moet dit vervangen worden:
if (as.matrix(table(bighospital[i,]))[2] < par4*par2) en
if (as.matrix(table(smallhospital[i,]))[2] < par4*par3)
Oorspronkelijk was het > dan, maar doordat de het omgekeerde van de vraagstelling werd gevraagd, moet het 'kleiner dan' worden.
dum1 <- paste('Probability of less than' en dum1 <- paste('#Days per Year when less than'
--> Hier was het oorspronkelijk more than en dit is ook goed vervangen door 'less than'
Ook is er een vertaling van de assen

=> Hier valt dus niet veel op aan te merken
2008-10-19 18:47:36 [Kristof Augustyns] [reply
de vertaling van die as:
plot(bigprob,col=2,main='Probability in Large Hospital',xlab='#simulated days',ylab='probability')
dev.off()
plot(smallprob,col=2,main='Probability in Small Hospital',xlab='#simulated days',ylab='probability')
dev.off()

Dit was oorspronkelijk in de R-code en moet vervangen worden door:
plot(bigprob,col=2,main='Kans in het grote ziekenhuis',xlab='#simulated days',ylab='probability')
dev.off()
plot(smallprob,col=2,main='Kans in het kleine ziekenhuis',xlab='#simulated days',ylab='probability')
dev.off()

Post a new message


Summary of computational transaction
Raw Inputview raw input (R code)
Raw Outputview raw output of R engine
Computing time1 seconds
R Server'George Udny Yule' @ 72.249.76.132

\begin{tabular}{lllllllll}
\hline
Summary of computational transaction \tabularnewline
Raw Input & view raw input (R code)  \tabularnewline
Raw Output & view raw output of R engine  \tabularnewline
Computing time & 1 seconds \tabularnewline
R Server & 'George Udny Yule' @ 72.249.76.132 \tabularnewline
\hline
\end{tabular}
%Source: https://freestatistics.org/blog/index.php?pk=15454&T=0

[TABLE]
[ROW][C]Summary of computational transaction[/C][/ROW]
[ROW][C]Raw Input[/C][C]view raw input (R code) [/C][/ROW]
[ROW][C]Raw Output[/C][C]view raw output of R engine [/C][/ROW]
[ROW][C]Computing time[/C][C]1 seconds[/C][/ROW]
[ROW][C]R Server[/C][C]'George Udny Yule' @ 72.249.76.132[/C][/ROW]
[/TABLE]
Source: https://freestatistics.org/blog/index.php?pk=15454&T=0

Globally Unique Identifier (entire table): ba.freestatistics.org/blog/index.php?pk=15454&T=0

As an alternative you can also use a QR Code:  

The GUIDs for individual cells are displayed in the table below:

Summary of computational transaction
Raw Inputview raw input (R code)
Raw Outputview raw output of R engine
Computing time1 seconds
R Server'George Udny Yule' @ 72.249.76.132


Exercise 1.13 p. 14 (Introduction to Probability, 2nd ed.)
Number of simulated days365
Expected number of births in Large Hospital45
Expected number of births in Small Hospital15
Percentage of Male births per day(for which the probability is computed)0.6
#Females births in Large Hospital8228
#Males births in Large Hospital8197
#Female births in Small Hospital2786
#Male births in Small Hospital2689
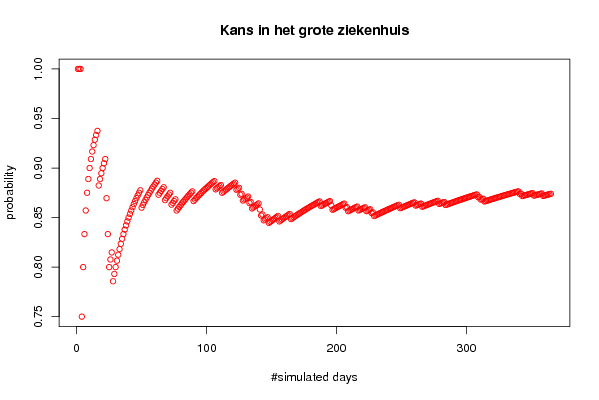
Probability of less than 60 % of male births in Large Hospital0.873972602739726
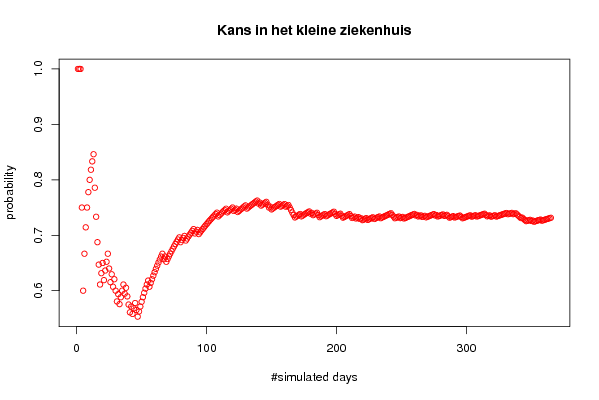
Probability of less than 60 % of male births in Small Hospital0.731506849315068
#Days per Year when less than 60 % of male births occur in Large Hospital319
#Days per Year when less than 60 % of male births occur in Small Hospital267

\begin{tabular}{lllllllll}
\hline
Exercise 1.13 p. 14 (Introduction to Probability, 2nd ed.) \tabularnewline
Number of simulated days & 365 \tabularnewline
Expected number of births in Large Hospital & 45 \tabularnewline
Expected number of births in Small Hospital & 15 \tabularnewline
Percentage of Male births per day(for which the probability is computed) & 0.6 \tabularnewline
#Females births in Large Hospital & 8228 \tabularnewline
#Males births in Large Hospital & 8197 \tabularnewline
#Female births in Small Hospital & 2786 \tabularnewline
#Male births in Small Hospital & 2689 \tabularnewline
Probability of less than 60 % of male births in Large Hospital & 0.873972602739726 \tabularnewline
Probability of less than 60 % of male births in Small Hospital & 0.731506849315068 \tabularnewline
#Days per Year when less than 60 % of male births occur in Large Hospital & 319 \tabularnewline
#Days per Year when less than 60 % of male births occur in Small Hospital & 267 \tabularnewline
\hline
\end{tabular}
%Source: https://freestatistics.org/blog/index.php?pk=15454&T=1

[TABLE]
[ROW][C]Exercise 1.13 p. 14 (Introduction to Probability, 2nd ed.)[/C][/ROW]
[ROW][C]Number of simulated days[/C][C]365[/C][/ROW]
[ROW][C]Expected number of births in Large Hospital[/C][C]45[/C][/ROW]
[ROW][C]Expected number of births in Small Hospital[/C][C]15[/C][/ROW]
[ROW][C]Percentage of Male births per day(for which the probability is computed)[/C][C]0.6[/C][/ROW]
[ROW][C]#Females births in Large Hospital[/C][C]8228[/C][/ROW]
[ROW][C]#Males births in Large Hospital[/C][C]8197[/C][/ROW]
[ROW][C]#Female births in Small Hospital[/C][C]2786[/C][/ROW]
[ROW][C]#Male births in Small Hospital[/C][C]2689[/C][/ROW]
[ROW][C]Probability of less than 60 % of male births in Large Hospital[/C][C]0.873972602739726[/C][/ROW]
[C]Probability of less than 60 % of male births in Small Hospital[/C][C]0.731506849315068[/C][/ROW]
[ROW][C]#Days per Year when less than 60 % of male births occur in Large Hospital[/C][C]319[/C][/ROW]
[C]#Days per Year when less than 60 % of male births occur in Small Hospital[/C][C]267[/C][/ROW]
[/TABLE]
Source: https://freestatistics.org/blog/index.php?pk=15454&T=1

Globally Unique Identifier (entire table): ba.freestatistics.org/blog/index.php?pk=15454&T=1

As an alternative you can also use a QR Code:  

The GUIDs for individual cells are displayed in the table below:

Exercise 1.13 p. 14 (Introduction to Probability, 2nd ed.)
Number of simulated days365
Expected number of births in Large Hospital45
Expected number of births in Small Hospital15
Percentage of Male births per day(for which the probability is computed)0.6
#Females births in Large Hospital8228
#Males births in Large Hospital8197
#Female births in Small Hospital2786
#Male births in Small Hospital2689
Probability of less than 60 % of male births in Large Hospital0.873972602739726
Probability of less than 60 % of male births in Small Hospital0.731506849315068
#Days per Year when less than 60 % of male births occur in Large Hospital319
#Days per Year when less than 60 % of male births occur in Small Hospital267


Parameters (Session):
par1 = 365 ; par2 = 45 ; par3 = 15 ; par4 = 0.6 ;
Parameters (R input):
par1 = 365 ; par2 = 45 ; par3 = 15 ; par4 = 0.6 ;
R code (references can be found in the software module):
par1 <- as.numeric(par1) 
par2 <- as.numeric(par2)
par3 <- as.numeric(par3)
par4 <- as.numeric(par4)
numsuccessbig <- 0
numsuccesssmall <- 0
bighospital <- array(NA,dim=c(par1,par2))
smallhospital <- array(NA,dim=c(par1,par3))
bigprob <- array(NA,dim=par1)
smallprob <- array(NA,dim=par1)
for (i in 1:par1) {
bighospital[i,] <- sample(c('F','M'),par2,replace=TRUE)
if (as.matrix(table(bighospital[i,]))[2] < par4*par2) numsuccessbig = numsuccessbig + 1
bigprob[i] <- numsuccessbig/i
smallhospital[i,] <- sample(c('F','M'),par3,replace=TRUE)
if (as.matrix(table(smallhospital[i,]))[2] < par4*par3) numsuccesssmall = numsuccesssmall + 1
smallprob[i] <- numsuccesssmall/i
}
tbig <- as.matrix(table(bighospital))
tsmall <- as.matrix(table(smallhospital))
tbig
tsmall
numsuccessbig/par1
bigprob[par1]
numsuccesssmall/par1
smallprob[par1]
numsuccessbig/par1*365
bigprob[par1]*365
numsuccesssmall/par1*365
smallprob[par1]*365
bitmap(file='test1.png')
plot(bigprob,col=2,main='Kans in het grote ziekenhuis',xlab='#simulated days',ylab='probability')
dev.off()
bitmap(file='test2.png')
plot(smallprob,col=2,main='Kans in het kleine ziekenhuis',xlab='#simulated days',ylab='probability')
dev.off()
load(file='createtable')
a<-table.start()
a<-table.row.start(a)
a<-table.element(a,'Exercise 1.13 p. 14 (Introduction to Probability, 2nd ed.)',2,TRUE)
a<-table.row.end(a)
a<-table.row.start(a)
a<-table.element(a,'Number of simulated days',header=TRUE)
a<-table.element(a,par1)
a<-table.row.end(a)
a<-table.row.start(a)
a<-table.element(a,'Expected number of births in Large Hospital',header=TRUE)
a<-table.element(a,par2)
a<-table.row.end(a)
a<-table.row.start(a)
a<-table.element(a,'Expected number of births in Small Hospital',header=TRUE)
a<-table.element(a,par3)
a<-table.row.end(a)
a<-table.row.start(a)
a<-table.element(a,'Percentage of Male births per day
(for which the probability is computed)',header=TRUE)
a<-table.element(a,par4)
a<-table.row.end(a)
a<-table.row.start(a)
a<-table.element(a,'#Females births in Large Hospital',header=TRUE)
a<-table.element(a,tbig[1])
a<-table.row.end(a)
a<-table.row.start(a)
a<-table.element(a,'#Males births in Large Hospital',header=TRUE)
a<-table.element(a,tbig[2])
a<-table.row.end(a)
a<-table.row.start(a)
a<-table.element(a,'#Female births in Small Hospital',header=TRUE)
a<-table.element(a,tsmall[1])
a<-table.row.end(a)
a<-table.row.start(a)
a<-table.element(a,'#Male births in Small Hospital',header=TRUE)
a<-table.element(a,tsmall[2])
a<-table.row.end(a)
a<-table.row.start(a)
dum1 <- paste('Probability of less than', par4*100, sep=' ')
dum <- paste(dum1, '% of male births in Large Hospital', sep=' ')
a<-table.element(a, dum, header=TRUE)
a<-table.element(a, bigprob[par1])
a<-table.row.end(a)
dum <- paste(dum1, '% of male births in Small Hospital', sep=' ')
a<-table.element(a, dum, header=TRUE)
a<-table.element(a, smallprob[par1])
a<-table.row.end(a)
a<-table.row.start(a)
dum1 <- paste('#Days per Year when less than', par4*100, sep=' ')
dum <- paste(dum1, '% of male births occur in Large Hospital', sep=' ')
a<-table.element(a, dum, header=TRUE)
a<-table.element(a, bigprob[par1]*365)
a<-table.row.end(a)
dum <- paste(dum1, '% of male births occur in Small Hospital', sep=' ')
a<-table.element(a, dum, header=TRUE)
a<-table.element(a, smallprob[par1]*365)
a<-table.row.end(a)
a<-table.end(a)
table.save(a,file='mytable.tab')