Free Statistics

of Irreproducible Research!

Author's title

Author*Unverified author*
R Software Modulerwasp_babies.wasp
Title produced by softwareExercise 1.13
Date of computationSun, 12 Oct 2008 04:29:08 -0600
Cite this page as followsStatistical Computations at FreeStatistics.org, Office for Research Development and Education, URL https://freestatistics.org/blog/index.php?v=date/2008/Oct/12/t12238074205oh3hfm8t3fzuub.htm/, Retrieved Sun, 19 May 2024 15:37:43 +0000
Statistical Computations at FreeStatistics.org, Office for Research Development and Education, URL https://freestatistics.org/blog/index.php?pk=15414, Retrieved Sun, 19 May 2024 15:37:43 +0000
QR Codes:

Original text written by user:
IsPrivate?No (this computation is public)
User-defined keywords
Estimated Impact213
Family? (F = Feedback message, R = changed R code, M = changed R Module, P = changed Parameters, D = changed Data)
F     [Exercise 1.13] [Exercise 1.13 (Wo...] [2008-10-01 13:28:34] [b98453cac15ba1066b407e146608df68]
F   P     [Exercise 1.13] [probability 80% o...] [2008-10-12 10:29:08] [d41d8cd98f00b204e9800998ecf8427e] [Current]
-           [Exercise 1.13] [EX 1.13 Vr 3 aant...] [2008-10-18 11:27:12] [0996801648c22721e57e03a7deb595f2]
-             [Exercise 1.13] [EX 1.13 Vr 3 aant...] [2008-10-18 11:34:18] [0996801648c22721e57e03a7deb595f2]
-               [Exercise 1.13] [EX 1.13 Vr 3 aant...] [2008-10-18 11:37:51] [0996801648c22721e57e03a7deb595f2]
-                 [Exercise 1.13] [EX 1.13 Vr 3 aant...] [2008-10-18 11:40:34] [0996801648c22721e57e03a7deb595f2]
Feedback Forum
2008-10-17 10:10:59 [Davy De Nef] [reply
De berekening is juist gebeurd, alleen wordt in het document de oplossing fout weergegeven. De berekening geeft als resultaat 0,27%, in het document staat 0,0027%
2008-10-18 10:17:36 [Olivier Uyttendaele] [reply
Student geeft als conclusie:De resultaten uit het grote ziekenhuis zijn meer accuraat, ten gevolge van het grotere aantal baby’s = stabieler resultaat. Het is dus ook duidelijk dat als men het aantal baby’s dat per dag geboren wordt verhoogt (=parameter), het resultaat zo mogelijk nóg meer accuraat wordt.

Mijn verbetering: De student heeft gelijk wanneer hij tracht een stabieler resultaat te bekomen door het aantal waarnemingen te vergroten. Hij gebruikt echter een verkeerde parameter. Het aantal baby's verhogen impliceert dat hij de vraagstelling aanpast. Om het aantal waarnemingen te verhogen zonder aan de vraagstelling te raken is het nodig de parameter tijd aan te passen. ipv 365d neemt men 3650d.
De resultaten zullen per berekening nog veranderen, toch zullen de schommelingen tussen de resultaten beperkt zijn.
2008-10-18 11:51:12 [Olivier Uyttendaele] [reply
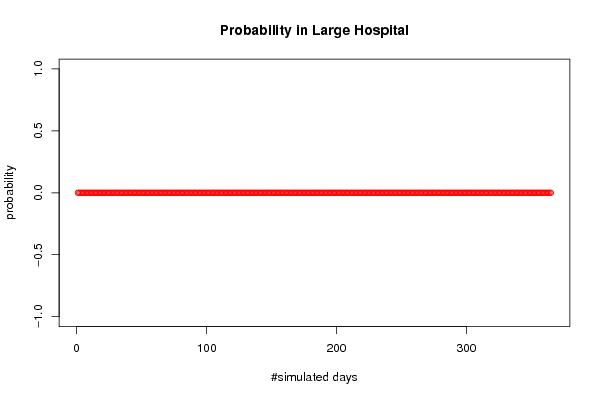
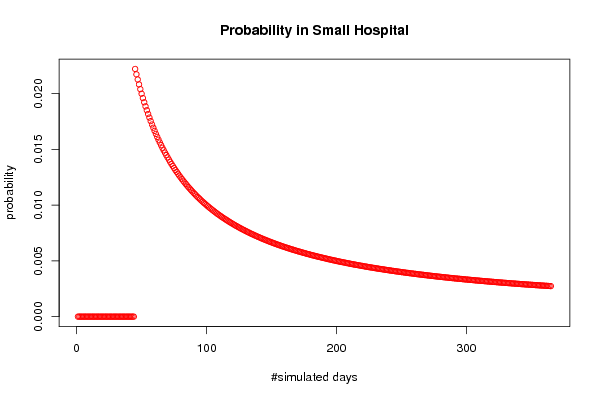
Student schreef: De waarschijnlijkheid dat meer dan 80% van alle geboortes in het grote ziekenhuis op 1 dag mannelijk zijn bedraagt 0, voor het kleine ziekenhuis is deze waarschijnlijkheid 0.0027
Hieruit blijkt dus weeral dat de resultaten van het grote ziekenhuis meer accuraat zijn, door het hogere aantal geboortes.


Verbetering: De berekening is,zoals gemeld in een eerdere post op het feedback forum, correct uitgevoerd. Resultaat van deze bewerking is 0,27%. Echter bij het herhaaldelijk opnieuw berekenen van de bewerking komen we een ander resultaat uit. 4 resultaten komen telkens terug nl. O% (1) 0,274% (2) 0,548% (3)
0,822% (4)
Bij herhaaldelijk reproduceren(10tal keren geprobeerd) zijn het enkel deze 4 percentages die telkens terugkomen. Wanneer we dan een gemiddelde nemen van de 4bovenstaande percentages komen we 0,411% uit. Dit percentage kan dan zeer betrouwbaar worden beschouwd als antwoord op de vraag.


(1) http://www.freestatistics.org/blog/index.php?v=date/2008/Oct/18/t12243299242j7llzg4oqstl8a.htm

(2) http://www.freestatistics.org/blog/index.php?v=date/2008/Oct/18/t122432978685n85by9nv6iijn.htm

(3) http://www.freestatistics.org/blog/index.php?v=date/2008/Oct/18/t1224330076lyt6dt6y1ipkpvp.htm

(4) http://www.freestatistics.org/blog/index.php?v=date/2008/Oct/18/t12243294600pbefgd3m3k2mmy.htm
2008-10-19 12:30:44 [9142cf052ad32d043faa9486189092cf] [reply
De opgave is hier correct opgelost maar de conclusie is hier verkeerd geformuleerd.

Toch mocht ook hier de steekproef meerdere
malen worden uitgevoerd. Omdat het mogelijk is om bij het groot ziekenhuis een waarschijnlijkheid van 0 uit te komen, toch kan het eens heel zelden voor vallen
dat er op 1 dag wel 80% jongens geboren worden.

In de oplossing moet er dus ook een onderscheid gemaakt worden tussen het kleine ziekenhuis en het grote ziekenhuis.

Voor een groot hospitaal; Bij sommige berekeningen is de oplossing (de waarschijnlijkheid) gelijk aan nul. Maar naar mate er meer steekproeven uitgevoerd worden gaat het resultaat een heel klein beetje afwijken van nul. Dus ook hier is het weer belangrijk om meerdere steekproeven uit te voeren om zo een nauwkeuriger antwoord te bekomen.

Voor een klein hospitaal: Is de waarschijnlijkheid groter dan bij een groot hospitaal dit komt omdat er in een klein hospitaal minder geboortes zijn dus de kans dat er 80% jongens geboren worden is hier iets groter.

Voorbeeld:
klein hospitaal: 1 geboorte : meer kans dat dit een jongen is dan al voldaan aan de voorwaarde.
Groot hospitaal: 10 geboorte: hier moeten al 8 jongens geboren worden. De kans is dus kans kleiner.

Conclusie: hoe meer geboortes hoe onwaarschijnlijker het wordt dat meer dan 80% jongens zijn.
2008-10-19 20:47:29 [Stijn Van de Velde] [reply
Een correcte berekening.
In je antwoord zet je wel dat de resultaten meer accuraat worden bij een groter aantal geboortes. Dat is correct, maar zo verander je wel de opgave. Je zou 365 dagen in 3650 moeten veranderen om tot een accurate oplossing te komen.

Je kan in de plaats ook de berekening enkele keren doen, en dan het gemiddelde van de uitkomsten nemen.
2008-10-20 18:24:07 [Wim Golsteyn] [reply
Ik ben hier inderdaad in de fout gegaan door het aantal verwachte geboortes te veranderen ipv de periode waarover de berekening werd uitgevoerd. Natuurlijk gaf dit wel een stabieler resultaat, maar in de praktijk zou dit onmogelijk zijn, zonder een vertekend beeld te geven.

Post a new message


Summary of computational transaction
Raw Inputview raw input (R code)
Raw Outputview raw output of R engine
Computing time1 seconds
R Server'Gwilym Jenkins' @ 72.249.127.135

\begin{tabular}{lllllllll}
\hline
Summary of computational transaction \tabularnewline
Raw Input & view raw input (R code)  \tabularnewline
Raw Output & view raw output of R engine  \tabularnewline
Computing time & 1 seconds \tabularnewline
R Server & 'Gwilym Jenkins' @ 72.249.127.135 \tabularnewline
\hline
\end{tabular}
%Source: https://freestatistics.org/blog/index.php?pk=15414&T=0

[TABLE]
[ROW][C]Summary of computational transaction[/C][/ROW]
[ROW][C]Raw Input[/C][C]view raw input (R code) [/C][/ROW]
[ROW][C]Raw Output[/C][C]view raw output of R engine [/C][/ROW]
[ROW][C]Computing time[/C][C]1 seconds[/C][/ROW]
[ROW][C]R Server[/C][C]'Gwilym Jenkins' @ 72.249.127.135[/C][/ROW]
[/TABLE]
Source: https://freestatistics.org/blog/index.php?pk=15414&T=0

Globally Unique Identifier (entire table): ba.freestatistics.org/blog/index.php?pk=15414&T=0

As an alternative you can also use a QR Code:  

The GUIDs for individual cells are displayed in the table below:

Summary of computational transaction
Raw Inputview raw input (R code)
Raw Outputview raw output of R engine
Computing time1 seconds
R Server'Gwilym Jenkins' @ 72.249.127.135


Exercise 1.13 p. 14 (Introduction to Probability, 2nd ed.)
Number of simulated days365
Expected number of births in Large Hospital45
Expected number of births in Small Hospital15
Percentage of Male births per day(for which the probability is computed)0.8
#Females births in Large Hospital8274
#Males births in Large Hospital8151
#Female births in Small Hospital2737
#Male births in Small Hospital2738
Probability of more than 80 % of male births in Large Hospital0
Probability of more than 80 % of male births in Small Hospital0.00273972602739726
#Days per Year when more than 80 % of male births occur in Large Hospital0
#Days per Year when more than 80 % of male births occur in Small Hospital1

\begin{tabular}{lllllllll}
\hline
Exercise 1.13 p. 14 (Introduction to Probability, 2nd ed.) \tabularnewline
Number of simulated days & 365 \tabularnewline
Expected number of births in Large Hospital & 45 \tabularnewline
Expected number of births in Small Hospital & 15 \tabularnewline
Percentage of Male births per day(for which the probability is computed) & 0.8 \tabularnewline
#Females births in Large Hospital & 8274 \tabularnewline
#Males births in Large Hospital & 8151 \tabularnewline
#Female births in Small Hospital & 2737 \tabularnewline
#Male births in Small Hospital & 2738 \tabularnewline
Probability of more than 80 % of male births in Large Hospital & 0 \tabularnewline
Probability of more than 80 % of male births in Small Hospital & 0.00273972602739726 \tabularnewline
#Days per Year when more than 80 % of male births occur in Large Hospital & 0 \tabularnewline
#Days per Year when more than 80 % of male births occur in Small Hospital & 1 \tabularnewline
\hline
\end{tabular}
%Source: https://freestatistics.org/blog/index.php?pk=15414&T=1

[TABLE]
[ROW][C]Exercise 1.13 p. 14 (Introduction to Probability, 2nd ed.)[/C][/ROW]
[ROW][C]Number of simulated days[/C][C]365[/C][/ROW]
[ROW][C]Expected number of births in Large Hospital[/C][C]45[/C][/ROW]
[ROW][C]Expected number of births in Small Hospital[/C][C]15[/C][/ROW]
[ROW][C]Percentage of Male births per day(for which the probability is computed)[/C][C]0.8[/C][/ROW]
[ROW][C]#Females births in Large Hospital[/C][C]8274[/C][/ROW]
[ROW][C]#Males births in Large Hospital[/C][C]8151[/C][/ROW]
[ROW][C]#Female births in Small Hospital[/C][C]2737[/C][/ROW]
[ROW][C]#Male births in Small Hospital[/C][C]2738[/C][/ROW]
[ROW][C]Probability of more than 80 % of male births in Large Hospital[/C][C]0[/C][/ROW]
[C]Probability of more than 80 % of male births in Small Hospital[/C][C]0.00273972602739726[/C][/ROW]
[ROW][C]#Days per Year when more than 80 % of male births occur in Large Hospital[/C][C]0[/C][/ROW]
[C]#Days per Year when more than 80 % of male births occur in Small Hospital[/C][C]1[/C][/ROW]
[/TABLE]
Source: https://freestatistics.org/blog/index.php?pk=15414&T=1

Globally Unique Identifier (entire table): ba.freestatistics.org/blog/index.php?pk=15414&T=1

As an alternative you can also use a QR Code:  

The GUIDs for individual cells are displayed in the table below:

Exercise 1.13 p. 14 (Introduction to Probability, 2nd ed.)
Number of simulated days365
Expected number of births in Large Hospital45
Expected number of births in Small Hospital15
Percentage of Male births per day(for which the probability is computed)0.8
#Females births in Large Hospital8274
#Males births in Large Hospital8151
#Female births in Small Hospital2737
#Male births in Small Hospital2738
Probability of more than 80 % of male births in Large Hospital0
Probability of more than 80 % of male births in Small Hospital0.00273972602739726
#Days per Year when more than 80 % of male births occur in Large Hospital0
#Days per Year when more than 80 % of male births occur in Small Hospital1


Parameters (Session):
par1 = 365 ; par2 = 45 ; par3 = 15 ; par4 = 0.8 ;
Parameters (R input):
par1 = 365 ; par2 = 45 ; par3 = 15 ; par4 = 0.8 ;
R code (references can be found in the software module):
par1 <- as.numeric(par1)
par2 <- as.numeric(par2)
par3 <- as.numeric(par3)
par4 <- as.numeric(par4)
numsuccessbig <- 0
numsuccesssmall <- 0
bighospital <- array(NA,dim=c(par1,par2))
smallhospital <- array(NA,dim=c(par1,par3))
bigprob <- array(NA,dim=par1)
smallprob <- array(NA,dim=par1)
for (i in 1:par1) {
bighospital[i,] <- sample(c('F','M'),par2,replace=TRUE)
if (as.matrix(table(bighospital[i,]))[2] > par4*par2) numsuccessbig = numsuccessbig + 1
bigprob[i] <- numsuccessbig/i
smallhospital[i,] <- sample(c('F','M'),par3,replace=TRUE)
if (as.matrix(table(smallhospital[i,]))[2] > par4*par3) numsuccesssmall = numsuccesssmall + 1
smallprob[i] <- numsuccesssmall/i
}
tbig <- as.matrix(table(bighospital))
tsmall <- as.matrix(table(smallhospital))
tbig
tsmall
numsuccessbig/par1
bigprob[par1]
numsuccesssmall/par1
smallprob[par1]
numsuccessbig/par1*365
bigprob[par1]*365
numsuccesssmall/par1*365
smallprob[par1]*365
bitmap(file='test1.png')
plot(bigprob,col=2,main='Probability in Large Hospital',xlab='#simulated days',ylab='probability')
dev.off()
bitmap(file='test2.png')
plot(smallprob,col=2,main='Probability in Small Hospital',xlab='#simulated days',ylab='probability')
dev.off()
load(file='createtable')
a<-table.start()
a<-table.row.start(a)
a<-table.element(a,'Exercise 1.13 p. 14 (Introduction to Probability, 2nd ed.)',2,TRUE)
a<-table.row.end(a)
a<-table.row.start(a)
a<-table.element(a,'Number of simulated days',header=TRUE)
a<-table.element(a,par1)
a<-table.row.end(a)
a<-table.row.start(a)
a<-table.element(a,'Expected number of births in Large Hospital',header=TRUE)
a<-table.element(a,par2)
a<-table.row.end(a)
a<-table.row.start(a)
a<-table.element(a,'Expected number of births in Small Hospital',header=TRUE)
a<-table.element(a,par3)
a<-table.row.end(a)
a<-table.row.start(a)
a<-table.element(a,'Percentage of Male births per day
(for which the probability is computed)',header=TRUE)
a<-table.element(a,par4)
a<-table.row.end(a)
a<-table.row.start(a)
a<-table.element(a,'#Females births in Large Hospital',header=TRUE)
a<-table.element(a,tbig[1])
a<-table.row.end(a)
a<-table.row.start(a)
a<-table.element(a,'#Males births in Large Hospital',header=TRUE)
a<-table.element(a,tbig[2])
a<-table.row.end(a)
a<-table.row.start(a)
a<-table.element(a,'#Female births in Small Hospital',header=TRUE)
a<-table.element(a,tsmall[1])
a<-table.row.end(a)
a<-table.row.start(a)
a<-table.element(a,'#Male births in Small Hospital',header=TRUE)
a<-table.element(a,tsmall[2])
a<-table.row.end(a)
a<-table.row.start(a)
dum1 <- paste('Probability of more than', par4*100, sep=' ')
dum <- paste(dum1, '% of male births in Large Hospital', sep=' ')
a<-table.element(a, dum, header=TRUE)
a<-table.element(a, bigprob[par1])
a<-table.row.end(a)
dum <- paste(dum1, '% of male births in Small Hospital', sep=' ')
a<-table.element(a, dum, header=TRUE)
a<-table.element(a, smallprob[par1])
a<-table.row.end(a)
a<-table.row.start(a)
dum1 <- paste('#Days per Year when more than', par4*100, sep=' ')
dum <- paste(dum1, '% of male births occur in Large Hospital', sep=' ')
a<-table.element(a, dum, header=TRUE)
a<-table.element(a, bigprob[par1]*365)
a<-table.row.end(a)
dum <- paste(dum1, '% of male births occur in Small Hospital', sep=' ')
a<-table.element(a, dum, header=TRUE)
a<-table.element(a, smallprob[par1]*365)
a<-table.row.end(a)
a<-table.end(a)
table.save(a,file='mytable.tab')