Free Statistics

of Irreproducible Research!

Author's title

Author*The author of this computation has been verified*
R Software Modulerwasp_babies.wasp
Title produced by softwareExercise 1.13
Date of computationSun, 12 Oct 2008 03:59:32 -0600
Cite this page as followsStatistical Computations at FreeStatistics.org, Office for Research Development and Education, URL https://freestatistics.org/blog/index.php?v=date/2008/Oct/12/t1223805667tkw9jl08yq1rwut.htm/, Retrieved Sun, 19 May 2024 16:10:07 +0000
Statistical Computations at FreeStatistics.org, Office for Research Development and Education, URL https://freestatistics.org/blog/index.php?pk=15404, Retrieved Sun, 19 May 2024 16:10:07 +0000
QR Codes:

Original text written by user:
IsPrivate?No (this computation is public)
User-defined keywords
Estimated Impact190
Family? (F = Feedback message, R = changed R code, M = changed R Module, P = changed Parameters, D = changed Data)
F     [Exercise 1.13] [Exercise 1.13 (Wo...] [2008-10-01 13:28:34] [b98453cac15ba1066b407e146608df68]
F   P     [Exercise 1.13] [Vraag 1: Result 1] [2008-10-12 09:59:32] [96c9291ce335a5c9abba7b920811c2df] [Current]
Feedback Forum
2008-10-17 14:30:41 [Matthieu Blondeau] [reply
Het is inderdaad zo dat indien er meerdere simulaties worden gemaakt dat er een andere oplossing komt die veel verschilt van het originele. Je hebt 2 simulaties gedaan om zo te kunnen vergelijken.
2008-10-18 16:15:21 [Hidde Van Kerckhoven] [reply
Inderdaad wanneer e verschillende keren de berekening maakt kom je steeds verschillende waarden uit.. Het kan hierbij mss gemakkelijk zijn, gebruik te maken van een boven en ondergrens.. Wanneer je een boven- en ondergrens toepast moet je wel meer als twee keer de berekening maken.
2008-10-19 11:56:20 [d36b523de4ee3ee201bd261839860de6] [reply
Het is duidelijk dat bij iedere reproductie die wordt uitgevoerd, dit getal varieert. Toch is het beter nog meerdere keren deze berekening te herdoen, zodanig dat je meer getallen hebt om je antwoord te staven en te concluderen dat deze oplossing niet accuraat is.
2008-10-19 13:01:01 [Kristof Augustyns] [reply
Het is inderdaad niet logisch om hierop te vertrouwen want bij elke berekening die gedaan wordt, komt men tot een ander resultaat.
Hier heb ik maar twee keer de berekening gedaan, maar misschien had ik het beter drie keer gedaan, maar na twee keer ziet men ook dat het vrij hard verschilt van mekaar.
0.117808219178082 en 0.161643835616438
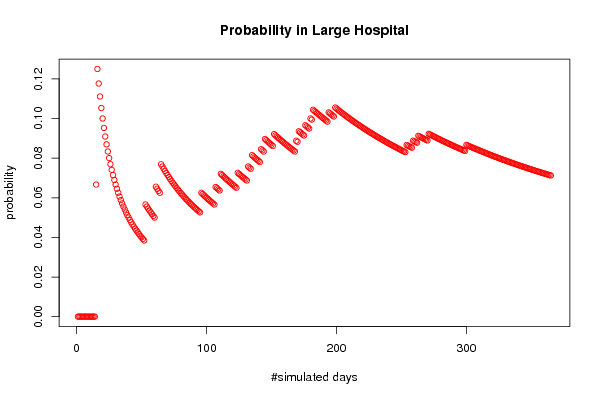
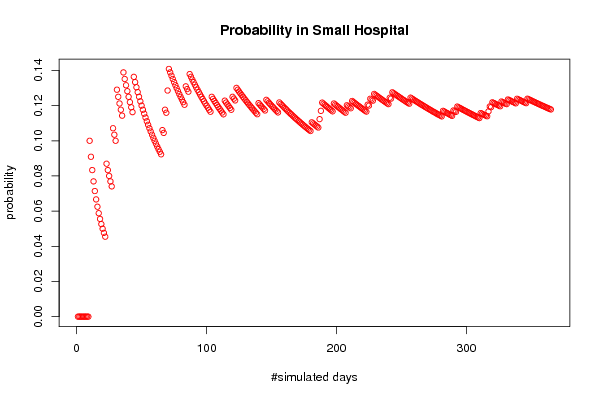
Op de grafiek zie je dat de probability veel verschilt met de simulated days.
Dit is enkel meer in het begin het geval en minder naar het einde toe.
Dit wil dus zeggen dat het bij 360 simulated days toch nog niet echt zuiver op de graag is.
Naarmate men meer days neemt, hoe minder variatie er ontstaat.
Hoe meer simulated days, Hoe minder de rode grafiek afwijkt dus hoe nauwkeuriger het is.
2008-10-19 14:55:45 [Stijn Loomans] [reply
Je hebt inderdaad de goede conclusie getrokken dat je dit meerdere keren moet berekenen(2 keer in jouw geval) om te weten te komen dat deze uitkomst niet accuraat is en verander met elke uitkomst.
2008-10-19 14:57:20 [Evelyn Ongena] [reply
De reproducties zijn correct uitgevoerd, het is echter nog beter indien je meerdere simulaties maakt, zodat je antwoord dat 16,438% niet accuraat is, beter gestaafd wordt
2008-10-19 20:14:49 [256f97d8b7c07ed49f142eff724c6520] [reply
Je hebt er 2 uitgevoerd dit is een begin, maar je hebt er best meer nodig. Je moet de oplossingen situeren dit kan je het best doen door zoveel als mogelijk berekeningen uit te voeren. Hier na kan je zeggen waartussen de oplossingen zich bevindt.

Post a new message


Summary of computational transaction
Raw Inputview raw input (R code)
Raw Outputview raw output of R engine
Computing time2 seconds
R Server'George Udny Yule' @ 72.249.76.132

\begin{tabular}{lllllllll}
\hline
Summary of computational transaction \tabularnewline
Raw Input & view raw input (R code)  \tabularnewline
Raw Output & view raw output of R engine  \tabularnewline
Computing time & 2 seconds \tabularnewline
R Server & 'George Udny Yule' @ 72.249.76.132 \tabularnewline
\hline
\end{tabular}
%Source: https://freestatistics.org/blog/index.php?pk=15404&T=0

[TABLE]
[ROW][C]Summary of computational transaction[/C][/ROW]
[ROW][C]Raw Input[/C][C]view raw input (R code) [/C][/ROW]
[ROW][C]Raw Output[/C][C]view raw output of R engine [/C][/ROW]
[ROW][C]Computing time[/C][C]2 seconds[/C][/ROW]
[ROW][C]R Server[/C][C]'George Udny Yule' @ 72.249.76.132[/C][/ROW]
[/TABLE]
Source: https://freestatistics.org/blog/index.php?pk=15404&T=0

Globally Unique Identifier (entire table): ba.freestatistics.org/blog/index.php?pk=15404&T=0

As an alternative you can also use a QR Code:  

The GUIDs for individual cells are displayed in the table below:

Summary of computational transaction
Raw Inputview raw input (R code)
Raw Outputview raw output of R engine
Computing time2 seconds
R Server'George Udny Yule' @ 72.249.76.132


Exercise 1.13 p. 14 (Introduction to Probability, 2nd ed.)
Number of simulated days365
Expected number of births in Large Hospital45
Expected number of births in Small Hospital15
Percentage of Male births per day(for which the probability is computed)0.6
#Females births in Large Hospital8288
#Males births in Large Hospital8137
#Female births in Small Hospital2812
#Male births in Small Hospital2663
Probability of more than 60 % of male births in Large Hospital0.0712328767123288
Probability of more than 60 % of male births in Small Hospital0.117808219178082
#Days per Year when more than 60 % of male births occur in Large Hospital26
#Days per Year when more than 60 % of male births occur in Small Hospital43

\begin{tabular}{lllllllll}
\hline
Exercise 1.13 p. 14 (Introduction to Probability, 2nd ed.) \tabularnewline
Number of simulated days & 365 \tabularnewline
Expected number of births in Large Hospital & 45 \tabularnewline
Expected number of births in Small Hospital & 15 \tabularnewline
Percentage of Male births per day(for which the probability is computed) & 0.6 \tabularnewline
#Females births in Large Hospital & 8288 \tabularnewline
#Males births in Large Hospital & 8137 \tabularnewline
#Female births in Small Hospital & 2812 \tabularnewline
#Male births in Small Hospital & 2663 \tabularnewline
Probability of more than 60 % of male births in Large Hospital & 0.0712328767123288 \tabularnewline
Probability of more than 60 % of male births in Small Hospital & 0.117808219178082 \tabularnewline
#Days per Year when more than 60 % of male births occur in Large Hospital & 26 \tabularnewline
#Days per Year when more than 60 % of male births occur in Small Hospital & 43 \tabularnewline
\hline
\end{tabular}
%Source: https://freestatistics.org/blog/index.php?pk=15404&T=1

[TABLE]
[ROW][C]Exercise 1.13 p. 14 (Introduction to Probability, 2nd ed.)[/C][/ROW]
[ROW][C]Number of simulated days[/C][C]365[/C][/ROW]
[ROW][C]Expected number of births in Large Hospital[/C][C]45[/C][/ROW]
[ROW][C]Expected number of births in Small Hospital[/C][C]15[/C][/ROW]
[ROW][C]Percentage of Male births per day(for which the probability is computed)[/C][C]0.6[/C][/ROW]
[ROW][C]#Females births in Large Hospital[/C][C]8288[/C][/ROW]
[ROW][C]#Males births in Large Hospital[/C][C]8137[/C][/ROW]
[ROW][C]#Female births in Small Hospital[/C][C]2812[/C][/ROW]
[ROW][C]#Male births in Small Hospital[/C][C]2663[/C][/ROW]
[ROW][C]Probability of more than 60 % of male births in Large Hospital[/C][C]0.0712328767123288[/C][/ROW]
[C]Probability of more than 60 % of male births in Small Hospital[/C][C]0.117808219178082[/C][/ROW]
[ROW][C]#Days per Year when more than 60 % of male births occur in Large Hospital[/C][C]26[/C][/ROW]
[C]#Days per Year when more than 60 % of male births occur in Small Hospital[/C][C]43[/C][/ROW]
[/TABLE]
Source: https://freestatistics.org/blog/index.php?pk=15404&T=1

Globally Unique Identifier (entire table): ba.freestatistics.org/blog/index.php?pk=15404&T=1

As an alternative you can also use a QR Code:  

The GUIDs for individual cells are displayed in the table below:

Exercise 1.13 p. 14 (Introduction to Probability, 2nd ed.)
Number of simulated days365
Expected number of births in Large Hospital45
Expected number of births in Small Hospital15
Percentage of Male births per day(for which the probability is computed)0.6
#Females births in Large Hospital8288
#Males births in Large Hospital8137
#Female births in Small Hospital2812
#Male births in Small Hospital2663
Probability of more than 60 % of male births in Large Hospital0.0712328767123288
Probability of more than 60 % of male births in Small Hospital0.117808219178082
#Days per Year when more than 60 % of male births occur in Large Hospital26
#Days per Year when more than 60 % of male births occur in Small Hospital43


Parameters (Session):
par1 = 365 ; par2 = 45 ; par3 = 15 ; par4 = 0.6 ;
Parameters (R input):
par1 = 365 ; par2 = 45 ; par3 = 15 ; par4 = 0.6 ;
R code (references can be found in the software module):
par1 <- as.numeric(par1)
par2 <- as.numeric(par2)
par3 <- as.numeric(par3)
par4 <- as.numeric(par4)
numsuccessbig <- 0
numsuccesssmall <- 0
bighospital <- array(NA,dim=c(par1,par2))
smallhospital <- array(NA,dim=c(par1,par3))
bigprob <- array(NA,dim=par1)
smallprob <- array(NA,dim=par1)
for (i in 1:par1) {
bighospital[i,] <- sample(c('F','M'),par2,replace=TRUE)
if (as.matrix(table(bighospital[i,]))[2] > par4*par2) numsuccessbig = numsuccessbig + 1
bigprob[i] <- numsuccessbig/i
smallhospital[i,] <- sample(c('F','M'),par3,replace=TRUE)
if (as.matrix(table(smallhospital[i,]))[2] > par4*par3) numsuccesssmall = numsuccesssmall + 1
smallprob[i] <- numsuccesssmall/i
}
tbig <- as.matrix(table(bighospital))
tsmall <- as.matrix(table(smallhospital))
tbig
tsmall
numsuccessbig/par1
bigprob[par1]
numsuccesssmall/par1
smallprob[par1]
numsuccessbig/par1*365
bigprob[par1]*365
numsuccesssmall/par1*365
smallprob[par1]*365
bitmap(file='test1.png')
plot(bigprob,col=2,main='Probability in Large Hospital',xlab='#simulated days',ylab='probability')
dev.off()
bitmap(file='test2.png')
plot(smallprob,col=2,main='Probability in Small Hospital',xlab='#simulated days',ylab='probability')
dev.off()
load(file='createtable')
a<-table.start()
a<-table.row.start(a)
a<-table.element(a,'Exercise 1.13 p. 14 (Introduction to Probability, 2nd ed.)',2,TRUE)
a<-table.row.end(a)
a<-table.row.start(a)
a<-table.element(a,'Number of simulated days',header=TRUE)
a<-table.element(a,par1)
a<-table.row.end(a)
a<-table.row.start(a)
a<-table.element(a,'Expected number of births in Large Hospital',header=TRUE)
a<-table.element(a,par2)
a<-table.row.end(a)
a<-table.row.start(a)
a<-table.element(a,'Expected number of births in Small Hospital',header=TRUE)
a<-table.element(a,par3)
a<-table.row.end(a)
a<-table.row.start(a)
a<-table.element(a,'Percentage of Male births per day
(for which the probability is computed)',header=TRUE)
a<-table.element(a,par4)
a<-table.row.end(a)
a<-table.row.start(a)
a<-table.element(a,'#Females births in Large Hospital',header=TRUE)
a<-table.element(a,tbig[1])
a<-table.row.end(a)
a<-table.row.start(a)
a<-table.element(a,'#Males births in Large Hospital',header=TRUE)
a<-table.element(a,tbig[2])
a<-table.row.end(a)
a<-table.row.start(a)
a<-table.element(a,'#Female births in Small Hospital',header=TRUE)
a<-table.element(a,tsmall[1])
a<-table.row.end(a)
a<-table.row.start(a)
a<-table.element(a,'#Male births in Small Hospital',header=TRUE)
a<-table.element(a,tsmall[2])
a<-table.row.end(a)
a<-table.row.start(a)
dum1 <- paste('Probability of more than', par4*100, sep=' ')
dum <- paste(dum1, '% of male births in Large Hospital', sep=' ')
a<-table.element(a, dum, header=TRUE)
a<-table.element(a, bigprob[par1])
a<-table.row.end(a)
dum <- paste(dum1, '% of male births in Small Hospital', sep=' ')
a<-table.element(a, dum, header=TRUE)
a<-table.element(a, smallprob[par1])
a<-table.row.end(a)
a<-table.row.start(a)
dum1 <- paste('#Days per Year when more than', par4*100, sep=' ')
dum <- paste(dum1, '% of male births occur in Large Hospital', sep=' ')
a<-table.element(a, dum, header=TRUE)
a<-table.element(a, bigprob[par1]*365)
a<-table.row.end(a)
dum <- paste(dum1, '% of male births occur in Small Hospital', sep=' ')
a<-table.element(a, dum, header=TRUE)
a<-table.element(a, smallprob[par1]*365)
a<-table.row.end(a)
a<-table.end(a)
table.save(a,file='mytable.tab')