Free Statistics

of Irreproducible Research!

Author's title

Author*The author of this computation has been verified*
R Software Modulerwasp_babies.wasp
Title produced by softwareExercise 1.13
Date of computationSat, 11 Oct 2008 08:07:36 -0600
Cite this page as followsStatistical Computations at FreeStatistics.org, Office for Research Development and Education, URL https://freestatistics.org/blog/index.php?v=date/2008/Oct/11/t1223734164p8v4asadkano02m.htm/, Retrieved Sun, 19 May 2024 15:25:14 +0000
Statistical Computations at FreeStatistics.org, Office for Research Development and Education, URL https://freestatistics.org/blog/index.php?pk=15322, Retrieved Sun, 19 May 2024 15:25:14 +0000
QR Codes:

Original text written by user:
IsPrivate?No (this computation is public)
User-defined keywords
Estimated Impact155
Family? (F = Feedback message, R = changed R code, M = changed R Module, P = changed Parameters, D = changed Data)
F     [Exercise 1.13] [Exercise 1.13 (Wo...] [2008-10-01 13:28:34] [b98453cac15ba1066b407e146608df68]
F R       [Exercise 1.13] [Herberekening 1] [2008-10-11 14:07:36] [a7e3b1792c54a9193ec92d9d3f5c5777] [Current]
Feedback Forum
2008-10-17 13:15:11 [Gregory Van Overmeiren] [reply
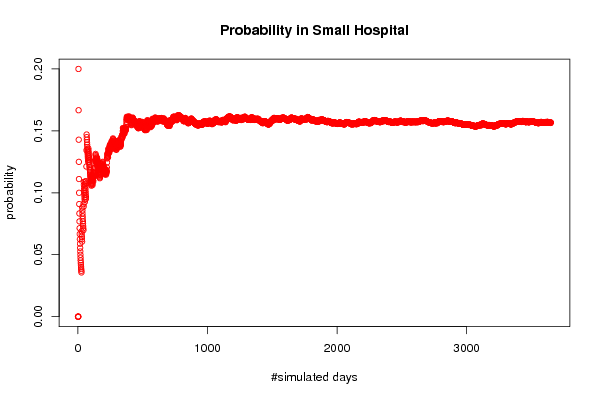
Door inderdaad de parameter te verhogen van het aantal dagen (van 365 naar 3650)verhoog je de nauwkeurigheid van je berekening. (=> wet van grote getallen)Dit is dus volledig juist.
2008-10-17 13:56:12 [Kim Huysmans] [reply
Het klopt inderdaad dat je de parameter van het aantal dagen moet veranderen, namelijk van 356 naar 3560. Zo worden de resultaten steeds nauwkeuriger want hoe meer simulaties/trekkingen men gaat uitvoeren hoe nauwkeuriger het resultaat. Zoals de student hierboven al zei, dit gaat over de wet van de grote getallen.
2008-10-20 13:55:46 [Michael Van Spaandonck] [reply
Juist is juist, dus in principe wijkt mijn commentaar niet af van die van mijn bovenstaande collega's.
Hoe groter de tijdsspanne waarin je waarneemt, hoe meer de resultaten een nauwkeurig gemiddelde opleveren. Bij een kleinere tijdsspanne en dus een kleiner aantal waarnemingen is een afwijking van grotere invloed op het gemiddelde voor de waargenomen periode , waardoor dit gemiddelde minder nauwkeurig is. Zoals mijn collega's reeds zeiden is dit de wet van grote getallen.
Conclusie: de student heeft de opgave juist geanalyseerd en onderzocht.
2008-10-20 17:53:11 [Jens Peeters] [reply
ik kan mij enkel aansluiten op wat mijn collega's hebben geformuleerd
2008-10-20 18:27:12 [Martjin De Swert] [reply
Er valt niets nieuws meer aan bovenstaande antwoorden toe te voegen.

Post a new message


Summary of computational transaction
Raw Inputview raw input (R code)
Raw Outputview raw output of R engine
Computing time5 seconds
R Server'Gwilym Jenkins' @ 72.249.127.135

\begin{tabular}{lllllllll}
\hline
Summary of computational transaction \tabularnewline
Raw Input & view raw input (R code)  \tabularnewline
Raw Output & view raw output of R engine  \tabularnewline
Computing time & 5 seconds \tabularnewline
R Server & 'Gwilym Jenkins' @ 72.249.127.135 \tabularnewline
\hline
\end{tabular}
%Source: https://freestatistics.org/blog/index.php?pk=15322&T=0

[TABLE]
[ROW][C]Summary of computational transaction[/C][/ROW]
[ROW][C]Raw Input[/C][C]view raw input (R code) [/C][/ROW]
[ROW][C]Raw Output[/C][C]view raw output of R engine [/C][/ROW]
[ROW][C]Computing time[/C][C]5 seconds[/C][/ROW]
[ROW][C]R Server[/C][C]'Gwilym Jenkins' @ 72.249.127.135[/C][/ROW]
[/TABLE]
Source: https://freestatistics.org/blog/index.php?pk=15322&T=0

Globally Unique Identifier (entire table): ba.freestatistics.org/blog/index.php?pk=15322&T=0

As an alternative you can also use a QR Code:  

The GUIDs for individual cells are displayed in the table below:

Summary of computational transaction
Raw Inputview raw input (R code)
Raw Outputview raw output of R engine
Computing time5 seconds
R Server'Gwilym Jenkins' @ 72.249.127.135


Exercise 1.13 p. 14 (Introduction to Probability, 2nd ed.)
Number of simulated days3650
Expected number of births in Large Hospital45
Expected number of births in Small Hospital15
Percentage of Male births per day(for which the probability is computed)0.6
#Females births in Large Hospital82085
#Males births in Large Hospital82165
#Female births in Small Hospital27309
#Male births in Small Hospital27441
Probability of more than 60 % of male births in Large Hospital0.0682191780821918
Probability of more than 60 % of male births in Small Hospital0.156712328767123
#Days per Year when more than 60 % of male births occur in Large Hospital24.9
#Days per Year when more than 60 % of male births occur in Small Hospital57.2

\begin{tabular}{lllllllll}
\hline
Exercise 1.13 p. 14 (Introduction to Probability, 2nd ed.) \tabularnewline
Number of simulated days & 3650 \tabularnewline
Expected number of births in Large Hospital & 45 \tabularnewline
Expected number of births in Small Hospital & 15 \tabularnewline
Percentage of Male births per day(for which the probability is computed) & 0.6 \tabularnewline
#Females births in Large Hospital & 82085 \tabularnewline
#Males births in Large Hospital & 82165 \tabularnewline
#Female births in Small Hospital & 27309 \tabularnewline
#Male births in Small Hospital & 27441 \tabularnewline
Probability of more than 60 % of male births in Large Hospital & 0.0682191780821918 \tabularnewline
Probability of more than 60 % of male births in Small Hospital & 0.156712328767123 \tabularnewline
#Days per Year when more than 60 % of male births occur in Large Hospital & 24.9 \tabularnewline
#Days per Year when more than 60 % of male births occur in Small Hospital & 57.2 \tabularnewline
\hline
\end{tabular}
%Source: https://freestatistics.org/blog/index.php?pk=15322&T=1

[TABLE]
[ROW][C]Exercise 1.13 p. 14 (Introduction to Probability, 2nd ed.)[/C][/ROW]
[ROW][C]Number of simulated days[/C][C]3650[/C][/ROW]
[ROW][C]Expected number of births in Large Hospital[/C][C]45[/C][/ROW]
[ROW][C]Expected number of births in Small Hospital[/C][C]15[/C][/ROW]
[ROW][C]Percentage of Male births per day(for which the probability is computed)[/C][C]0.6[/C][/ROW]
[ROW][C]#Females births in Large Hospital[/C][C]82085[/C][/ROW]
[ROW][C]#Males births in Large Hospital[/C][C]82165[/C][/ROW]
[ROW][C]#Female births in Small Hospital[/C][C]27309[/C][/ROW]
[ROW][C]#Male births in Small Hospital[/C][C]27441[/C][/ROW]
[ROW][C]Probability of more than 60 % of male births in Large Hospital[/C][C]0.0682191780821918[/C][/ROW]
[C]Probability of more than 60 % of male births in Small Hospital[/C][C]0.156712328767123[/C][/ROW]
[ROW][C]#Days per Year when more than 60 % of male births occur in Large Hospital[/C][C]24.9[/C][/ROW]
[C]#Days per Year when more than 60 % of male births occur in Small Hospital[/C][C]57.2[/C][/ROW]
[/TABLE]
Source: https://freestatistics.org/blog/index.php?pk=15322&T=1

Globally Unique Identifier (entire table): ba.freestatistics.org/blog/index.php?pk=15322&T=1

As an alternative you can also use a QR Code:  

The GUIDs for individual cells are displayed in the table below:

Exercise 1.13 p. 14 (Introduction to Probability, 2nd ed.)
Number of simulated days3650
Expected number of births in Large Hospital45
Expected number of births in Small Hospital15
Percentage of Male births per day(for which the probability is computed)0.6
#Females births in Large Hospital82085
#Males births in Large Hospital82165
#Female births in Small Hospital27309
#Male births in Small Hospital27441
Probability of more than 60 % of male births in Large Hospital0.0682191780821918
Probability of more than 60 % of male births in Small Hospital0.156712328767123
#Days per Year when more than 60 % of male births occur in Large Hospital24.9
#Days per Year when more than 60 % of male births occur in Small Hospital57.2


Parameters (Session):
par1 = 3650 ; par2 = 45 ; par3 = 15 ; par4 = 0.6 ;
Parameters (R input):
par1 = 3650 ; par2 = 45 ; par3 = 15 ; par4 = 0.6 ;
R code (references can be found in the software module):
par1 <- as.numeric(par1)
par2 <- as.numeric(par2)
par3 <- as.numeric(par3)
par4 <- as.numeric(par4)
numsuccessbig <- 0
numsuccesssmall <- 0
bighospital <- array(NA,dim=c(par1,par2))
smallhospital <- array(NA,dim=c(par1,par3))
bigprob <- array(NA,dim=par1)
smallprob <- array(NA,dim=par1)
for (i in 1:par1) {
bighospital[i,] <- sample(c('F','M'),par2,replace=TRUE)
if (as.matrix(table(bighospital[i,]))[2] > par4*par2) numsuccessbig = numsuccessbig + 1
bigprob[i] <- numsuccessbig/i
smallhospital[i,] <- sample(c('F','M'),par3,replace=TRUE)
if (as.matrix(table(smallhospital[i,]))[2] > par4*par3) numsuccesssmall = numsuccesssmall + 1
smallprob[i] <- numsuccesssmall/i
}
tbig <- as.matrix(table(bighospital))
tsmall <- as.matrix(table(smallhospital))
tbig
tsmall
numsuccessbig/par1
bigprob[par1]
numsuccesssmall/par1
smallprob[par1]
numsuccessbig/par1*365
bigprob[par1]*365
numsuccesssmall/par1*365
smallprob[par1]*365
bitmap(file='test1.png')
plot(bigprob,col=2,main='Probability in Large Hospital',xlab='#simulated days',ylab='probability')
dev.off()
bitmap(file='test2.png')
plot(smallprob,col=2,main='Probability in Small Hospital',xlab='#simulated days',ylab='probability')
dev.off()
load(file='createtable')
a<-table.start()
a<-table.row.start(a)
a<-table.element(a,'Exercise 1.13 p. 14 (Introduction to Probability, 2nd ed.)',2,TRUE)
a<-table.row.end(a)
a<-table.row.start(a)
a<-table.element(a,'Number of simulated days',header=TRUE)
a<-table.element(a,par1)
a<-table.row.end(a)
a<-table.row.start(a)
a<-table.element(a,'Expected number of births in Large Hospital',header=TRUE)
a<-table.element(a,par2)
a<-table.row.end(a)
a<-table.row.start(a)
a<-table.element(a,'Expected number of births in Small Hospital',header=TRUE)
a<-table.element(a,par3)
a<-table.row.end(a)
a<-table.row.start(a)
a<-table.element(a,'Percentage of Male births per day
(for which the probability is computed)',header=TRUE)
a<-table.element(a,par4)
a<-table.row.end(a)
a<-table.row.start(a)
a<-table.element(a,'#Females births in Large Hospital',header=TRUE)
a<-table.element(a,tbig[1])
a<-table.row.end(a)
a<-table.row.start(a)
a<-table.element(a,'#Males births in Large Hospital',header=TRUE)
a<-table.element(a,tbig[2])
a<-table.row.end(a)
a<-table.row.start(a)
a<-table.element(a,'#Female births in Small Hospital',header=TRUE)
a<-table.element(a,tsmall[1])
a<-table.row.end(a)
a<-table.row.start(a)
a<-table.element(a,'#Male births in Small Hospital',header=TRUE)
a<-table.element(a,tsmall[2])
a<-table.row.end(a)
a<-table.row.start(a)
dum1 <- paste('Probability of more than', par4*100, sep=' ')
dum <- paste(dum1, '% of male births in Large Hospital', sep=' ')
a<-table.element(a, dum, header=TRUE)
a<-table.element(a, bigprob[par1])
a<-table.row.end(a)
dum <- paste(dum1, '% of male births in Small Hospital', sep=' ')
a<-table.element(a, dum, header=TRUE)
a<-table.element(a, smallprob[par1])
a<-table.row.end(a)
a<-table.row.start(a)
dum1 <- paste('#Days per Year when more than', par4*100, sep=' ')
dum <- paste(dum1, '% of male births occur in Large Hospital', sep=' ')
a<-table.element(a, dum, header=TRUE)
a<-table.element(a, bigprob[par1]*365)
a<-table.row.end(a)
dum <- paste(dum1, '% of male births occur in Small Hospital', sep=' ')
a<-table.element(a, dum, header=TRUE)
a<-table.element(a, smallprob[par1]*365)
a<-table.row.end(a)
a<-table.end(a)
table.save(a,file='mytable.tab')