Free Statistics

of Irreproducible Research!

Author's title

Author*Unverified author*
R Software Modulerwasp_babies.wasp
Title produced by softwareExercise 1.13
Date of computationFri, 10 Oct 2008 09:24:20 -0600
Cite this page as followsStatistical Computations at FreeStatistics.org, Office for Research Development and Education, URL https://freestatistics.org/blog/index.php?v=date/2008/Oct/10/t1223652389wae616qh8aqxlca.htm/, Retrieved Sun, 19 May 2024 18:48:46 +0000
Statistical Computations at FreeStatistics.org, Office for Research Development and Education, URL https://freestatistics.org/blog/index.php?pk=15248, Retrieved Sun, 19 May 2024 18:48:46 +0000
QR Codes:

Original text written by user:
IsPrivate?No (this computation is public)
User-defined keywords
Estimated Impact169
Family? (F = Feedback message, R = changed R code, M = changed R Module, P = changed Parameters, D = changed Data)
F     [Exercise 1.13] [Exercise 1.13 (Wo...] [2008-10-01 13:28:34] [b98453cac15ba1066b407e146608df68]
F R P     [Exercise 1.13] [Babies <0.6] [2008-10-10 15:24:20] [d41d8cd98f00b204e9800998ecf8427e] [Current]
Feedback Forum
2008-10-16 17:36:21 [Christophe Goddaert] [reply
Dit is de juiste oplossing op de laatste vraag.De R-code voor de berekening is juist aangepast. De assen moesten ook nog vertaald worden en de grafieklabels veranders (more==>less)zie:Oplossing:
dum1 <- paste('Probability of more less than', par4*100, sep=' ')
analoog voor het 2e ziekenhuis
Vertaling assen grafiek:
plot(bigprob,col=2,main=Waarschijnlijkheid in groot ziekenhuis',xlab='#gesimuleerde dagen,ylab='Waarschijnlijkheid')

plot(smallprob,col=2,main=Waarschijnlijkheid in klein ziekenhuis',xlab='#Gesimuleerde dagen,ylab='Waarschijnlijkheid')
2008-10-17 10:18:33 [Bas van Keken] [reply
Voor zover ik kan zien is dit wel juist uitgevoerd.
2008-10-17 14:49:28 [Kim Huysmans] [reply
Volgens mij is deze berekening ook correct uitgevoerd. Deze student heeft het 'groter dan' teken vervangen door het 'kleiner dan' teken zodat zowel de tekst als de berekining veranderen. De vertaling van de assen en de grafieklabels staan uitgelegd in zijn word document en niet in de R code.
2008-10-18 11:19:11 [Ellen Smolders] [reply
Het antwoord is correct. Voor het juiste resultaat te bekomen moesten er 4 wijzigingen worden uitgevoerd:
- 2x de veranderingen van het 'groter teken' in het 'kleiner' teken: dit veranderde de berekeningen
- 2x het woord 'more' naar 'less' veranderen, zodat de grafiek juist kan worden afgelezen.
2008-10-19 09:45:07 [Carl Heselmans] [reply
De berekeningen zijn correct. Het veranderen van de titels vind ik persoonlijk niet belangrijk aangezien wij de opdracht ook in het engels krijgen. Daarbij komt nog dat het hier over de berekeningen zelf gaat en die is volledig correct, zowel in R code heeft hij het gelijkheidsteken aangepast en ook in de tekst heeft hij less gebruikt
2008-10-19 16:57:28 [Yara Van Overstraeten] [reply
De gegeven oplossing hier is volledig juist.
De student heeft in de R-code het > teken veranderd in een < teken.
Hij heeft hierbij ook nog eens de titels veranderd van more naar less om een volledige correctheid te bekomen van de resultaten.
Deze verandering in de tekst is niet cruciaal, maar het is een goede manier om zo geen verwarring te hebben bij het lezen van de tabel.
2008-10-19 20:45:11 [Stéphanie Thijs] [reply
Enkel het vertalen van de grafiektitels in de R-code ontbreekt.
2008-10-20 16:39:20 [Dorien Janssens] [reply
De student heeft inderdaad de R-code correct veranderd om na te gaan waar er het meeste kans was dat minder dan 60% van de geboortes jongens zouden zijn.
Ook het woord 'more' is via de code in 'less' gewijzigd. Wat ontbreekt is echter een vertaling van de grafiektitels. Dit werd wel besproken in het Word-document maar niet aangebracht in de R-code.

Volgende wijziging had moeten gebeuren:
Oorspronkelijke tekst:
plot(bigprob,col=2,main='Probability in Large Hospital',xlab='#simulated days',ylab='probability')
dev.off()

Oplossing:
plot(bigprob,col=2,main='Waarschijnlijkheid in het grote ziekenhuis',xlab='#simulated days',ylab='probability')
dev.off()

Zelfde voor het kleine ziekenhuis.
2008-10-20 17:30:33 [Jeroen Aerts] [reply
De geblogde berekening is volledig juist, de student toont dus aan dat hij/zij de R-code begrijpt.
Enkel kon ze nog wel de grafiektitels wijzigen in de R code om de grafieken te verduidelijken.
2008-10-20 18:23:18 [Martjin De Swert] [reply
Berekeningen zijn correct maar het is niet na te trekken of de student deze zelf gemaakt heeft.

Post a new message


Summary of computational transaction
Raw Inputview raw input (R code)
Raw Outputview raw output of R engine
Computing time2 seconds
R Server'George Udny Yule' @ 72.249.76.132

\begin{tabular}{lllllllll}
\hline
Summary of computational transaction \tabularnewline
Raw Input & view raw input (R code)  \tabularnewline
Raw Output & view raw output of R engine  \tabularnewline
Computing time & 2 seconds \tabularnewline
R Server & 'George Udny Yule' @ 72.249.76.132 \tabularnewline
\hline
\end{tabular}
%Source: https://freestatistics.org/blog/index.php?pk=15248&T=0

[TABLE]
[ROW][C]Summary of computational transaction[/C][/ROW]
[ROW][C]Raw Input[/C][C]view raw input (R code) [/C][/ROW]
[ROW][C]Raw Output[/C][C]view raw output of R engine [/C][/ROW]
[ROW][C]Computing time[/C][C]2 seconds[/C][/ROW]
[ROW][C]R Server[/C][C]'George Udny Yule' @ 72.249.76.132[/C][/ROW]
[/TABLE]
Source: https://freestatistics.org/blog/index.php?pk=15248&T=0

Globally Unique Identifier (entire table): ba.freestatistics.org/blog/index.php?pk=15248&T=0

As an alternative you can also use a QR Code:  

The GUIDs for individual cells are displayed in the table below:

Summary of computational transaction
Raw Inputview raw input (R code)
Raw Outputview raw output of R engine
Computing time2 seconds
R Server'George Udny Yule' @ 72.249.76.132


Exercise 1.13 p. 14 (Introduction to Probability, 2nd ed.)
Number of simulated days365
Expected number of births in Large Hospital45
Expected number of births in Small Hospital15
Percentage of Male births per day(for which the probability is computed)0.6
#Females births in Large Hospital8249
#Males births in Large Hospital8176
#Female births in Small Hospital2756
#Male births in Small Hospital2719
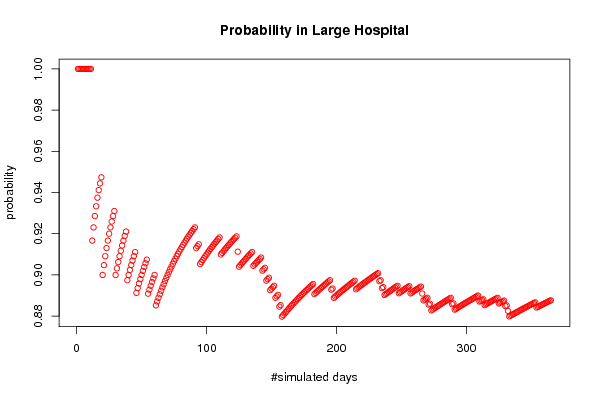
Probability of less than 60 % of male births in Large Hospital0.887671232876712
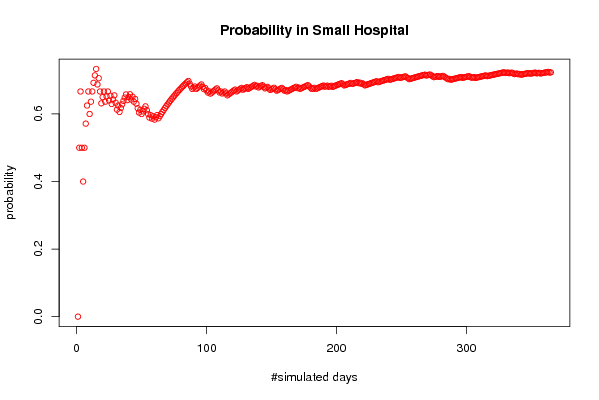
Probability of less than 60 % of male births in Small Hospital0.723287671232877
#Days per Year when less than 60 % of male births occur in Large Hospital324
#Days per Year when less than 60 % of male births occur in Small Hospital264

\begin{tabular}{lllllllll}
\hline
Exercise 1.13 p. 14 (Introduction to Probability, 2nd ed.) \tabularnewline
Number of simulated days & 365 \tabularnewline
Expected number of births in Large Hospital & 45 \tabularnewline
Expected number of births in Small Hospital & 15 \tabularnewline
Percentage of Male births per day(for which the probability is computed) & 0.6 \tabularnewline
#Females births in Large Hospital & 8249 \tabularnewline
#Males births in Large Hospital & 8176 \tabularnewline
#Female births in Small Hospital & 2756 \tabularnewline
#Male births in Small Hospital & 2719 \tabularnewline
Probability of less than 60 % of male births in Large Hospital & 0.887671232876712 \tabularnewline
Probability of less than 60 % of male births in Small Hospital & 0.723287671232877 \tabularnewline
#Days per Year when less than 60 % of male births occur in Large Hospital & 324 \tabularnewline
#Days per Year when less than 60 % of male births occur in Small Hospital & 264 \tabularnewline
\hline
\end{tabular}
%Source: https://freestatistics.org/blog/index.php?pk=15248&T=1

[TABLE]
[ROW][C]Exercise 1.13 p. 14 (Introduction to Probability, 2nd ed.)[/C][/ROW]
[ROW][C]Number of simulated days[/C][C]365[/C][/ROW]
[ROW][C]Expected number of births in Large Hospital[/C][C]45[/C][/ROW]
[ROW][C]Expected number of births in Small Hospital[/C][C]15[/C][/ROW]
[ROW][C]Percentage of Male births per day(for which the probability is computed)[/C][C]0.6[/C][/ROW]
[ROW][C]#Females births in Large Hospital[/C][C]8249[/C][/ROW]
[ROW][C]#Males births in Large Hospital[/C][C]8176[/C][/ROW]
[ROW][C]#Female births in Small Hospital[/C][C]2756[/C][/ROW]
[ROW][C]#Male births in Small Hospital[/C][C]2719[/C][/ROW]
[ROW][C]Probability of less than 60 % of male births in Large Hospital[/C][C]0.887671232876712[/C][/ROW]
[C]Probability of less than 60 % of male births in Small Hospital[/C][C]0.723287671232877[/C][/ROW]
[ROW][C]#Days per Year when less than 60 % of male births occur in Large Hospital[/C][C]324[/C][/ROW]
[C]#Days per Year when less than 60 % of male births occur in Small Hospital[/C][C]264[/C][/ROW]
[/TABLE]
Source: https://freestatistics.org/blog/index.php?pk=15248&T=1

Globally Unique Identifier (entire table): ba.freestatistics.org/blog/index.php?pk=15248&T=1

As an alternative you can also use a QR Code:  

The GUIDs for individual cells are displayed in the table below:

Exercise 1.13 p. 14 (Introduction to Probability, 2nd ed.)
Number of simulated days365
Expected number of births in Large Hospital45
Expected number of births in Small Hospital15
Percentage of Male births per day(for which the probability is computed)0.6
#Females births in Large Hospital8249
#Males births in Large Hospital8176
#Female births in Small Hospital2756
#Male births in Small Hospital2719
Probability of less than 60 % of male births in Large Hospital0.887671232876712
Probability of less than 60 % of male births in Small Hospital0.723287671232877
#Days per Year when less than 60 % of male births occur in Large Hospital324
#Days per Year when less than 60 % of male births occur in Small Hospital264


Parameters (Session):
par1 = 365 ; par2 = 45 ; par3 = 15 ; par4 = 0.8 ;
Parameters (R input):
par1 = 365 ; par2 = 45 ; par3 = 15 ; par4 = 0.6 ;
R code (references can be found in the software module):
par1 <- as.numeric(par1)
par2 <- as.numeric(par2)
par3 <- as.numeric(par3)
par4 <- as.numeric(par4)
numsuccessbig <- 0
numsuccesssmall <- 0
bighospital <- array(NA,dim=c(par1,par2))
smallhospital <- array(NA,dim=c(par1,par3))
bigprob <- array(NA,dim=par1)
smallprob <- array(NA,dim=par1)
for (i in 1:par1) {
bighospital[i,] <- sample(c('F','M'),par2,replace=TRUE)
if (as.matrix(table(bighospital[i,]))[2] < par4*par2) numsuccessbig = numsuccessbig + 1
bigprob[i] <- numsuccessbig/i
smallhospital[i,] <- sample(c('F','M'),par3,replace=TRUE)
if (as.matrix(table(smallhospital[i,]))[2] < par4*par3) numsuccesssmall = numsuccesssmall + 1
smallprob[i] <- numsuccesssmall/i
}
tbig <- as.matrix(table(bighospital))
tsmall <- as.matrix(table(smallhospital))
tbig
tsmall
numsuccessbig/par1
bigprob[par1]
numsuccesssmall/par1
smallprob[par1]
numsuccessbig/par1*365
bigprob[par1]*365
numsuccesssmall/par1*365
smallprob[par1]*365
bitmap(file='test1.png')
plot(bigprob,col=2,main='Probability in Large Hospital',xlab='#simulated days',ylab='probability')
dev.off()
bitmap(file='test2.png')
plot(smallprob,col=2,main='Probability in Small Hospital',xlab='#simulated days',ylab='probability')
dev.off()
load(file='createtable')
a<-table.start()
a<-table.row.start(a)
a<-table.element(a,'Exercise 1.13 p. 14 (Introduction to Probability, 2nd ed.)',2,TRUE)
a<-table.row.end(a)
a<-table.row.start(a)
a<-table.element(a,'Number of simulated days',header=TRUE)
a<-table.element(a,par1)
a<-table.row.end(a)
a<-table.row.start(a)
a<-table.element(a,'Expected number of births in Large Hospital',header=TRUE)
a<-table.element(a,par2)
a<-table.row.end(a)
a<-table.row.start(a)
a<-table.element(a,'Expected number of births in Small Hospital',header=TRUE)
a<-table.element(a,par3)
a<-table.row.end(a)
a<-table.row.start(a)
a<-table.element(a,'Percentage of Male births per day
(for which the probability is computed)',header=TRUE)
a<-table.element(a,par4)
a<-table.row.end(a)
a<-table.row.start(a)
a<-table.element(a,'#Females births in Large Hospital',header=TRUE)
a<-table.element(a,tbig[1])
a<-table.row.end(a)
a<-table.row.start(a)
a<-table.element(a,'#Males births in Large Hospital',header=TRUE)
a<-table.element(a,tbig[2])
a<-table.row.end(a)
a<-table.row.start(a)
a<-table.element(a,'#Female births in Small Hospital',header=TRUE)
a<-table.element(a,tsmall[1])
a<-table.row.end(a)
a<-table.row.start(a)
a<-table.element(a,'#Male births in Small Hospital',header=TRUE)
a<-table.element(a,tsmall[2])
a<-table.row.end(a)
a<-table.row.start(a)
dum1 <- paste('Probability of less than', par4*100, sep=' ')
dum <- paste(dum1, '% of male births in Large Hospital', sep=' ')
a<-table.element(a, dum, header=TRUE)
a<-table.element(a, bigprob[par1])
a<-table.row.end(a)
dum <- paste(dum1, '% of male births in Small Hospital', sep=' ')
a<-table.element(a, dum, header=TRUE)
a<-table.element(a, smallprob[par1])
a<-table.row.end(a)
a<-table.row.start(a)
dum1 <- paste('#Days per Year when less than', par4*100, sep=' ')
dum <- paste(dum1, '% of male births occur in Large Hospital', sep=' ')
a<-table.element(a, dum, header=TRUE)
a<-table.element(a, bigprob[par1]*365)
a<-table.row.end(a)
dum <- paste(dum1, '% of male births occur in Small Hospital', sep=' ')
a<-table.element(a, dum, header=TRUE)
a<-table.element(a, smallprob[par1]*365)
a<-table.row.end(a)
a<-table.end(a)
table.save(a,file='mytable.tab')