Free Statistics

of Irreproducible Research!

Author's title

Author*Unverified author*
R Software Modulerwasp_babies.wasp
Title produced by softwareExercise 1.13
Date of computationFri, 10 Oct 2008 09:04:30 -0600
Cite this page as followsStatistical Computations at FreeStatistics.org, Office for Research Development and Education, URL https://freestatistics.org/blog/index.php?v=date/2008/Oct/10/t122365110199r2obw2qv540cc.htm/, Retrieved Sun, 19 May 2024 17:13:19 +0000
Statistical Computations at FreeStatistics.org, Office for Research Development and Education, URL https://freestatistics.org/blog/index.php?pk=15246, Retrieved Sun, 19 May 2024 17:13:19 +0000
QR Codes:

Original text written by user:
IsPrivate?No (this computation is public)
User-defined keywords
Estimated Impact185
Family? (F = Feedback message, R = changed R code, M = changed R Module, P = changed Parameters, D = changed Data)
F     [Exercise 1.13] [Exercise 1.13 (Wo...] [2008-10-01 13:28:34] [b98453cac15ba1066b407e146608df68]
F   P     [Exercise 1.13] [Babies 0.8] [2008-10-10 15:04:30] [d41d8cd98f00b204e9800998ecf8427e] [Current]
-           [Exercise 1.13] [Verbetering: 80% ...] [2008-10-18 11:04:00] [b85eb1eb4b13b870c6e7ebbba3e34fcc]
Feedback Forum
2008-10-15 11:35:44 [Ed Van Stee] [reply
test
2008-10-17 10:14:49 [Bas van Keken] [reply
Goed dat u de periode op 10 jaar heeft gelaten.
2008-10-17 15:02:56 [Kim Huysmans] [reply
Inderdaad door het aantal dagen op 3650 te laten staan bekom je een nauwkeuriger resultaat (wet van de grote getallen).
2008-10-18 11:06:57 [e117fb22a86bc68899e345062e1db29a] [reply
De student heeft opnieuw de tijdspanne van de steekproef van 365 dagen verlengt naar 3650 dagen. Dit is een goed idee doordat zijn resultaten opnieuw zeer nauwkeurig zullen zijn. Het antwoord is correct. In het kleine ziekenhuis bedraagt de kans dat er meer dan 80% van de geboortes jongens zullen zijn slechts 0.3%. Dit werd reeds bewezen in deze link: http://www.freestatistics.org/blog/index.php?v=date/2008/Oct/10/t122365110199r2obw2qv540cc.htm
Ook klopt de redenering wanneer de student zegt dat de waarschijnlijkheid in het grote ziekenhuis 0% bedraagt, omdat hier de steekproef groter is, dus de waarschijnlijkheid zal nog minder bedragen.

Ter illustratie heb ik dezelfde bovenstaande waarschijnlijkheid berekend, maar toch voor 365 dagen: http://www.freestatistics.org/blog/index.php?v=date/2008/Oct/18/t1224327993uzd4rnaxn293a6v.htm
Dit geeft uiteraard ongeveer hetzelfde resultaat, de waarschijnlijkheid is hier zelfs 0%.
2008-10-19 16:48:19 [Yara Van Overstraeten] [reply
Deze student heeft hier de kans dat meer dan 60% van de geboortes mannelijk zijn verhoogt naar 80% zoals gevraagd in de opgave. Hij/zij heeft ook het aantal dagen van simulaties verhoogt van 365 naar 3650 dagen om een correcter resultaat te bekomen zoals hij in de eerste vraag had besloten. Hij komt tot de conclusie dat de kans op meer dan 80% mannelijke geboortes in het kleine ziekenhuis zeer klein is, wat een correct antwoord is.
2008-10-20 17:20:43 [Jeroen Aerts] [reply
De oplossing klopt volledig. De oplossing nader inderdaad de 0. De student heeft dit aangetoond op een tijdspanne van 10 jaar, wat meteen de nauwkeurigheid van haar oplossing verhoogd. Opmerking: indien zij meer dan 1X de oplossing had berekend had de student nog kunnen vermelden dat je waarschijnlijk een paar keer 0% zal uitkomen.

Post a new message


Summary of computational transaction
Raw Inputview raw input (R code)
Raw Outputview raw output of R engine
Computing time4 seconds
R Server'Gwilym Jenkins' @ 72.249.127.135

\begin{tabular}{lllllllll}
\hline
Summary of computational transaction \tabularnewline
Raw Input & view raw input (R code)  \tabularnewline
Raw Output & view raw output of R engine  \tabularnewline
Computing time & 4 seconds \tabularnewline
R Server & 'Gwilym Jenkins' @ 72.249.127.135 \tabularnewline
\hline
\end{tabular}
%Source: https://freestatistics.org/blog/index.php?pk=15246&T=0

[TABLE]
[ROW][C]Summary of computational transaction[/C][/ROW]
[ROW][C]Raw Input[/C][C]view raw input (R code) [/C][/ROW]
[ROW][C]Raw Output[/C][C]view raw output of R engine [/C][/ROW]
[ROW][C]Computing time[/C][C]4 seconds[/C][/ROW]
[ROW][C]R Server[/C][C]'Gwilym Jenkins' @ 72.249.127.135[/C][/ROW]
[/TABLE]
Source: https://freestatistics.org/blog/index.php?pk=15246&T=0

Globally Unique Identifier (entire table): ba.freestatistics.org/blog/index.php?pk=15246&T=0

As an alternative you can also use a QR Code:  

The GUIDs for individual cells are displayed in the table below:

Summary of computational transaction
Raw Inputview raw input (R code)
Raw Outputview raw output of R engine
Computing time4 seconds
R Server'Gwilym Jenkins' @ 72.249.127.135


Exercise 1.13 p. 14 (Introduction to Probability, 2nd ed.)
Number of simulated days3650
Expected number of births in Large Hospital45
Expected number of births in Small Hospital15
Percentage of Male births per day(for which the probability is computed)0.8
#Females births in Large Hospital82194
#Males births in Large Hospital82056
#Female births in Small Hospital27491
#Male births in Small Hospital27259
Probability of more than 80 % of male births in Large Hospital0
Probability of more than 80 % of male births in Small Hospital0.00301369863013699
#Days per Year when more than 80 % of male births occur in Large Hospital0
#Days per Year when more than 80 % of male births occur in Small Hospital1.1

\begin{tabular}{lllllllll}
\hline
Exercise 1.13 p. 14 (Introduction to Probability, 2nd ed.) \tabularnewline
Number of simulated days & 3650 \tabularnewline
Expected number of births in Large Hospital & 45 \tabularnewline
Expected number of births in Small Hospital & 15 \tabularnewline
Percentage of Male births per day(for which the probability is computed) & 0.8 \tabularnewline
#Females births in Large Hospital & 82194 \tabularnewline
#Males births in Large Hospital & 82056 \tabularnewline
#Female births in Small Hospital & 27491 \tabularnewline
#Male births in Small Hospital & 27259 \tabularnewline
Probability of more than 80 % of male births in Large Hospital & 0 \tabularnewline
Probability of more than 80 % of male births in Small Hospital & 0.00301369863013699 \tabularnewline
#Days per Year when more than 80 % of male births occur in Large Hospital & 0 \tabularnewline
#Days per Year when more than 80 % of male births occur in Small Hospital & 1.1 \tabularnewline
\hline
\end{tabular}
%Source: https://freestatistics.org/blog/index.php?pk=15246&T=1

[TABLE]
[ROW][C]Exercise 1.13 p. 14 (Introduction to Probability, 2nd ed.)[/C][/ROW]
[ROW][C]Number of simulated days[/C][C]3650[/C][/ROW]
[ROW][C]Expected number of births in Large Hospital[/C][C]45[/C][/ROW]
[ROW][C]Expected number of births in Small Hospital[/C][C]15[/C][/ROW]
[ROW][C]Percentage of Male births per day(for which the probability is computed)[/C][C]0.8[/C][/ROW]
[ROW][C]#Females births in Large Hospital[/C][C]82194[/C][/ROW]
[ROW][C]#Males births in Large Hospital[/C][C]82056[/C][/ROW]
[ROW][C]#Female births in Small Hospital[/C][C]27491[/C][/ROW]
[ROW][C]#Male births in Small Hospital[/C][C]27259[/C][/ROW]
[ROW][C]Probability of more than 80 % of male births in Large Hospital[/C][C]0[/C][/ROW]
[C]Probability of more than 80 % of male births in Small Hospital[/C][C]0.00301369863013699[/C][/ROW]
[ROW][C]#Days per Year when more than 80 % of male births occur in Large Hospital[/C][C]0[/C][/ROW]
[C]#Days per Year when more than 80 % of male births occur in Small Hospital[/C][C]1.1[/C][/ROW]
[/TABLE]
Source: https://freestatistics.org/blog/index.php?pk=15246&T=1

Globally Unique Identifier (entire table): ba.freestatistics.org/blog/index.php?pk=15246&T=1

As an alternative you can also use a QR Code:  

The GUIDs for individual cells are displayed in the table below:

Exercise 1.13 p. 14 (Introduction to Probability, 2nd ed.)
Number of simulated days3650
Expected number of births in Large Hospital45
Expected number of births in Small Hospital15
Percentage of Male births per day(for which the probability is computed)0.8
#Females births in Large Hospital82194
#Males births in Large Hospital82056
#Female births in Small Hospital27491
#Male births in Small Hospital27259
Probability of more than 80 % of male births in Large Hospital0
Probability of more than 80 % of male births in Small Hospital0.00301369863013699
#Days per Year when more than 80 % of male births occur in Large Hospital0
#Days per Year when more than 80 % of male births occur in Small Hospital1.1


Parameters (Session):
par1 = 365 ; par2 = 45 ; par3 = 15 ; par4 = 0.8 ;
Parameters (R input):
par1 = 3650 ; par2 = 45 ; par3 = 15 ; par4 = 0.8 ;
R code (references can be found in the software module):
par1 <- as.numeric(par1)
par2 <- as.numeric(par2)
par3 <- as.numeric(par3)
par4 <- as.numeric(par4)
numsuccessbig <- 0
numsuccesssmall <- 0
bighospital <- array(NA,dim=c(par1,par2))
smallhospital <- array(NA,dim=c(par1,par3))
bigprob <- array(NA,dim=par1)
smallprob <- array(NA,dim=par1)
for (i in 1:par1) {
bighospital[i,] <- sample(c('F','M'),par2,replace=TRUE)
if (as.matrix(table(bighospital[i,]))[2] > par4*par2) numsuccessbig = numsuccessbig + 1
bigprob[i] <- numsuccessbig/i
smallhospital[i,] <- sample(c('F','M'),par3,replace=TRUE)
if (as.matrix(table(smallhospital[i,]))[2] > par4*par3) numsuccesssmall = numsuccesssmall + 1
smallprob[i] <- numsuccesssmall/i
}
tbig <- as.matrix(table(bighospital))
tsmall <- as.matrix(table(smallhospital))
tbig
tsmall
numsuccessbig/par1
bigprob[par1]
numsuccesssmall/par1
smallprob[par1]
numsuccessbig/par1*365
bigprob[par1]*365
numsuccesssmall/par1*365
smallprob[par1]*365
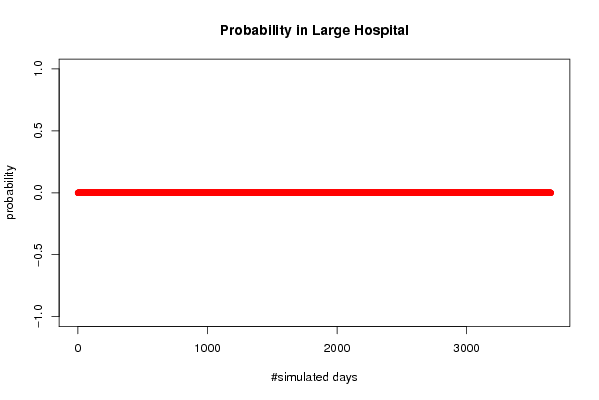
bitmap(file='test1.png')
plot(bigprob,col=2,main='Probability in Large Hospital',xlab='#simulated days',ylab='probability')
dev.off()
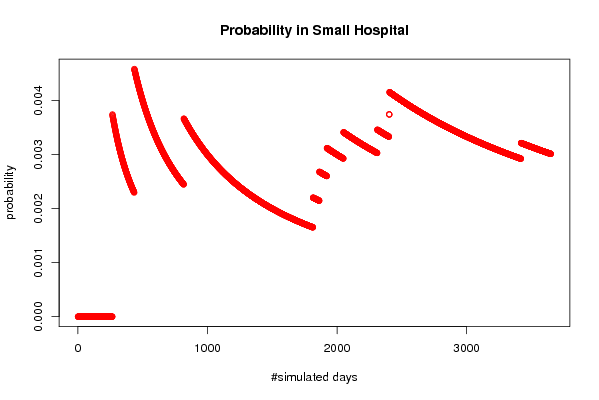
bitmap(file='test2.png')
plot(smallprob,col=2,main='Probability in Small Hospital',xlab='#simulated days',ylab='probability')
dev.off()
load(file='createtable')
a<-table.start()
a<-table.row.start(a)
a<-table.element(a,'Exercise 1.13 p. 14 (Introduction to Probability, 2nd ed.)',2,TRUE)
a<-table.row.end(a)
a<-table.row.start(a)
a<-table.element(a,'Number of simulated days',header=TRUE)
a<-table.element(a,par1)
a<-table.row.end(a)
a<-table.row.start(a)
a<-table.element(a,'Expected number of births in Large Hospital',header=TRUE)
a<-table.element(a,par2)
a<-table.row.end(a)
a<-table.row.start(a)
a<-table.element(a,'Expected number of births in Small Hospital',header=TRUE)
a<-table.element(a,par3)
a<-table.row.end(a)
a<-table.row.start(a)
a<-table.element(a,'Percentage of Male births per day
(for which the probability is computed)',header=TRUE)
a<-table.element(a,par4)
a<-table.row.end(a)
a<-table.row.start(a)
a<-table.element(a,'#Females births in Large Hospital',header=TRUE)
a<-table.element(a,tbig[1])
a<-table.row.end(a)
a<-table.row.start(a)
a<-table.element(a,'#Males births in Large Hospital',header=TRUE)
a<-table.element(a,tbig[2])
a<-table.row.end(a)
a<-table.row.start(a)
a<-table.element(a,'#Female births in Small Hospital',header=TRUE)
a<-table.element(a,tsmall[1])
a<-table.row.end(a)
a<-table.row.start(a)
a<-table.element(a,'#Male births in Small Hospital',header=TRUE)
a<-table.element(a,tsmall[2])
a<-table.row.end(a)
a<-table.row.start(a)
dum1 <- paste('Probability of more than', par4*100, sep=' ')
dum <- paste(dum1, '% of male births in Large Hospital', sep=' ')
a<-table.element(a, dum, header=TRUE)
a<-table.element(a, bigprob[par1])
a<-table.row.end(a)
dum <- paste(dum1, '% of male births in Small Hospital', sep=' ')
a<-table.element(a, dum, header=TRUE)
a<-table.element(a, smallprob[par1])
a<-table.row.end(a)
a<-table.row.start(a)
dum1 <- paste('#Days per Year when more than', par4*100, sep=' ')
dum <- paste(dum1, '% of male births occur in Large Hospital', sep=' ')
a<-table.element(a, dum, header=TRUE)
a<-table.element(a, bigprob[par1]*365)
a<-table.row.end(a)
dum <- paste(dum1, '% of male births occur in Small Hospital', sep=' ')
a<-table.element(a, dum, header=TRUE)
a<-table.element(a, smallprob[par1]*365)
a<-table.row.end(a)
a<-table.end(a)
table.save(a,file='mytable.tab')