Free Statistics

of Irreproducible Research!

Author's title

Author*The author of this computation has been verified*
R Software Modulerwasp_babies.wasp
Title produced by softwareExercise 1.13
Date of computationFri, 10 Oct 2008 08:27:44 -0600
Cite this page as followsStatistical Computations at FreeStatistics.org, Office for Research Development and Education, URL https://freestatistics.org/blog/index.php?v=date/2008/Oct/10/t1223648960rfxb7rurd7kmq50.htm/, Retrieved Sun, 19 May 2024 20:26:32 +0000
Statistical Computations at FreeStatistics.org, Office for Research Development and Education, URL https://freestatistics.org/blog/index.php?pk=15241, Retrieved Sun, 19 May 2024 20:26:32 +0000
QR Codes:

Original text written by user:
IsPrivate?No (this computation is public)
User-defined keywords
Estimated Impact160
Family? (F = Feedback message, R = changed R code, M = changed R Module, P = changed Parameters, D = changed Data)
F     [Exercise 1.13] [Exercise 1.13 (Wo...] [2008-10-01 13:28:34] [b98453cac15ba1066b407e146608df68]
F R P     [Exercise 1.13] [Probability -60% ...] [2008-10-10 14:27:44] [63db34dadd44fb018112addcdefe949f] [Current]
Feedback Forum
2008-10-19 18:58:33 [Nick Wuyts] [reply
Het teken van de IF functies (>) veranderen naar < in de R-code is correct. Echter zou ik more in less vervangen (2 keer) in de R-code.
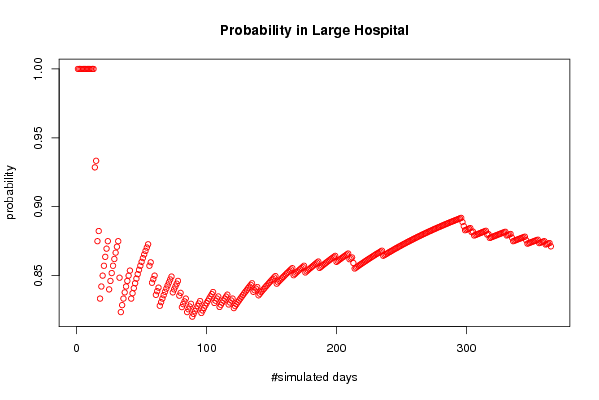
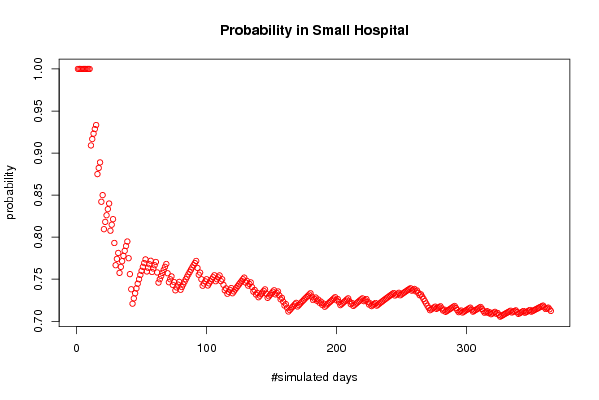
Dit verandert de tekst Probability of more than 60 % of male births in Large Hospital en daaropvolgende teksten (more wordt less) bij de output, wat beter oogt met de huidige vraagstelling. Voor een nauwkeurigere oplossing kunnen we het aantal gesimuleerde dagen (365) veranderen in 3650. Tenslotte is de studente de grafiektitels vergeten te vertalen. Dit doen we door de functie Plot in de R-code te wijzigen.
2008-10-20 18:01:13 [Dorien Janssens] [reply
De R-code is correct aangepast om te weten te komen waar de kans het grootst is dat minder dan 60% van de geboortes jongens zouden zijn.

Een aantal zaken dienen nog gewijzigd te worden in de R-code:
Het woord 'more than' moet gewijzigd worden in 'less than'
Dit gebeurt als volgt:
Originele code: dum1 <- paste('Probability of more than', par4*100, sep=' ')
Wijziging: dum1 <- paste('Probability of less than', par4*100, sep=' ')

Ook de grafiektitels moeten nog aangepast worden:
Originele code: plot(bigprob,col=2,main='Probability in Large Hospital',xlab='#simulated days',ylab='probability')
Wijziging: plot(bigprob,col=2,main='Waarschijnlijkheid in het grote ziekenhuis',xlab='#simulated days',ylab='probability')
(zelfde voor het kleine ziekenhuis)
2008-10-20 18:16:50 [Martjin De Swert] [reply
Correcte aanpassing van de R-code buiten het feit van de verandering van 'more than' in less 'than' en de vertaling van de grafiektitels.

De gevolgde redenering is echter correct.

Post a new message


Summary of computational transaction
Raw Inputview raw input (R code)
Raw Outputview raw output of R engine
Computing time3 seconds
R Server'Herman Ole Andreas Wold' @ 193.190.124.10:1001

\begin{tabular}{lllllllll}
\hline
Summary of computational transaction \tabularnewline
Raw Input & view raw input (R code)  \tabularnewline
Raw Output & view raw output of R engine  \tabularnewline
Computing time & 3 seconds \tabularnewline
R Server & 'Herman Ole Andreas Wold' @ 193.190.124.10:1001 \tabularnewline
\hline
\end{tabular}
%Source: https://freestatistics.org/blog/index.php?pk=15241&T=0

[TABLE]
[ROW][C]Summary of computational transaction[/C][/ROW]
[ROW][C]Raw Input[/C][C]view raw input (R code) [/C][/ROW]
[ROW][C]Raw Output[/C][C]view raw output of R engine [/C][/ROW]
[ROW][C]Computing time[/C][C]3 seconds[/C][/ROW]
[ROW][C]R Server[/C][C]'Herman Ole Andreas Wold' @ 193.190.124.10:1001[/C][/ROW]
[/TABLE]
Source: https://freestatistics.org/blog/index.php?pk=15241&T=0

Globally Unique Identifier (entire table): ba.freestatistics.org/blog/index.php?pk=15241&T=0

As an alternative you can also use a QR Code:  

The GUIDs for individual cells are displayed in the table below:

Summary of computational transaction
Raw Inputview raw input (R code)
Raw Outputview raw output of R engine
Computing time3 seconds
R Server'Herman Ole Andreas Wold' @ 193.190.124.10:1001


Exercise 1.13 p. 14 (Introduction to Probability, 2nd ed.)
Number of simulated days365
Expected number of births in Large Hospital45
Expected number of births in Small Hospital15
Percentage of Male births per day(for which the probability is computed)0.6
#Females births in Large Hospital8203
#Males births in Large Hospital8222
#Female births in Small Hospital2766
#Male births in Small Hospital2709
Probability of more than 60 % of male births in Large Hospital0.871232876712329
Probability of more than 60 % of male births in Small Hospital0.712328767123288
#Days per Year when more than 60 % of male births occur in Large Hospital318
#Days per Year when more than 60 % of male births occur in Small Hospital260

\begin{tabular}{lllllllll}
\hline
Exercise 1.13 p. 14 (Introduction to Probability, 2nd ed.) \tabularnewline
Number of simulated days & 365 \tabularnewline
Expected number of births in Large Hospital & 45 \tabularnewline
Expected number of births in Small Hospital & 15 \tabularnewline
Percentage of Male births per day(for which the probability is computed) & 0.6 \tabularnewline
#Females births in Large Hospital & 8203 \tabularnewline
#Males births in Large Hospital & 8222 \tabularnewline
#Female births in Small Hospital & 2766 \tabularnewline
#Male births in Small Hospital & 2709 \tabularnewline
Probability of more than 60 % of male births in Large Hospital & 0.871232876712329 \tabularnewline
Probability of more than 60 % of male births in Small Hospital & 0.712328767123288 \tabularnewline
#Days per Year when more than 60 % of male births occur in Large Hospital & 318 \tabularnewline
#Days per Year when more than 60 % of male births occur in Small Hospital & 260 \tabularnewline
\hline
\end{tabular}
%Source: https://freestatistics.org/blog/index.php?pk=15241&T=1

[TABLE]
[ROW][C]Exercise 1.13 p. 14 (Introduction to Probability, 2nd ed.)[/C][/ROW]
[ROW][C]Number of simulated days[/C][C]365[/C][/ROW]
[ROW][C]Expected number of births in Large Hospital[/C][C]45[/C][/ROW]
[ROW][C]Expected number of births in Small Hospital[/C][C]15[/C][/ROW]
[ROW][C]Percentage of Male births per day(for which the probability is computed)[/C][C]0.6[/C][/ROW]
[ROW][C]#Females births in Large Hospital[/C][C]8203[/C][/ROW]
[ROW][C]#Males births in Large Hospital[/C][C]8222[/C][/ROW]
[ROW][C]#Female births in Small Hospital[/C][C]2766[/C][/ROW]
[ROW][C]#Male births in Small Hospital[/C][C]2709[/C][/ROW]
[ROW][C]Probability of more than 60 % of male births in Large Hospital[/C][C]0.871232876712329[/C][/ROW]
[C]Probability of more than 60 % of male births in Small Hospital[/C][C]0.712328767123288[/C][/ROW]
[ROW][C]#Days per Year when more than 60 % of male births occur in Large Hospital[/C][C]318[/C][/ROW]
[C]#Days per Year when more than 60 % of male births occur in Small Hospital[/C][C]260[/C][/ROW]
[/TABLE]
Source: https://freestatistics.org/blog/index.php?pk=15241&T=1

Globally Unique Identifier (entire table): ba.freestatistics.org/blog/index.php?pk=15241&T=1

As an alternative you can also use a QR Code:  

The GUIDs for individual cells are displayed in the table below:

Exercise 1.13 p. 14 (Introduction to Probability, 2nd ed.)
Number of simulated days365
Expected number of births in Large Hospital45
Expected number of births in Small Hospital15
Percentage of Male births per day(for which the probability is computed)0.6
#Females births in Large Hospital8203
#Males births in Large Hospital8222
#Female births in Small Hospital2766
#Male births in Small Hospital2709
Probability of more than 60 % of male births in Large Hospital0.871232876712329
Probability of more than 60 % of male births in Small Hospital0.712328767123288
#Days per Year when more than 60 % of male births occur in Large Hospital318
#Days per Year when more than 60 % of male births occur in Small Hospital260


Parameters (Session):
par1 = 365 ; par2 = 45 ; par3 = 15 ; par4 = 0.6 ;
Parameters (R input):
par1 = 365 ; par2 = 45 ; par3 = 15 ; par4 = 0.6 ;
R code (references can be found in the software module):
par1 <- as.numeric(par1)
par2 <- as.numeric(par2)
par3 <- as.numeric(par3)
par4 <- as.numeric(par4)
numsuccessbig <- 0
numsuccesssmall <- 0
bighospital <- array(NA,dim=c(par1,par2))
smallhospital <- array(NA,dim=c(par1,par3))
bigprob <- array(NA,dim=par1)
smallprob <- array(NA,dim=par1)
for (i in 1:par1) {
bighospital[i,] <- sample(c('F','M'),par2,replace=TRUE)
if (as.matrix(table(bighospital[i,]))[2] < par4*par2) numsuccessbig = numsuccessbig + 1
bigprob[i] <- numsuccessbig/i
smallhospital[i,] <- sample(c('F','M'),par3,replace=TRUE)
if (as.matrix(table(smallhospital[i,]))[2] < par4*par3) numsuccesssmall = numsuccesssmall + 1
smallprob[i] <- numsuccesssmall/i
}
tbig <- as.matrix(table(bighospital))
tsmall <- as.matrix(table(smallhospital))
tbig
tsmall
numsuccessbig/par1
bigprob[par1]
numsuccesssmall/par1
smallprob[par1]
numsuccessbig/par1*365
bigprob[par1]*365
numsuccesssmall/par1*365
smallprob[par1]*365
bitmap(file='test1.png')
plot(bigprob,col=2,main='Probability in Large Hospital',xlab='#simulated days',ylab='probability')
dev.off()
bitmap(file='test2.png')
plot(smallprob,col=2,main='Probability in Small Hospital',xlab='#simulated days',ylab='probability')
dev.off()
load(file='createtable')
a<-table.start()
a<-table.row.start(a)
a<-table.element(a,'Exercise 1.13 p. 14 (Introduction to Probability, 2nd ed.)',2,TRUE)
a<-table.row.end(a)
a<-table.row.start(a)
a<-table.element(a,'Number of simulated days',header=TRUE)
a<-table.element(a,par1)
a<-table.row.end(a)
a<-table.row.start(a)
a<-table.element(a,'Expected number of births in Large Hospital',header=TRUE)
a<-table.element(a,par2)
a<-table.row.end(a)
a<-table.row.start(a)
a<-table.element(a,'Expected number of births in Small Hospital',header=TRUE)
a<-table.element(a,par3)
a<-table.row.end(a)
a<-table.row.start(a)
a<-table.element(a,'Percentage of Male births per day
(for which the probability is computed)',header=TRUE)
a<-table.element(a,par4)
a<-table.row.end(a)
a<-table.row.start(a)
a<-table.element(a,'#Females births in Large Hospital',header=TRUE)
a<-table.element(a,tbig[1])
a<-table.row.end(a)
a<-table.row.start(a)
a<-table.element(a,'#Males births in Large Hospital',header=TRUE)
a<-table.element(a,tbig[2])
a<-table.row.end(a)
a<-table.row.start(a)
a<-table.element(a,'#Female births in Small Hospital',header=TRUE)
a<-table.element(a,tsmall[1])
a<-table.row.end(a)
a<-table.row.start(a)
a<-table.element(a,'#Male births in Small Hospital',header=TRUE)
a<-table.element(a,tsmall[2])
a<-table.row.end(a)
a<-table.row.start(a)
dum1 <- paste('Probability of more than', par4*100, sep=' ')
dum <- paste(dum1, '% of male births in Large Hospital', sep=' ')
a<-table.element(a, dum, header=TRUE)
a<-table.element(a, bigprob[par1])
a<-table.row.end(a)
dum <- paste(dum1, '% of male births in Small Hospital', sep=' ')
a<-table.element(a, dum, header=TRUE)
a<-table.element(a, smallprob[par1])
a<-table.row.end(a)
a<-table.row.start(a)
dum1 <- paste('#Days per Year when more than', par4*100, sep=' ')
dum <- paste(dum1, '% of male births occur in Large Hospital', sep=' ')
a<-table.element(a, dum, header=TRUE)
a<-table.element(a, bigprob[par1]*365)
a<-table.row.end(a)
dum <- paste(dum1, '% of male births occur in Small Hospital', sep=' ')
a<-table.element(a, dum, header=TRUE)
a<-table.element(a, smallprob[par1]*365)
a<-table.row.end(a)
a<-table.end(a)
table.save(a,file='mytable.tab')