Free Statistics

of Irreproducible Research!

Author's title

Author*The author of this computation has been verified*
R Software Modulerwasp_babies.wasp
Title produced by softwareExercise 1.13
Date of computationFri, 10 Oct 2008 07:17:24 -0600
Cite this page as followsStatistical Computations at FreeStatistics.org, Office for Research Development and Education, URL https://freestatistics.org/blog/index.php?v=date/2008/Oct/10/t12236447524sd66i2ualatwx1.htm/, Retrieved Sun, 19 May 2024 20:26:00 +0000
Statistical Computations at FreeStatistics.org, Office for Research Development and Education, URL https://freestatistics.org/blog/index.php?pk=15193, Retrieved Sun, 19 May 2024 20:26:00 +0000
QR Codes:

Original text written by user:
IsPrivate?No (this computation is public)
User-defined keywords
Estimated Impact217
Family? (F = Feedback message, R = changed R code, M = changed R Module, P = changed Parameters, D = changed Data)
F     [Exercise 1.13] [Exercise 1.13 (Wo...] [2008-10-01 13:28:34] [b98453cac15ba1066b407e146608df68]
F R P     [Exercise 1.13] [60 % less] [2008-10-10 13:17:24] [6912578025c824de531bc660dd61b996] [Current]
- R P       [Exercise 1.13] [less than 60% boys] [2008-10-15 14:41:25] [8f802de8cb3f2f7005fd796d72a00b6d]
Feedback Forum
2008-10-16 11:09:25 [Tim Loyens] [reply
Een groot deel van deze oefening is niet correct beantwoord. De R-code werd niet goed begrepen. De student wist wel wat hij moest doen maar niet op welke manier dit in te vullen in de R-code. De uiteindelijk weergave van de tabel wist hij wel te veranderen:
dum1 <- paste(‘Probability of more than’, par4-100, sep= ‘ ’ )
more vervangen door less!

dum1 <- paste(‘#Days per Year when more than’, part4*100, sep= ‘ ‘)
more vervangen door less!

Dit was correct. Maar naast deze wijziging was het nodig om ook de werkelijke berekening aan te passen. Hoger in de R-Code moeten we op zoek gaan naar een invloed op parameter 4 omdat die invloed heeft op het aantal mannelijke geboortes. Hierbij vinden we het > Par4 teken dat gewijzigd moet worden in een <-teken. Dat resulteert dan in het volgende:

if (as.matrix(table(bighospital[i,]))[2] < par4*par2) numsuccessbig =

if (as.matrix(table(smallhospital[i,]))[2] < par4*par3) numsuccesssmall =

Met dit gewijzigd zou de oplossing de correcte waarden aannemen.
2008-10-16 15:19:08 [Christophe Goddaert] [reply
De opdracht werd goed begrepen maar in de aanpassing van de R-Code werd enkel het label van beide grafieken aangepast. Waar je deze aanpassing moest doen staat hierboven beschreven. Ook was het nodig om de titels van de assen te vertalen, dit gebeurt eveneens in de R-Code, hoe je dit doet kan je vinden in deze berekening:Statistical Computations at FreeStatistics.org, Office for Research Development and Education, URL http://www.freestatistics.org/blog/date/2008/Oct/15/t122409090257eqr48wfniky9c.htm
De conclusie was dat het grote ziekenhuis het grootste aantal dagen had.
2008-10-17 15:16:17 [Evelien Blockx] [reply
Ik ga akkoord met bovenstaande feedbacks. Enkel de tekst werd aangepast en niet de berekening. Hierdoor kwam je tot een verkeerd resultaat. Je komt erg weinig dagen per jaar uit dat er minder dan 60 procent jongensbaby's geboren worden, terwijl dat er eigenlijk net vrij veel moeten zijn.
2008-10-18 14:50:44 [Siem Van Opstal] [reply
Ik ben het eveeens eens met bovenstaande feedbacks. Enkel de tekst werd aangepast en niet de berekening. Hierdoor kwam je tot een verkeerd resultaat. Je komt erg weinig dagen per jaar uit dat er minder dan 60 procent jongensbaby's geboren worden, terwijl dat er eigenlijk net vrij veel moeten zijn. Ook de grafiektitels moeten nog vertaald worden naar het nederlands. dit doe je in de R-code bij de functie 'plot'.
2008-10-19 14:54:37 [Niels Stas] [reply
Deze oefening is niet volledig correct uitgevoerd. De R code moest gewijzigd worden om de berekening om te keren van 'meer dan' naar 'minder dan'.

Dit kon je doen door in onderstaande formule het teken '>' te wijzigen in '<'
if (as.matrix(table(smallhospital[i,]))[2] > par4*par3)

Het wijzigen van de grafiek titel is ook niet uitgevoerd, dit kon je doen door te zoeken naar de onderstaande formule en de titel (Porbability in Large Hospital) te vertalen.
plot(bigprob,col=2,main='Probability in Large Hospital',xlab='#simulated days',ylab='probability')
2008-10-19 16:14:52 [66991d38d6a4b2d9fe97b6c889f3689c] [reply
zoals hierboven te lezen staat werd de r-code niet correct gewijzigd.
je kon ook reeds lezen in wat je het wel moet veranderen maar ik kan me voorstellen dat het niet gemakkelijk is om in de r-code naar zo iets op zoek te gaan en ook nog te weten dat je het juiste hebt...

je moet in de r-code steeds zoeken naar de voorwaarde die wordt aangeduid door 'if'.
deze voorwaarde moet voldaan zijn om de waarschijnlijkheid met 1 te laten stijgen. (wordt ook erna vermeld dmv numsuccessbig = numsuccessbig + 1)
(numsuccessbig verwijst hier naar de waarschijnlijkheid in het grote hospitaal)

tip: lees steeds het 1e woord van de zin en zoek zo de voorwaarde 'if'.
de wijziging van de assen kan je best uitvoeren door in de r-code de originele titel te zoeken dmv ctrl f.
2008-10-20 17:34:31 [Evelyne Slegers] [reply
Hetgeen de student gewijzigd heeft leidt enkel tot een verandering in de naam van de paramater. De berekening zelf blijft ongewijzigd door deze aanpassing in de R code.

De juiste verandering is als volgt: In deze code moet '>' veranderen in '<' if (as.matrix(table(smallhospital[i,]))[2] > par4*par3)

Er werd ook gevraagd om de grafiektitel te vertalen wat niet gebeurd is. Dit doe je wel door een woordelijke verandering in de code nl.
plot(bigprob,col=2,main='Probability in Large Hospital',xlab='#simulateddays',ylab='probability') --> 'Probability in Large Hospital' wordt 'Waarschijnlijkheid in groot ziekenhuis' (idem voor klein ziekenhuis)
2008-10-20 17:37:59 [381ca57b5ff546f7124f7c300be2b319] [reply
In het algemeen werd de oefening zeer goed opgelost. De antwoorden werden zeer duidelijk geformuleerd en waren volledig. Ook de links stonden vermeld in het document.
De enige opmerking is echter dat bij de laatste oefening ook volgende regels uit de formule veranderd moesten worden om het juiste resultaat te verkrijgen.

“if (as.matrix(table(bighospital[i,]))[2] < par4*par2) numsuccessbig = numsuccessbig + 1”
“if (as.matrix(table(smallhospital[i,]))[2] < par4*par3) numsuccesssmall = numsuccesssmall + 1”

2008-10-20 18:04:44 [Martjin De Swert] [reply
Student heeft de logica achter de oefening wel begrepen maar de uitwerking was niet geheel correct. Enkel de tabel is aangepast terwijl ook de R-code diende aangepast zoals hierboven al enkele malen vermeld is.
2008-10-20 21:46:29 [Jan Mols] [reply
De student heeft de opgave begrepen alleen de uitwerking was niet helemaal geslaagd. Het teken in de if-formule moest aangepast worden en dat is niet gebeurd.Dat staat hierboven al ettelijke keren vermeld.

Post a new message


Summary of computational transaction
Raw Inputview raw input (R code)
Raw Outputview raw output of R engine
Computing time2 seconds
R Server'Gwilym Jenkins' @ 72.249.127.135

\begin{tabular}{lllllllll}
\hline
Summary of computational transaction \tabularnewline
Raw Input & view raw input (R code)  \tabularnewline
Raw Output & view raw output of R engine  \tabularnewline
Computing time & 2 seconds \tabularnewline
R Server & 'Gwilym Jenkins' @ 72.249.127.135 \tabularnewline
\hline
\end{tabular}
%Source: https://freestatistics.org/blog/index.php?pk=15193&T=0

[TABLE]
[ROW][C]Summary of computational transaction[/C][/ROW]
[ROW][C]Raw Input[/C][C]view raw input (R code) [/C][/ROW]
[ROW][C]Raw Output[/C][C]view raw output of R engine [/C][/ROW]
[ROW][C]Computing time[/C][C]2 seconds[/C][/ROW]
[ROW][C]R Server[/C][C]'Gwilym Jenkins' @ 72.249.127.135[/C][/ROW]
[/TABLE]
Source: https://freestatistics.org/blog/index.php?pk=15193&T=0

Globally Unique Identifier (entire table): ba.freestatistics.org/blog/index.php?pk=15193&T=0

As an alternative you can also use a QR Code:  

The GUIDs for individual cells are displayed in the table below:

Summary of computational transaction
Raw Inputview raw input (R code)
Raw Outputview raw output of R engine
Computing time2 seconds
R Server'Gwilym Jenkins' @ 72.249.127.135


Exercise 1.13 p. 14 (Introduction to Probability, 2nd ed.)
Number of simulated days365
Expected number of births in Large Hospital45
Expected number of births in Small Hospital15
Percentage of Male births per day(for which the probability is computed)0.6
#Females births in Large Hospital8146
#Males births in Large Hospital8279
#Female births in Small Hospital2763
#Male births in Small Hospital2712
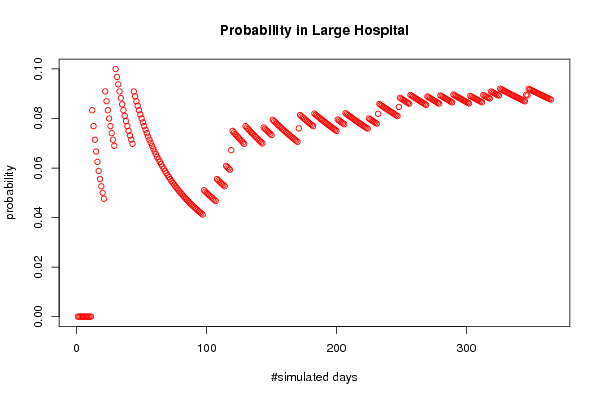
Probability of less than 60 % of male births in Large Hospital0.0876712328767123
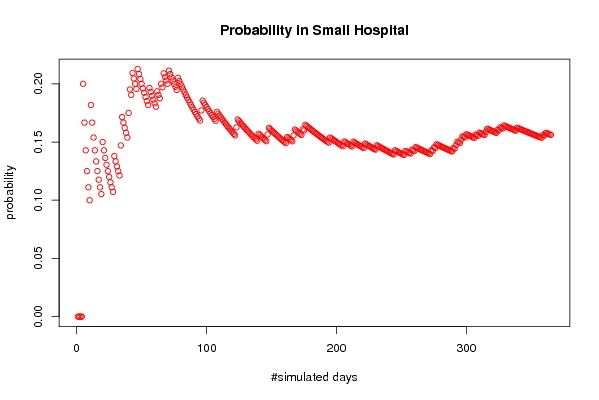
Probability of less than 60 % of male births in Small Hospital0.156164383561644
#Days per Year when less than 60 % of male births occur in Large Hospital32
#Days per Year when less than 60 % of male births occur in Small Hospital57

\begin{tabular}{lllllllll}
\hline
Exercise 1.13 p. 14 (Introduction to Probability, 2nd ed.) \tabularnewline
Number of simulated days & 365 \tabularnewline
Expected number of births in Large Hospital & 45 \tabularnewline
Expected number of births in Small Hospital & 15 \tabularnewline
Percentage of Male births per day(for which the probability is computed) & 0.6 \tabularnewline
#Females births in Large Hospital & 8146 \tabularnewline
#Males births in Large Hospital & 8279 \tabularnewline
#Female births in Small Hospital & 2763 \tabularnewline
#Male births in Small Hospital & 2712 \tabularnewline
Probability of less than 60 % of male births in Large Hospital & 0.0876712328767123 \tabularnewline
Probability of less than 60 % of male births in Small Hospital & 0.156164383561644 \tabularnewline
#Days per Year when less than 60 % of male births occur in Large Hospital & 32 \tabularnewline
#Days per Year when less than 60 % of male births occur in Small Hospital & 57 \tabularnewline
\hline
\end{tabular}
%Source: https://freestatistics.org/blog/index.php?pk=15193&T=1

[TABLE]
[ROW][C]Exercise 1.13 p. 14 (Introduction to Probability, 2nd ed.)[/C][/ROW]
[ROW][C]Number of simulated days[/C][C]365[/C][/ROW]
[ROW][C]Expected number of births in Large Hospital[/C][C]45[/C][/ROW]
[ROW][C]Expected number of births in Small Hospital[/C][C]15[/C][/ROW]
[ROW][C]Percentage of Male births per day(for which the probability is computed)[/C][C]0.6[/C][/ROW]
[ROW][C]#Females births in Large Hospital[/C][C]8146[/C][/ROW]
[ROW][C]#Males births in Large Hospital[/C][C]8279[/C][/ROW]
[ROW][C]#Female births in Small Hospital[/C][C]2763[/C][/ROW]
[ROW][C]#Male births in Small Hospital[/C][C]2712[/C][/ROW]
[ROW][C]Probability of less than 60 % of male births in Large Hospital[/C][C]0.0876712328767123[/C][/ROW]
[C]Probability of less than 60 % of male births in Small Hospital[/C][C]0.156164383561644[/C][/ROW]
[ROW][C]#Days per Year when less than 60 % of male births occur in Large Hospital[/C][C]32[/C][/ROW]
[C]#Days per Year when less than 60 % of male births occur in Small Hospital[/C][C]57[/C][/ROW]
[/TABLE]
Source: https://freestatistics.org/blog/index.php?pk=15193&T=1

Globally Unique Identifier (entire table): ba.freestatistics.org/blog/index.php?pk=15193&T=1

As an alternative you can also use a QR Code:  

The GUIDs for individual cells are displayed in the table below:

Exercise 1.13 p. 14 (Introduction to Probability, 2nd ed.)
Number of simulated days365
Expected number of births in Large Hospital45
Expected number of births in Small Hospital15
Percentage of Male births per day(for which the probability is computed)0.6
#Females births in Large Hospital8146
#Males births in Large Hospital8279
#Female births in Small Hospital2763
#Male births in Small Hospital2712
Probability of less than 60 % of male births in Large Hospital0.0876712328767123
Probability of less than 60 % of male births in Small Hospital0.156164383561644
#Days per Year when less than 60 % of male births occur in Large Hospital32
#Days per Year when less than 60 % of male births occur in Small Hospital57


Parameters (Session):
par1 = 365 ; par2 = 45 ; par3 = 15 ; par4 = 0.6 ;
Parameters (R input):
par1 = 365 ; par2 = 45 ; par3 = 15 ; par4 = 0.6 ;
R code (references can be found in the software module):
par1 <- as.numeric(par1)
par2 <- as.numeric(par2)
par3 <- as.numeric(par3)
par4 <- as.numeric(par4)
numsuccessbig <- 0
numsuccesssmall <- 0
bighospital <- array(NA,dim=c(par1,par2))
smallhospital <- array(NA,dim=c(par1,par3))
bigprob <- array(NA,dim=par1)
smallprob <- array(NA,dim=par1)
for (i in 1:par1) {
bighospital[i,] <- sample(c('F','M'),par2,replace=TRUE)
if (as.matrix(table(bighospital[i,]))[2] > par4*par2) numsuccessbig = numsuccessbig + 1
bigprob[i] <- numsuccessbig/i
smallhospital[i,] <- sample(c('F','M'),par3,replace=TRUE)
if (as.matrix(table(smallhospital[i,]))[2] > par4*par3) numsuccesssmall = numsuccesssmall + 1
smallprob[i] <- numsuccesssmall/i
}
tbig <- as.matrix(table(bighospital))
tsmall <- as.matrix(table(smallhospital))
tbig
tsmall
numsuccessbig/par1
bigprob[par1]
numsuccesssmall/par1
smallprob[par1]
numsuccessbig/par1*365
bigprob[par1]*365
numsuccesssmall/par1*365
smallprob[par1]*365
bitmap(file='test1.png')
plot(bigprob,col=2,main='Probability in Large Hospital',xlab='#simulated days',ylab='probability')
dev.off()
bitmap(file='test2.png')
plot(smallprob,col=2,main='Probability in Small Hospital',xlab='#simulated days',ylab='probability')
dev.off()
load(file='createtable')
a<-table.start()
a<-table.row.start(a)
a<-table.element(a,'Exercise 1.13 p. 14 (Introduction to Probability, 2nd ed.)',2,TRUE)
a<-table.row.end(a)
a<-table.row.start(a)
a<-table.element(a,'Number of simulated days',header=TRUE)
a<-table.element(a,par1)
a<-table.row.end(a)
a<-table.row.start(a)
a<-table.element(a,'Expected number of births in Large Hospital',header=TRUE)
a<-table.element(a,par2)
a<-table.row.end(a)
a<-table.row.start(a)
a<-table.element(a,'Expected number of births in Small Hospital',header=TRUE)
a<-table.element(a,par3)
a<-table.row.end(a)
a<-table.row.start(a)
a<-table.element(a,'Percentage of Male births per day
(for which the probability is computed)',header=TRUE)
a<-table.element(a,par4)
a<-table.row.end(a)
a<-table.row.start(a)
a<-table.element(a,'#Females births in Large Hospital',header=TRUE)
a<-table.element(a,tbig[1])
a<-table.row.end(a)
a<-table.row.start(a)
a<-table.element(a,'#Males births in Large Hospital',header=TRUE)
a<-table.element(a,tbig[2])
a<-table.row.end(a)
a<-table.row.start(a)
a<-table.element(a,'#Female births in Small Hospital',header=TRUE)
a<-table.element(a,tsmall[1])
a<-table.row.end(a)
a<-table.row.start(a)
a<-table.element(a,'#Male births in Small Hospital',header=TRUE)
a<-table.element(a,tsmall[2])
a<-table.row.end(a)
a<-table.row.start(a)
dum1 <- paste('Probability of less than', par4*100, sep=' ')
dum <- paste(dum1, '% of male births in Large Hospital', sep=' ')
a<-table.element(a, dum, header=TRUE)
a<-table.element(a, bigprob[par1])
a<-table.row.end(a)
dum <- paste(dum1, '% of male births in Small Hospital', sep=' ')
a<-table.element(a, dum, header=TRUE)
a<-table.element(a, smallprob[par1])
a<-table.row.end(a)
a<-table.row.start(a)
dum1 <- paste('#Days per Year when less than', par4*100, sep=' ')
dum <- paste(dum1, '% of male births occur in Large Hospital', sep=' ')
a<-table.element(a, dum, header=TRUE)
a<-table.element(a, bigprob[par1]*365)
a<-table.row.end(a)
dum <- paste(dum1, '% of male births occur in Small Hospital', sep=' ')
a<-table.element(a, dum, header=TRUE)
a<-table.element(a, smallprob[par1]*365)
a<-table.row.end(a)
a<-table.end(a)
table.save(a,file='mytable.tab')