Free Statistics

of Irreproducible Research!

Author's title

Author*The author of this computation has been verified*
R Software Modulerwasp_babies.wasp
Title produced by softwareExercise 1.13
Date of computationThu, 09 Oct 2008 09:03:09 -0600
Cite this page as followsStatistical Computations at FreeStatistics.org, Office for Research Development and Education, URL https://freestatistics.org/blog/index.php?v=date/2008/Oct/09/t1223564637k6ac4c2j8zhs2tv.htm/, Retrieved Sun, 19 May 2024 13:53:49 +0000
Statistical Computations at FreeStatistics.org, Office for Research Development and Education, URL https://freestatistics.org/blog/index.php?pk=15112, Retrieved Sun, 19 May 2024 13:53:49 +0000
QR Codes:

Original text written by user:
IsPrivate?No (this computation is public)
User-defined keywords
Estimated Impact172
Family? (F = Feedback message, R = changed R code, M = changed R Module, P = changed Parameters, D = changed Data)
F     [Exercise 1.13] [Exercise 1.13 (Wo...] [2008-10-01 13:28:34] [b98453cac15ba1066b407e146608df68]
F R P     [Exercise 1.13] [+ 80 % male] [2008-10-09 15:03:09] [d96f761aa3e94002e7c05c3c847d2c79] [Current]
Feedback Forum
2008-10-15 15:31:25 [Tamara Witters] [reply
Je berekening is juist, maar indien je deze simulatie nog een aantal keer zou reproduceren, zou je merken dat het antwoorrd niet 0 is. Maar de oplossing zal uiteindelijk wel dicht bij 0 aanleunen.
Bij deze vraag heb jein de calculator het percentage mannelijke geboortes van 0,6 naar 0,8 verandert.
Indien je deze simulatie een aantal keer reproduceert, kan je ondervinden dat de waarschijnlijkheid in het grote ziekenhuis lager is dan in het kleine ziekenhuis.
2008-10-17 11:42:13 [339a57d8a4d5d113e4804fc423e4a59e] [reply
De berekening voor deze opgave klopt, maar het antwoord is niet volledig juist. Doordat de student slecht een 1 malige reproductie heeft uitgevoerd, heeft hij dit echter niet gemerkt. Zijn uitkomst is 0%, maar wanneer men enkele reproducties uitvoert, merkt men dat de uitkomst ongeveer tussen 0-0,5% ligt. Het was dus aangewezen meer dan 1 reproductie uit te voeren
2008-10-18 12:34:38 [Pieter Broos] [reply
Berekening is correct, parameter werd veranderd van 0.6 naar 0.8!
Te snelle conclusie dat het antwoord 0% is. Als je meermaals simuleert en over langere tijdspanne (3650 dagen) ga je zien dat het resultaat iets groter is dan 0.
2008-10-19 13:47:20 [Nathalie Koulouris] [reply
De student heeft een juiste berekening gemaakt. Hij beweert dat de waarschijnlijkheid nul is maar als hij de berekening een aantal keren gaat herhalen zal hij telkens een ander getal uitkomen dat zeer dicht bij nul gelegen is. Hij heeft bij deze berekening te snel een conclusie getrokken
2008-10-19 14:52:49 [Evelyn Ongena] [reply
Doordat je slechts 1 simulatie hebt uitgevoerd zal je inderdaad een vertekend beeld krijgen en te snel concluderen dat de waarschijnlijkheid 0% is.
2008-10-19 16:21:30 [Bonifer Spillemaeckers] [reply
De berekening werd correct uitgevoerd. Wel werd een te voorbarige conclusie getrokken door te zeggen dat de kans op meer dan 80% jongens nihil is.
Wanneer het aantal reproducties opgedreven zou worden en het ook aantal gesimuleerde dagen, bemerken we dat het resultaat tussen 0-0,5% gelegen is.

Post a new message


Summary of computational transaction
Raw Inputview raw input (R code)
Raw Outputview raw output of R engine
Computing time2 seconds
R Server'George Udny Yule' @ 72.249.76.132

\begin{tabular}{lllllllll}
\hline
Summary of computational transaction \tabularnewline
Raw Input & view raw input (R code)  \tabularnewline
Raw Output & view raw output of R engine  \tabularnewline
Computing time & 2 seconds \tabularnewline
R Server & 'George Udny Yule' @ 72.249.76.132 \tabularnewline
\hline
\end{tabular}
%Source: https://freestatistics.org/blog/index.php?pk=15112&T=0

[TABLE]
[ROW][C]Summary of computational transaction[/C][/ROW]
[ROW][C]Raw Input[/C][C]view raw input (R code) [/C][/ROW]
[ROW][C]Raw Output[/C][C]view raw output of R engine [/C][/ROW]
[ROW][C]Computing time[/C][C]2 seconds[/C][/ROW]
[ROW][C]R Server[/C][C]'George Udny Yule' @ 72.249.76.132[/C][/ROW]
[/TABLE]
Source: https://freestatistics.org/blog/index.php?pk=15112&T=0

Globally Unique Identifier (entire table): ba.freestatistics.org/blog/index.php?pk=15112&T=0

As an alternative you can also use a QR Code:  

The GUIDs for individual cells are displayed in the table below:

Summary of computational transaction
Raw Inputview raw input (R code)
Raw Outputview raw output of R engine
Computing time2 seconds
R Server'George Udny Yule' @ 72.249.76.132


Exercise 1.13 p. 14 (Introduction to Probability, 2nd ed.)
Number of simulated days365
Expected number of births in Large Hospital45
Expected number of births in Small Hospital15
Percentage of Male births per day(for which the probability is computed)0.8
#Females births in Large Hospital8208
#Males births in Large Hospital8217
#Female births in Small Hospital2733
#Male births in Small Hospital2742
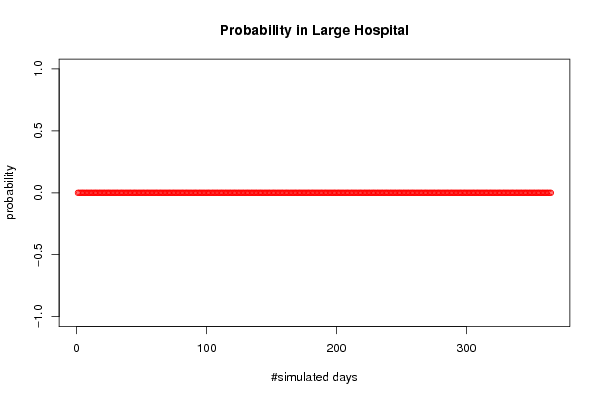
Probability of more than 80 % of male births in Large Hospital0
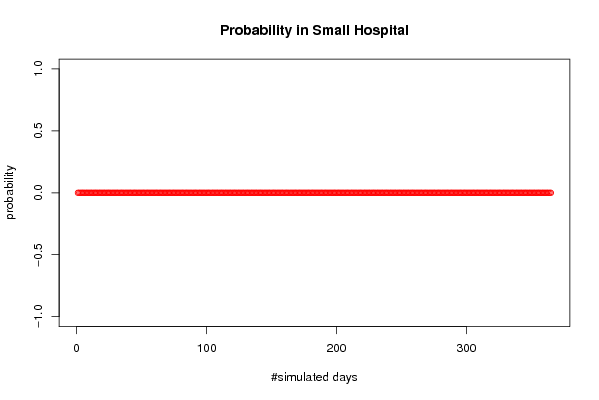
Probability of more than 80 % of male births in Small Hospital0
#Days per Year when more than 80 % of male births occur in Large Hospital0
#Days per Year when more than 80 % of male births occur in Small Hospital0

\begin{tabular}{lllllllll}
\hline
Exercise 1.13 p. 14 (Introduction to Probability, 2nd ed.) \tabularnewline
Number of simulated days & 365 \tabularnewline
Expected number of births in Large Hospital & 45 \tabularnewline
Expected number of births in Small Hospital & 15 \tabularnewline
Percentage of Male births per day(for which the probability is computed) & 0.8 \tabularnewline
#Females births in Large Hospital & 8208 \tabularnewline
#Males births in Large Hospital & 8217 \tabularnewline
#Female births in Small Hospital & 2733 \tabularnewline
#Male births in Small Hospital & 2742 \tabularnewline
Probability of more than 80 % of male births in Large Hospital & 0 \tabularnewline
Probability of more than 80 % of male births in Small Hospital & 0 \tabularnewline
#Days per Year when more than 80 % of male births occur in Large Hospital & 0 \tabularnewline
#Days per Year when more than 80 % of male births occur in Small Hospital & 0 \tabularnewline
\hline
\end{tabular}
%Source: https://freestatistics.org/blog/index.php?pk=15112&T=1

[TABLE]
[ROW][C]Exercise 1.13 p. 14 (Introduction to Probability, 2nd ed.)[/C][/ROW]
[ROW][C]Number of simulated days[/C][C]365[/C][/ROW]
[ROW][C]Expected number of births in Large Hospital[/C][C]45[/C][/ROW]
[ROW][C]Expected number of births in Small Hospital[/C][C]15[/C][/ROW]
[ROW][C]Percentage of Male births per day(for which the probability is computed)[/C][C]0.8[/C][/ROW]
[ROW][C]#Females births in Large Hospital[/C][C]8208[/C][/ROW]
[ROW][C]#Males births in Large Hospital[/C][C]8217[/C][/ROW]
[ROW][C]#Female births in Small Hospital[/C][C]2733[/C][/ROW]
[ROW][C]#Male births in Small Hospital[/C][C]2742[/C][/ROW]
[ROW][C]Probability of more than 80 % of male births in Large Hospital[/C][C]0[/C][/ROW]
[C]Probability of more than 80 % of male births in Small Hospital[/C][C]0[/C][/ROW]
[ROW][C]#Days per Year when more than 80 % of male births occur in Large Hospital[/C][C]0[/C][/ROW]
[C]#Days per Year when more than 80 % of male births occur in Small Hospital[/C][C]0[/C][/ROW]
[/TABLE]
Source: https://freestatistics.org/blog/index.php?pk=15112&T=1

Globally Unique Identifier (entire table): ba.freestatistics.org/blog/index.php?pk=15112&T=1

As an alternative you can also use a QR Code:  

The GUIDs for individual cells are displayed in the table below:

Exercise 1.13 p. 14 (Introduction to Probability, 2nd ed.)
Number of simulated days365
Expected number of births in Large Hospital45
Expected number of births in Small Hospital15
Percentage of Male births per day(for which the probability is computed)0.8
#Females births in Large Hospital8208
#Males births in Large Hospital8217
#Female births in Small Hospital2733
#Male births in Small Hospital2742
Probability of more than 80 % of male births in Large Hospital0
Probability of more than 80 % of male births in Small Hospital0
#Days per Year when more than 80 % of male births occur in Large Hospital0
#Days per Year when more than 80 % of male births occur in Small Hospital0


Parameters (Session):
par1 = 365 ; par2 = 45 ; par3 = 15 ; par4 = 0.8 ;
Parameters (R input):
par1 = 365 ; par2 = 45 ; par3 = 15 ; par4 = 0.8 ;
R code (references can be found in the software module):
par1 <- as.numeric(par1)
par2 <- as.numeric(par2)
par3 <- as.numeric(par3)
par4 <- as.numeric(par4)
numsuccessbig <- 0
numsuccesssmall <- 0
bighospital <- array(NA,dim=c(par1,par2))
smallhospital <- array(NA,dim=c(par1,par3))
bigprob <- array(NA,dim=par1)
smallprob <- array(NA,dim=par1)
for (i in 1:par1) {
bighospital[i,] <- sample(c('F','M'),par2,replace=TRUE)
if (as.matrix(table(bighospital[i,]))[2] > par4*par2) numsuccessbig = numsuccessbig + 1
bigprob[i] <- numsuccessbig/i
smallhospital[i,] <- sample(c('F','M'),par3,replace=TRUE)
if (as.matrix(table(smallhospital[i,]))[2] > par4*par3) numsuccesssmall = numsuccesssmall + 1
smallprob[i] <- numsuccesssmall/i
}
tbig <- as.matrix(table(bighospital))
tsmall <- as.matrix(table(smallhospital))
tbig
tsmall
numsuccessbig/par1
bigprob[par1]
numsuccesssmall/par1
smallprob[par1]
numsuccessbig/par1*365
bigprob[par1]*365
numsuccesssmall/par1*365
smallprob[par1]*365
bitmap(file='test1.png')
plot(bigprob,col=2,main='Probability in Large Hospital',xlab='#simulated days',ylab='probability')
dev.off()
bitmap(file='test2.png')
plot(smallprob,col=2,main='Probability in Small Hospital',xlab='#simulated days',ylab='probability')
dev.off()
load(file='createtable')
a<-table.start()
a<-table.row.start(a)
a<-table.element(a,'Exercise 1.13 p. 14 (Introduction to Probability, 2nd ed.)',2,TRUE)
a<-table.row.end(a)
a<-table.row.start(a)
a<-table.element(a,'Number of simulated days',header=TRUE)
a<-table.element(a,par1)
a<-table.row.end(a)
a<-table.row.start(a)
a<-table.element(a,'Expected number of births in Large Hospital',header=TRUE)
a<-table.element(a,par2)
a<-table.row.end(a)
a<-table.row.start(a)
a<-table.element(a,'Expected number of births in Small Hospital',header=TRUE)
a<-table.element(a,par3)
a<-table.row.end(a)
a<-table.row.start(a)
a<-table.element(a,'Percentage of Male births per day
(for which the probability is computed)',header=TRUE)
a<-table.element(a,par4)
a<-table.row.end(a)
a<-table.row.start(a)
a<-table.element(a,'#Females births in Large Hospital',header=TRUE)
a<-table.element(a,tbig[1])
a<-table.row.end(a)
a<-table.row.start(a)
a<-table.element(a,'#Males births in Large Hospital',header=TRUE)
a<-table.element(a,tbig[2])
a<-table.row.end(a)
a<-table.row.start(a)
a<-table.element(a,'#Female births in Small Hospital',header=TRUE)
a<-table.element(a,tsmall[1])
a<-table.row.end(a)
a<-table.row.start(a)
a<-table.element(a,'#Male births in Small Hospital',header=TRUE)
a<-table.element(a,tsmall[2])
a<-table.row.end(a)
a<-table.row.start(a)
dum1 <- paste('Probability of more than', par4*100, sep=' ')
dum <- paste(dum1, '% of male births in Large Hospital', sep=' ')
a<-table.element(a, dum, header=TRUE)
a<-table.element(a, bigprob[par1])
a<-table.row.end(a)
dum <- paste(dum1, '% of male births in Small Hospital', sep=' ')
a<-table.element(a, dum, header=TRUE)
a<-table.element(a, smallprob[par1])
a<-table.row.end(a)
a<-table.row.start(a)
dum1 <- paste('#Days per Year when more than', par4*100, sep=' ')
dum <- paste(dum1, '% of male births occur in Large Hospital', sep=' ')
a<-table.element(a, dum, header=TRUE)
a<-table.element(a, bigprob[par1]*365)
a<-table.row.end(a)
dum <- paste(dum1, '% of male births occur in Small Hospital', sep=' ')
a<-table.element(a, dum, header=TRUE)
a<-table.element(a, smallprob[par1]*365)
a<-table.row.end(a)
a<-table.end(a)
table.save(a,file='mytable.tab')