Free Statistics

of Irreproducible Research!

Author's title

Author*The author of this computation has been verified*
R Software Modulerwasp_cross.wasp
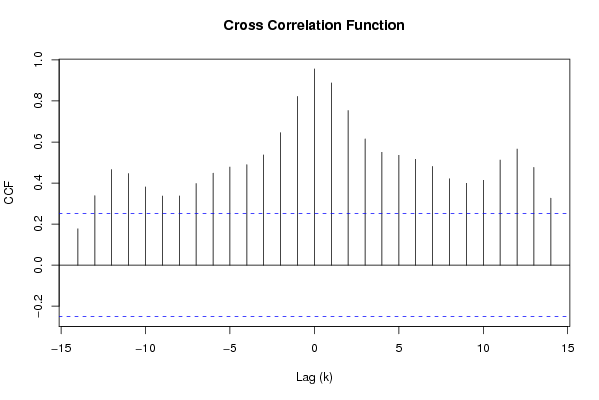
Title produced by softwareCross Correlation Function
Date of computationSun, 30 Nov 2008 08:54:53 -0700
Cite this page as followsStatistical Computations at FreeStatistics.org, Office for Research Development and Education, URL https://freestatistics.org/blog/index.php?v=date/2008/Nov/30/t1228060538emx0mgenf5fncv4.htm/, Retrieved Sun, 19 May 2024 10:23:20 +0000
Statistical Computations at FreeStatistics.org, Office for Research Development and Education, URL https://freestatistics.org/blog/index.php?pk=26578, Retrieved Sun, 19 May 2024 10:23:20 +0000
QR Codes:

Original text written by user:
IsPrivate?No (this computation is public)
User-defined keywords
Estimated Impact160
Family? (F = Feedback message, R = changed R code, M = changed R Module, P = changed Parameters, D = changed Data)
F     [Univariate Data Series] [Airline data] [2007-10-18 09:58:47] [42daae401fd3def69a25014f2252b4c2]
- RMPD    [Cross Correlation Function] [Taak 7 Q7] [2008-11-30 15:54:53] [bda7fba231d49184c6a1b627868bbb81] [Current]
-   P       [Cross Correlation Function] [taak 7 Q 9] [2008-11-30 16:16:14] [e1a46c1dcfccb0cb690f79a1a409b517]
Feedback Forum

Post a new message
Dataseries X:
512927
502831
470984
471067
476049
474605
470439
461251
454724
455626
516847
525192
522975
518585
509239
512238
519164
517009
509933
509127
500857
506971
569323
579714
577992
565464
547344
554788
562325
560854
555332
543599
536662
542722
593530
610763
612613
611324
594167
595454
590865
589379
584428
573100
567456
569028
620735
628884
628232
612117
595404
597141
593408
590072
579799
574205
572775
572942
619567
625809
619916
Dataseries Y:
189917
184128
175335
179566
181140
177876
175041
169292
166070
166972
206348
215706
202108
195411
193111
195198
198770
194163
190420
189733
186029
191531
232571
243477
227247
217859
208679
213188
216234
213587
209465
204045
200237
203666
241476
260307
243324
244460
233575
237217
235243
230354
227184
221678
217142
219452
256446
265845
248624
241114
229245
231805
219277
219313
212610
214771
211142
211457
240048
240636
230580


Summary of computational transaction
Raw Inputview raw input (R code)
Raw Outputview raw output of R engine
Computing time1 seconds
R Server'George Udny Yule' @ 72.249.76.132

\begin{tabular}{lllllllll}
\hline
Summary of computational transaction \tabularnewline
Raw Input & view raw input (R code)  \tabularnewline
Raw Output & view raw output of R engine  \tabularnewline
Computing time & 1 seconds \tabularnewline
R Server & 'George Udny Yule' @ 72.249.76.132 \tabularnewline
\hline
\end{tabular}
%Source: https://freestatistics.org/blog/index.php?pk=26578&T=0

[TABLE]
[ROW][C]Summary of computational transaction[/C][/ROW]
[ROW][C]Raw Input[/C][C]view raw input (R code) [/C][/ROW]
[ROW][C]Raw Output[/C][C]view raw output of R engine [/C][/ROW]
[ROW][C]Computing time[/C][C]1 seconds[/C][/ROW]
[ROW][C]R Server[/C][C]'George Udny Yule' @ 72.249.76.132[/C][/ROW]
[/TABLE]
Source: https://freestatistics.org/blog/index.php?pk=26578&T=0

Globally Unique Identifier (entire table): ba.freestatistics.org/blog/index.php?pk=26578&T=0

As an alternative you can also use a QR Code:  

The GUIDs for individual cells are displayed in the table below:

Summary of computational transaction
Raw Inputview raw input (R code)
Raw Outputview raw output of R engine
Computing time1 seconds
R Server'George Udny Yule' @ 72.249.76.132


Cross Correlation Function
ParameterValue
Box-Cox transformation parameter (lambda) of X series1
Degree of non-seasonal differencing (d) of X series0
Degree of seasonal differencing (D) of X series0
Seasonal Period (s)1
Box-Cox transformation parameter (lambda) of Y series1
Degree of non-seasonal differencing (d) of Y series0
Degree of seasonal differencing (D) of Y series0
krho(Y[t],X[t+k])
-140.177276249424119
-130.338661048130317
-120.465548059441931
-110.446481369253286
-100.381432311373181
-90.336686548638686
-80.337345333895998
-70.397421747116705
-60.448119192256194
-50.477995854211225
-40.48936546187322
-30.536835973965658
-20.645346928932235
-10.822042961374937
00.95615696518038
10.887848369202221
20.753483159466793
30.615268181091259
40.550028438663755
50.535378230218731
60.516086526770444
70.481254319501445
80.420886732121936
90.39888519595243
100.413470241932981
110.512299078397646
120.565441457212412
130.476472800123615
140.326642419308131

\begin{tabular}{lllllllll}
\hline
Cross Correlation Function \tabularnewline
Parameter & Value \tabularnewline
Box-Cox transformation parameter (lambda) of X series & 1 \tabularnewline
Degree of non-seasonal differencing (d) of X series & 0 \tabularnewline
Degree of seasonal differencing (D) of X series & 0 \tabularnewline
Seasonal Period (s) & 1 \tabularnewline
Box-Cox transformation parameter (lambda) of Y series & 1 \tabularnewline
Degree of non-seasonal differencing (d) of Y series & 0 \tabularnewline
Degree of seasonal differencing (D) of Y series & 0 \tabularnewline
k & rho(Y[t],X[t+k]) \tabularnewline
-14 & 0.177276249424119 \tabularnewline
-13 & 0.338661048130317 \tabularnewline
-12 & 0.465548059441931 \tabularnewline
-11 & 0.446481369253286 \tabularnewline
-10 & 0.381432311373181 \tabularnewline
-9 & 0.336686548638686 \tabularnewline
-8 & 0.337345333895998 \tabularnewline
-7 & 0.397421747116705 \tabularnewline
-6 & 0.448119192256194 \tabularnewline
-5 & 0.477995854211225 \tabularnewline
-4 & 0.48936546187322 \tabularnewline
-3 & 0.536835973965658 \tabularnewline
-2 & 0.645346928932235 \tabularnewline
-1 & 0.822042961374937 \tabularnewline
0 & 0.95615696518038 \tabularnewline
1 & 0.887848369202221 \tabularnewline
2 & 0.753483159466793 \tabularnewline
3 & 0.615268181091259 \tabularnewline
4 & 0.550028438663755 \tabularnewline
5 & 0.535378230218731 \tabularnewline
6 & 0.516086526770444 \tabularnewline
7 & 0.481254319501445 \tabularnewline
8 & 0.420886732121936 \tabularnewline
9 & 0.39888519595243 \tabularnewline
10 & 0.413470241932981 \tabularnewline
11 & 0.512299078397646 \tabularnewline
12 & 0.565441457212412 \tabularnewline
13 & 0.476472800123615 \tabularnewline
14 & 0.326642419308131 \tabularnewline
\hline
\end{tabular}
%Source: https://freestatistics.org/blog/index.php?pk=26578&T=1

[TABLE]
[ROW][C]Cross Correlation Function[/C][/ROW]
[ROW][C]Parameter[/C][C]Value[/C][/ROW]
[ROW][C]Box-Cox transformation parameter (lambda) of X series[/C][C]1[/C][/ROW]
[ROW][C]Degree of non-seasonal differencing (d) of X series[/C][C]0[/C][/ROW]
[ROW][C]Degree of seasonal differencing (D) of X series[/C][C]0[/C][/ROW]
[ROW][C]Seasonal Period (s)[/C][C]1[/C][/ROW]
[ROW][C]Box-Cox transformation parameter (lambda) of Y series[/C][C]1[/C][/ROW]
[ROW][C]Degree of non-seasonal differencing (d) of Y series[/C][C]0[/C][/ROW]
[ROW][C]Degree of seasonal differencing (D) of Y series[/C][C]0[/C][/ROW]
[ROW][C]k[/C][C]rho(Y[t],X[t+k])[/C][/ROW]
[ROW][C]-14[/C][C]0.177276249424119[/C][/ROW]
[ROW][C]-13[/C][C]0.338661048130317[/C][/ROW]
[ROW][C]-12[/C][C]0.465548059441931[/C][/ROW]
[ROW][C]-11[/C][C]0.446481369253286[/C][/ROW]
[ROW][C]-10[/C][C]0.381432311373181[/C][/ROW]
[ROW][C]-9[/C][C]0.336686548638686[/C][/ROW]
[ROW][C]-8[/C][C]0.337345333895998[/C][/ROW]
[ROW][C]-7[/C][C]0.397421747116705[/C][/ROW]
[ROW][C]-6[/C][C]0.448119192256194[/C][/ROW]
[ROW][C]-5[/C][C]0.477995854211225[/C][/ROW]
[ROW][C]-4[/C][C]0.48936546187322[/C][/ROW]
[ROW][C]-3[/C][C]0.536835973965658[/C][/ROW]
[ROW][C]-2[/C][C]0.645346928932235[/C][/ROW]
[ROW][C]-1[/C][C]0.822042961374937[/C][/ROW]
[ROW][C]0[/C][C]0.95615696518038[/C][/ROW]
[ROW][C]1[/C][C]0.887848369202221[/C][/ROW]
[ROW][C]2[/C][C]0.753483159466793[/C][/ROW]
[ROW][C]3[/C][C]0.615268181091259[/C][/ROW]
[ROW][C]4[/C][C]0.550028438663755[/C][/ROW]
[ROW][C]5[/C][C]0.535378230218731[/C][/ROW]
[ROW][C]6[/C][C]0.516086526770444[/C][/ROW]
[ROW][C]7[/C][C]0.481254319501445[/C][/ROW]
[ROW][C]8[/C][C]0.420886732121936[/C][/ROW]
[ROW][C]9[/C][C]0.39888519595243[/C][/ROW]
[ROW][C]10[/C][C]0.413470241932981[/C][/ROW]
[ROW][C]11[/C][C]0.512299078397646[/C][/ROW]
[ROW][C]12[/C][C]0.565441457212412[/C][/ROW]
[ROW][C]13[/C][C]0.476472800123615[/C][/ROW]
[ROW][C]14[/C][C]0.326642419308131[/C][/ROW]
[/TABLE]
Source: https://freestatistics.org/blog/index.php?pk=26578&T=1

Globally Unique Identifier (entire table): ba.freestatistics.org/blog/index.php?pk=26578&T=1

As an alternative you can also use a QR Code:  

The GUIDs for individual cells are displayed in the table below:

Cross Correlation Function
ParameterValue
Box-Cox transformation parameter (lambda) of X series1
Degree of non-seasonal differencing (d) of X series0
Degree of seasonal differencing (D) of X series0
Seasonal Period (s)1
Box-Cox transformation parameter (lambda) of Y series1
Degree of non-seasonal differencing (d) of Y series0
Degree of seasonal differencing (D) of Y series0
krho(Y[t],X[t+k])
-140.177276249424119
-130.338661048130317
-120.465548059441931
-110.446481369253286
-100.381432311373181
-90.336686548638686
-80.337345333895998
-70.397421747116705
-60.448119192256194
-50.477995854211225
-40.48936546187322
-30.536835973965658
-20.645346928932235
-10.822042961374937
00.95615696518038
10.887848369202221
20.753483159466793
30.615268181091259
40.550028438663755
50.535378230218731
60.516086526770444
70.481254319501445
80.420886732121936
90.39888519595243
100.413470241932981
110.512299078397646
120.565441457212412
130.476472800123615
140.326642419308131


Parameters (Session):
par1 = 1 ; par2 = 0 ; par3 = 0 ; par4 = 1 ; par5 = 1 ; par6 = 0 ; par7 = 0 ;
Parameters (R input):
par1 = 1 ; par2 = 0 ; par3 = 0 ; par4 = 1 ; par5 = 1 ; par6 = 0 ; par7 = 0 ;
R code (references can be found in the software module):
par1 <- as.numeric(par1)
par2 <- as.numeric(par2)
par3 <- as.numeric(par3)
par4 <- as.numeric(par4)
par5 <- as.numeric(par5)
par6 <- as.numeric(par6)
par7 <- as.numeric(par7)
if (par1 == 0) {
x <- log(x)
} else {
x <- (x ^ par1 - 1) / par1
}
if (par5 == 0) {
y <- log(y)
} else {
y <- (y ^ par5 - 1) / par5
}
if (par2 > 0) x <- diff(x,lag=1,difference=par2)
if (par6 > 0) y <- diff(y,lag=1,difference=par6)
if (par3 > 0) x <- diff(x,lag=par4,difference=par3)
if (par7 > 0) y <- diff(y,lag=par4,difference=par7)
x
y
bitmap(file='test1.png')
(r <- ccf(x,y,main='Cross Correlation Function',ylab='CCF',xlab='Lag (k)'))
dev.off()
load(file='createtable')
a<-table.start()
a<-table.row.start(a)
a<-table.element(a,'Cross Correlation Function',2,TRUE)
a<-table.row.end(a)
a<-table.row.start(a)
a<-table.element(a,'Parameter',header=TRUE)
a<-table.element(a,'Value',header=TRUE)
a<-table.row.end(a)
a<-table.row.start(a)
a<-table.element(a,'Box-Cox transformation parameter (lambda) of X series',header=TRUE)
a<-table.element(a,par1)
a<-table.row.end(a)
a<-table.row.start(a)
a<-table.element(a,'Degree of non-seasonal differencing (d) of X series',header=TRUE)
a<-table.element(a,par2)
a<-table.row.end(a)
a<-table.row.start(a)
a<-table.element(a,'Degree of seasonal differencing (D) of X series',header=TRUE)
a<-table.element(a,par3)
a<-table.row.end(a)
a<-table.row.start(a)
a<-table.element(a,'Seasonal Period (s)',header=TRUE)
a<-table.element(a,par4)
a<-table.row.end(a)
a<-table.row.start(a)
a<-table.element(a,'Box-Cox transformation parameter (lambda) of Y series',header=TRUE)
a<-table.element(a,par5)
a<-table.row.end(a)
a<-table.row.start(a)
a<-table.element(a,'Degree of non-seasonal differencing (d) of Y series',header=TRUE)
a<-table.element(a,par6)
a<-table.row.end(a)
a<-table.row.start(a)
a<-table.element(a,'Degree of seasonal differencing (D) of Y series',header=TRUE)
a<-table.element(a,par7)
a<-table.row.end(a)
a<-table.row.start(a)
a<-table.element(a,'k',header=TRUE)
a<-table.element(a,'rho(Y[t],X[t+k])',header=TRUE)
a<-table.row.end(a)
mylength <- length(r$acf)
myhalf <- floor((mylength-1)/2)
for (i in 1:mylength) {
a<-table.row.start(a)
a<-table.element(a,i-myhalf-1,header=TRUE)
a<-table.element(a,r$acf[i])
a<-table.row.end(a)
}
a<-table.end(a)
table.save(a,file='mytable.tab')