Free Statistics

of Irreproducible Research!

Author's title

Author*The author of this computation has been verified*
R Software Modulerwasp_cross.wasp
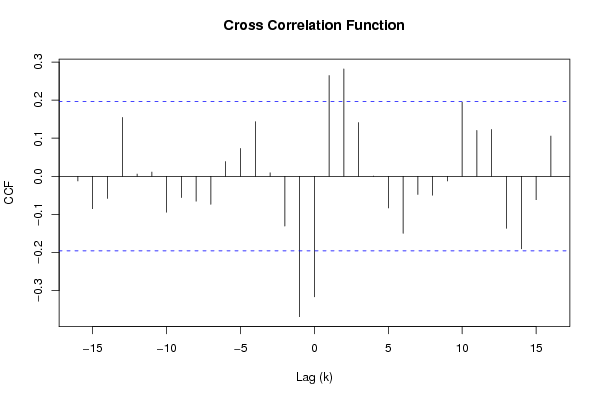
Title produced by softwareCross Correlation Function
Date of computationFri, 28 Nov 2008 06:54:38 -0700
Cite this page as followsStatistical Computations at FreeStatistics.org, Office for Research Development and Education, URL https://freestatistics.org/blog/index.php?v=date/2008/Nov/28/t12278805149sv1zp1p92n8pua.htm/, Retrieved Sun, 19 May 2024 11:29:55 +0000
Statistical Computations at FreeStatistics.org, Office for Research Development and Education, URL https://freestatistics.org/blog/index.php?pk=26111, Retrieved Sun, 19 May 2024 11:29:55 +0000
QR Codes:

Original text written by user:
IsPrivate?No (this computation is public)
User-defined keywords
Estimated Impact169
Family? (F = Feedback message, R = changed R code, M = changed R Module, P = changed Parameters, D = changed Data)
F     [Univariate Data Series] [tijdreeks verkoop...] [2008-10-13 20:55:30] [d2d412c7f4d35ffbf5ee5ee89db327d4]
-   PD  [Univariate Data Series] [totale werkloosheid] [2008-10-19 15:02:07] [d2d412c7f4d35ffbf5ee5ee89db327d4]
- RMPD    [Cross Correlation Function] [] [2008-11-28 11:47:25] [d2d412c7f4d35ffbf5ee5ee89db327d4]
-   P       [Cross Correlation Function] [] [2008-11-28 12:10:30] [d2d412c7f4d35ffbf5ee5ee89db327d4]
F   P           [Cross Correlation Function] [Q9] [2008-11-28 13:54:38] [6fc58909ffe15c247a4f6748c8841ab4] [Current]
Feedback Forum
2008-12-04 17:22:09 [Stijn Van de Velde] [reply
Niet volledig juist. Doordat D=0 weten we dat hier geen seizonaliteit is, en moeten we dus niet transformeren.
We moeten wel differentiëren om de lange termijn trend er uit te halen (d).

Daarnaast had je bij de Box-Cox transformation parameter nog je lambda waarde moeten invullen (zie Q5 op deze te vinden). Dan had je de tijdreeks nog meer stationair geweest en had ze nog meer binnen het betrouwbaarheidsinterval gelegen.
2008-12-08 01:08:38 [Kenny Simons] [reply
Ik ga akkoord met Stijn, de uitkomst is natuurlijk anders als bij Q7, maar toch heb je hier enkele fouten gemaakt.

Post a new message
Dataseries X:
7.4
7.2
7.1
6.9
6.8
6.8
6.8
6.9
6.7
6.6
6.5
6.4
6.3
6.3
6.3
6.5
6.6
6.5
6.4
6.5
6.7
7.1
7.1
7.2
7.2
7.3
7.3
7.3
7.3
7.4
7.6
7.6
7.6
7.7
7.8
7.9
8.1
8.1
8.1
8.2
8.2
8.2
8.2
8.2
8.2
8.3
8.3
8.4
8.4
8.4
8.3
8
8
8.2
8.6
8.7
8.7
8.5
8.4
8.4
8.4
8.5
8.5
8.5
8.5
8.5
8.4
8.4
8.4
8.5
8.6
8.6
8.6
8.6
8.5
8.4
8.4
8.3
8.2
8.1
8.2
8.1
8
7.9
7.8
7.7
7.7
7.9
7.8
7.6
7.4
7.3
7.1
7.1
7
7
7
6.9
6.8
6.7
6.6
6.6
Dataseries Y:
6.2
6.1
5.9
5.6
5.5
5.5
5.6
5.7
5.6
5.4
5.3
5.3
5.4
5.5
5.6
5.7
5.8
5.8
5.7
5.9
6.1
6.4
6.4
6.3
6.2
6.2
6.3
6.5
6.6
6.6
6.7
6.6
6.7
7
7.2
7.3
7.5
7.6
7.7
7.8
7.8
7.7
7.6
7.6
7.7
7.8
7.8
7.8
7.7
7.6
7.4
7.1
7.1
7.3
7.6
7.8
7.7
7.6
7.5
7.5
7.5
7.6
7.6
7.7
7.8
7.7
7.6
7.6
7.6
7.7
7.8
7.8
7.9
7.9
7.8
7.8
7.7
7.5
7.1
6.9
7.1
7.1
7.1
7
6.9
6.8
6.7
6.8
6.8
6.7
6.8
6.7
6.6
6.4
6.4
6.4
6.5
6.5
6.4
6.3
6.2
6.3


Summary of computational transaction
Raw Inputview raw input (R code)
Raw Outputview raw output of R engine
Computing time1 seconds
R Server'Gwilym Jenkins' @ 72.249.127.135

\begin{tabular}{lllllllll}
\hline
Summary of computational transaction \tabularnewline
Raw Input & view raw input (R code)  \tabularnewline
Raw Output & view raw output of R engine  \tabularnewline
Computing time & 1 seconds \tabularnewline
R Server & 'Gwilym Jenkins' @ 72.249.127.135 \tabularnewline
\hline
\end{tabular}
%Source: https://freestatistics.org/blog/index.php?pk=26111&T=0

[TABLE]
[ROW][C]Summary of computational transaction[/C][/ROW]
[ROW][C]Raw Input[/C][C]view raw input (R code) [/C][/ROW]
[ROW][C]Raw Output[/C][C]view raw output of R engine [/C][/ROW]
[ROW][C]Computing time[/C][C]1 seconds[/C][/ROW]
[ROW][C]R Server[/C][C]'Gwilym Jenkins' @ 72.249.127.135[/C][/ROW]
[/TABLE]
Source: https://freestatistics.org/blog/index.php?pk=26111&T=0

Globally Unique Identifier (entire table): ba.freestatistics.org/blog/index.php?pk=26111&T=0

As an alternative you can also use a QR Code:  

The GUIDs for individual cells are displayed in the table below:

Summary of computational transaction
Raw Inputview raw input (R code)
Raw Outputview raw output of R engine
Computing time1 seconds
R Server'Gwilym Jenkins' @ 72.249.127.135


Cross Correlation Function
ParameterValue
Box-Cox transformation parameter (lambda) of X series0
Degree of non-seasonal differencing (d) of X series1
Degree of seasonal differencing (D) of X series0
Seasonal Period (s)12
Box-Cox transformation parameter (lambda) of Y series0
Degree of non-seasonal differencing (d) of Y series2
Degree of seasonal differencing (D) of Y series0
krho(Y[t],X[t+k])
-16-0.0121676191054562
-15-0.0849379148287803
-14-0.0580612025162025
-130.154422426202352
-120.00582322654712231
-110.0111390955491064
-10-0.0941930661468272
-9-0.0556969905135331
-8-0.0654272260316493
-7-0.0736096897903748
-60.0387292860229889
-50.0732544138963451
-40.143488119990900
-30.00912287782314714
-2-0.130563919045966
-1-0.368466784758953
0-0.316363520628127
10.264434380364746
20.281784128167540
30.140939593336314
40.000609928729286525
5-0.0832526571580027
6-0.149568021986391
7-0.0477381085755057
8-0.0495744895672013
9-0.0121275013098313
100.194186478606951
110.12033746029329
120.122963358413814
13-0.136582398924306
14-0.190292856468114
15-0.0614296603085336
160.105711783337023

\begin{tabular}{lllllllll}
\hline
Cross Correlation Function \tabularnewline
Parameter & Value \tabularnewline
Box-Cox transformation parameter (lambda) of X series & 0 \tabularnewline
Degree of non-seasonal differencing (d) of X series & 1 \tabularnewline
Degree of seasonal differencing (D) of X series & 0 \tabularnewline
Seasonal Period (s) & 12 \tabularnewline
Box-Cox transformation parameter (lambda) of Y series & 0 \tabularnewline
Degree of non-seasonal differencing (d) of Y series & 2 \tabularnewline
Degree of seasonal differencing (D) of Y series & 0 \tabularnewline
k & rho(Y[t],X[t+k]) \tabularnewline
-16 & -0.0121676191054562 \tabularnewline
-15 & -0.0849379148287803 \tabularnewline
-14 & -0.0580612025162025 \tabularnewline
-13 & 0.154422426202352 \tabularnewline
-12 & 0.00582322654712231 \tabularnewline
-11 & 0.0111390955491064 \tabularnewline
-10 & -0.0941930661468272 \tabularnewline
-9 & -0.0556969905135331 \tabularnewline
-8 & -0.0654272260316493 \tabularnewline
-7 & -0.0736096897903748 \tabularnewline
-6 & 0.0387292860229889 \tabularnewline
-5 & 0.0732544138963451 \tabularnewline
-4 & 0.143488119990900 \tabularnewline
-3 & 0.00912287782314714 \tabularnewline
-2 & -0.130563919045966 \tabularnewline
-1 & -0.368466784758953 \tabularnewline
0 & -0.316363520628127 \tabularnewline
1 & 0.264434380364746 \tabularnewline
2 & 0.281784128167540 \tabularnewline
3 & 0.140939593336314 \tabularnewline
4 & 0.000609928729286525 \tabularnewline
5 & -0.0832526571580027 \tabularnewline
6 & -0.149568021986391 \tabularnewline
7 & -0.0477381085755057 \tabularnewline
8 & -0.0495744895672013 \tabularnewline
9 & -0.0121275013098313 \tabularnewline
10 & 0.194186478606951 \tabularnewline
11 & 0.12033746029329 \tabularnewline
12 & 0.122963358413814 \tabularnewline
13 & -0.136582398924306 \tabularnewline
14 & -0.190292856468114 \tabularnewline
15 & -0.0614296603085336 \tabularnewline
16 & 0.105711783337023 \tabularnewline
\hline
\end{tabular}
%Source: https://freestatistics.org/blog/index.php?pk=26111&T=1

[TABLE]
[ROW][C]Cross Correlation Function[/C][/ROW]
[ROW][C]Parameter[/C][C]Value[/C][/ROW]
[ROW][C]Box-Cox transformation parameter (lambda) of X series[/C][C]0[/C][/ROW]
[ROW][C]Degree of non-seasonal differencing (d) of X series[/C][C]1[/C][/ROW]
[ROW][C]Degree of seasonal differencing (D) of X series[/C][C]0[/C][/ROW]
[ROW][C]Seasonal Period (s)[/C][C]12[/C][/ROW]
[ROW][C]Box-Cox transformation parameter (lambda) of Y series[/C][C]0[/C][/ROW]
[ROW][C]Degree of non-seasonal differencing (d) of Y series[/C][C]2[/C][/ROW]
[ROW][C]Degree of seasonal differencing (D) of Y series[/C][C]0[/C][/ROW]
[ROW][C]k[/C][C]rho(Y[t],X[t+k])[/C][/ROW]
[ROW][C]-16[/C][C]-0.0121676191054562[/C][/ROW]
[ROW][C]-15[/C][C]-0.0849379148287803[/C][/ROW]
[ROW][C]-14[/C][C]-0.0580612025162025[/C][/ROW]
[ROW][C]-13[/C][C]0.154422426202352[/C][/ROW]
[ROW][C]-12[/C][C]0.00582322654712231[/C][/ROW]
[ROW][C]-11[/C][C]0.0111390955491064[/C][/ROW]
[ROW][C]-10[/C][C]-0.0941930661468272[/C][/ROW]
[ROW][C]-9[/C][C]-0.0556969905135331[/C][/ROW]
[ROW][C]-8[/C][C]-0.0654272260316493[/C][/ROW]
[ROW][C]-7[/C][C]-0.0736096897903748[/C][/ROW]
[ROW][C]-6[/C][C]0.0387292860229889[/C][/ROW]
[ROW][C]-5[/C][C]0.0732544138963451[/C][/ROW]
[ROW][C]-4[/C][C]0.143488119990900[/C][/ROW]
[ROW][C]-3[/C][C]0.00912287782314714[/C][/ROW]
[ROW][C]-2[/C][C]-0.130563919045966[/C][/ROW]
[ROW][C]-1[/C][C]-0.368466784758953[/C][/ROW]
[ROW][C]0[/C][C]-0.316363520628127[/C][/ROW]
[ROW][C]1[/C][C]0.264434380364746[/C][/ROW]
[ROW][C]2[/C][C]0.281784128167540[/C][/ROW]
[ROW][C]3[/C][C]0.140939593336314[/C][/ROW]
[ROW][C]4[/C][C]0.000609928729286525[/C][/ROW]
[ROW][C]5[/C][C]-0.0832526571580027[/C][/ROW]
[ROW][C]6[/C][C]-0.149568021986391[/C][/ROW]
[ROW][C]7[/C][C]-0.0477381085755057[/C][/ROW]
[ROW][C]8[/C][C]-0.0495744895672013[/C][/ROW]
[ROW][C]9[/C][C]-0.0121275013098313[/C][/ROW]
[ROW][C]10[/C][C]0.194186478606951[/C][/ROW]
[ROW][C]11[/C][C]0.12033746029329[/C][/ROW]
[ROW][C]12[/C][C]0.122963358413814[/C][/ROW]
[ROW][C]13[/C][C]-0.136582398924306[/C][/ROW]
[ROW][C]14[/C][C]-0.190292856468114[/C][/ROW]
[ROW][C]15[/C][C]-0.0614296603085336[/C][/ROW]
[ROW][C]16[/C][C]0.105711783337023[/C][/ROW]
[/TABLE]
Source: https://freestatistics.org/blog/index.php?pk=26111&T=1

Globally Unique Identifier (entire table): ba.freestatistics.org/blog/index.php?pk=26111&T=1

As an alternative you can also use a QR Code:  

The GUIDs for individual cells are displayed in the table below:

Cross Correlation Function
ParameterValue
Box-Cox transformation parameter (lambda) of X series0
Degree of non-seasonal differencing (d) of X series1
Degree of seasonal differencing (D) of X series0
Seasonal Period (s)12
Box-Cox transformation parameter (lambda) of Y series0
Degree of non-seasonal differencing (d) of Y series2
Degree of seasonal differencing (D) of Y series0
krho(Y[t],X[t+k])
-16-0.0121676191054562
-15-0.0849379148287803
-14-0.0580612025162025
-130.154422426202352
-120.00582322654712231
-110.0111390955491064
-10-0.0941930661468272
-9-0.0556969905135331
-8-0.0654272260316493
-7-0.0736096897903748
-60.0387292860229889
-50.0732544138963451
-40.143488119990900
-30.00912287782314714
-2-0.130563919045966
-1-0.368466784758953
0-0.316363520628127
10.264434380364746
20.281784128167540
30.140939593336314
40.000609928729286525
5-0.0832526571580027
6-0.149568021986391
7-0.0477381085755057
8-0.0495744895672013
9-0.0121275013098313
100.194186478606951
110.12033746029329
120.122963358413814
13-0.136582398924306
14-0.190292856468114
15-0.0614296603085336
160.105711783337023


Parameters (Session):
par1 = 500 ; par2 = 0.5 ;
Parameters (R input):
par1 = 0.0 ; par2 = 1 ; par3 = 0 ; par4 = 12 ; par5 = 0.0 ; par6 = 2 ; par7 = 0 ;
R code (references can be found in the software module):
par1 <- as.numeric(par1)
par2 <- as.numeric(par2)
par3 <- as.numeric(par3)
par4 <- as.numeric(par4)
par5 <- as.numeric(par5)
par6 <- as.numeric(par6)
par7 <- as.numeric(par7)
if (par1 == 0) {
x <- log(x)
} else {
x <- (x ^ par1 - 1) / par1
}
if (par5 == 0) {
y <- log(y)
} else {
y <- (y ^ par5 - 1) / par5
}
if (par2 > 0) x <- diff(x,lag=1,difference=par2)
if (par6 > 0) y <- diff(y,lag=1,difference=par6)
if (par3 > 0) x <- diff(x,lag=par4,difference=par3)
if (par7 > 0) y <- diff(y,lag=par4,difference=par7)
x
y
bitmap(file='test1.png')
(r <- ccf(x,y,main='Cross Correlation Function',ylab='CCF',xlab='Lag (k)'))
dev.off()
load(file='createtable')
a<-table.start()
a<-table.row.start(a)
a<-table.element(a,'Cross Correlation Function',2,TRUE)
a<-table.row.end(a)
a<-table.row.start(a)
a<-table.element(a,'Parameter',header=TRUE)
a<-table.element(a,'Value',header=TRUE)
a<-table.row.end(a)
a<-table.row.start(a)
a<-table.element(a,'Box-Cox transformation parameter (lambda) of X series',header=TRUE)
a<-table.element(a,par1)
a<-table.row.end(a)
a<-table.row.start(a)
a<-table.element(a,'Degree of non-seasonal differencing (d) of X series',header=TRUE)
a<-table.element(a,par2)
a<-table.row.end(a)
a<-table.row.start(a)
a<-table.element(a,'Degree of seasonal differencing (D) of X series',header=TRUE)
a<-table.element(a,par3)
a<-table.row.end(a)
a<-table.row.start(a)
a<-table.element(a,'Seasonal Period (s)',header=TRUE)
a<-table.element(a,par4)
a<-table.row.end(a)
a<-table.row.start(a)
a<-table.element(a,'Box-Cox transformation parameter (lambda) of Y series',header=TRUE)
a<-table.element(a,par5)
a<-table.row.end(a)
a<-table.row.start(a)
a<-table.element(a,'Degree of non-seasonal differencing (d) of Y series',header=TRUE)
a<-table.element(a,par6)
a<-table.row.end(a)
a<-table.row.start(a)
a<-table.element(a,'Degree of seasonal differencing (D) of Y series',header=TRUE)
a<-table.element(a,par7)
a<-table.row.end(a)
a<-table.row.start(a)
a<-table.element(a,'k',header=TRUE)
a<-table.element(a,'rho(Y[t],X[t+k])',header=TRUE)
a<-table.row.end(a)
mylength <- length(r$acf)
myhalf <- floor((mylength-1)/2)
for (i in 1:mylength) {
a<-table.row.start(a)
a<-table.element(a,i-myhalf-1,header=TRUE)
a<-table.element(a,r$acf[i])
a<-table.row.end(a)
}
a<-table.end(a)
table.save(a,file='mytable.tab')