Free Statistics

of Irreproducible Research!

Author's title

Author*The author of this computation has been verified*
R Software Modulerwasp_autocorrelation.wasp
Title produced by software(Partial) Autocorrelation Function
Date of computationFri, 28 Nov 2008 03:29:39 -0700
Cite this page as followsStatistical Computations at FreeStatistics.org, Office for Research Development and Education, URL https://freestatistics.org/blog/index.php?v=date/2008/Nov/28/t1227868222zqmnthg3u0e487e.htm/, Retrieved Sun, 19 May 2024 09:18:25 +0000
Statistical Computations at FreeStatistics.org, Office for Research Development and Education, URL https://freestatistics.org/blog/index.php?pk=25989, Retrieved Sun, 19 May 2024 09:18:25 +0000
QR Codes:

Original text written by user:d=0 D=1
IsPrivate?No (this computation is public)
User-defined keywords
Estimated Impact198
Family? (F = Feedback message, R = changed R code, M = changed R Module, P = changed Parameters, D = changed Data)
F     [Law of Averages] [Random Walk Simul...] [2008-11-25 18:40:39] [b98453cac15ba1066b407e146608df68]
F       [Law of Averages] [Random Walk Simul...] [2008-11-27 19:45:04] [58bf45a666dc5198906262e8815a9722]
F RMPD    [Standard Deviation-Mean Plot] [Standard Deviatio...] [2008-11-27 22:08:29] [58bf45a666dc5198906262e8815a9722]
- RMP       [(Partial) Autocorrelation Function] [(Partial) Autocor...] [2008-11-27 22:25:58] [58bf45a666dc5198906262e8815a9722]
-   PD          [(Partial) Autocorrelation Function] [(Partial) Autocor...] [2008-11-28 10:29:39] [63db34dadd44fb018112addcdefe949f] [Current]
Feedback Forum

Post a new message
Dataseries X:
101
88
108
116
104
110
105
107
124
109
102
125
102
101
116
114
115
119
108
110
120
113
111
121
99
104
117
108
122
122
111
111
131
108
118
119
104
105
118
124
123
114
119
116
129
112
123
124
117
110
118
135
127
117
137
130
132
142
122
126


Summary of computational transaction
Raw Inputview raw input (R code)
Raw Outputview raw output of R engine
Computing time4 seconds
R Server'Herman Ole Andreas Wold' @ 193.190.124.10:1001

\begin{tabular}{lllllllll}
\hline
Summary of computational transaction \tabularnewline
Raw Input & view raw input (R code)  \tabularnewline
Raw Output & view raw output of R engine  \tabularnewline
Computing time & 4 seconds \tabularnewline
R Server & 'Herman Ole Andreas Wold' @ 193.190.124.10:1001 \tabularnewline
\hline
\end{tabular}
%Source: https://freestatistics.org/blog/index.php?pk=25989&T=0

[TABLE]
[ROW][C]Summary of computational transaction[/C][/ROW]
[ROW][C]Raw Input[/C][C]view raw input (R code) [/C][/ROW]
[ROW][C]Raw Output[/C][C]view raw output of R engine [/C][/ROW]
[ROW][C]Computing time[/C][C]4 seconds[/C][/ROW]
[ROW][C]R Server[/C][C]'Herman Ole Andreas Wold' @ 193.190.124.10:1001[/C][/ROW]
[/TABLE]
Source: https://freestatistics.org/blog/index.php?pk=25989&T=0

Globally Unique Identifier (entire table): ba.freestatistics.org/blog/index.php?pk=25989&T=0

As an alternative you can also use a QR Code:  

The GUIDs for individual cells are displayed in the table below:

Summary of computational transaction
Raw Inputview raw input (R code)
Raw Outputview raw output of R engine
Computing time4 seconds
R Server'Herman Ole Andreas Wold' @ 193.190.124.10:1001


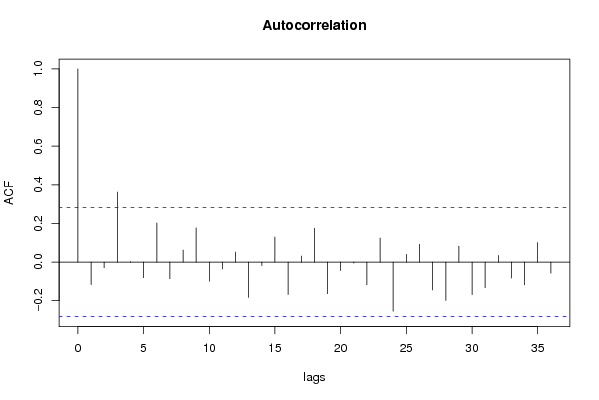
Autocorrelation Function
Time lag kACF(k)T-STATP-value
1-0.116992-0.81050.210813
2-0.029948-0.20750.418253
30.3625262.51170.007717
40.0027550.01910.492426
5-0.081067-0.56160.288485
60.2018141.39820.084239
7-0.086268-0.59770.276432
80.0619180.4290.334927
90.1765611.22330.113603
10-0.09896-0.68560.248126
11-0.036105-0.25010.401773
120.0516660.3580.360974
13-0.183566-1.27180.104788
14-0.01818-0.1260.450147
150.1295960.89790.186869
16-0.168064-1.16440.125012
170.0307910.21330.415989
180.1753241.21470.115215
19-0.163762-1.13460.131094
20-0.04433-0.30710.380038
21-0.005644-0.03910.484485
22-0.117325-0.81290.210158
230.1240920.85970.197104
24-0.2545-1.76320.042113
250.0391140.2710.393779
260.0922420.63910.262906
27-0.144667-1.00230.160617
28-0.199008-1.37880.087179
290.0823260.57040.285543
30-0.168653-1.16850.124196
31-0.1328-0.92010.18107
320.0338540.23450.407779
33-0.082673-0.57280.284736
34-0.118266-0.81940.208311
350.1007890.69830.244184
36-0.057965-0.40160.344884

\begin{tabular}{lllllllll}
\hline
Autocorrelation Function \tabularnewline
Time lag k & ACF(k) & T-STAT & P-value \tabularnewline
1 & -0.116992 & -0.8105 & 0.210813 \tabularnewline
2 & -0.029948 & -0.2075 & 0.418253 \tabularnewline
3 & 0.362526 & 2.5117 & 0.007717 \tabularnewline
4 & 0.002755 & 0.0191 & 0.492426 \tabularnewline
5 & -0.081067 & -0.5616 & 0.288485 \tabularnewline
6 & 0.201814 & 1.3982 & 0.084239 \tabularnewline
7 & -0.086268 & -0.5977 & 0.276432 \tabularnewline
8 & 0.061918 & 0.429 & 0.334927 \tabularnewline
9 & 0.176561 & 1.2233 & 0.113603 \tabularnewline
10 & -0.09896 & -0.6856 & 0.248126 \tabularnewline
11 & -0.036105 & -0.2501 & 0.401773 \tabularnewline
12 & 0.051666 & 0.358 & 0.360974 \tabularnewline
13 & -0.183566 & -1.2718 & 0.104788 \tabularnewline
14 & -0.01818 & -0.126 & 0.450147 \tabularnewline
15 & 0.129596 & 0.8979 & 0.186869 \tabularnewline
16 & -0.168064 & -1.1644 & 0.125012 \tabularnewline
17 & 0.030791 & 0.2133 & 0.415989 \tabularnewline
18 & 0.175324 & 1.2147 & 0.115215 \tabularnewline
19 & -0.163762 & -1.1346 & 0.131094 \tabularnewline
20 & -0.04433 & -0.3071 & 0.380038 \tabularnewline
21 & -0.005644 & -0.0391 & 0.484485 \tabularnewline
22 & -0.117325 & -0.8129 & 0.210158 \tabularnewline
23 & 0.124092 & 0.8597 & 0.197104 \tabularnewline
24 & -0.2545 & -1.7632 & 0.042113 \tabularnewline
25 & 0.039114 & 0.271 & 0.393779 \tabularnewline
26 & 0.092242 & 0.6391 & 0.262906 \tabularnewline
27 & -0.144667 & -1.0023 & 0.160617 \tabularnewline
28 & -0.199008 & -1.3788 & 0.087179 \tabularnewline
29 & 0.082326 & 0.5704 & 0.285543 \tabularnewline
30 & -0.168653 & -1.1685 & 0.124196 \tabularnewline
31 & -0.1328 & -0.9201 & 0.18107 \tabularnewline
32 & 0.033854 & 0.2345 & 0.407779 \tabularnewline
33 & -0.082673 & -0.5728 & 0.284736 \tabularnewline
34 & -0.118266 & -0.8194 & 0.208311 \tabularnewline
35 & 0.100789 & 0.6983 & 0.244184 \tabularnewline
36 & -0.057965 & -0.4016 & 0.344884 \tabularnewline
\hline
\end{tabular}
%Source: https://freestatistics.org/blog/index.php?pk=25989&T=1

[TABLE]
[ROW][C]Autocorrelation Function[/C][/ROW]
[ROW][C]Time lag k[/C][C]ACF(k)[/C][C]T-STAT[/C][C]P-value[/C][/ROW]
[ROW][C]1[/C][C]-0.116992[/C][C]-0.8105[/C][C]0.210813[/C][/ROW]
[ROW][C]2[/C][C]-0.029948[/C][C]-0.2075[/C][C]0.418253[/C][/ROW]
[ROW][C]3[/C][C]0.362526[/C][C]2.5117[/C][C]0.007717[/C][/ROW]
[ROW][C]4[/C][C]0.002755[/C][C]0.0191[/C][C]0.492426[/C][/ROW]
[ROW][C]5[/C][C]-0.081067[/C][C]-0.5616[/C][C]0.288485[/C][/ROW]
[ROW][C]6[/C][C]0.201814[/C][C]1.3982[/C][C]0.084239[/C][/ROW]
[ROW][C]7[/C][C]-0.086268[/C][C]-0.5977[/C][C]0.276432[/C][/ROW]
[ROW][C]8[/C][C]0.061918[/C][C]0.429[/C][C]0.334927[/C][/ROW]
[ROW][C]9[/C][C]0.176561[/C][C]1.2233[/C][C]0.113603[/C][/ROW]
[ROW][C]10[/C][C]-0.09896[/C][C]-0.6856[/C][C]0.248126[/C][/ROW]
[ROW][C]11[/C][C]-0.036105[/C][C]-0.2501[/C][C]0.401773[/C][/ROW]
[ROW][C]12[/C][C]0.051666[/C][C]0.358[/C][C]0.360974[/C][/ROW]
[ROW][C]13[/C][C]-0.183566[/C][C]-1.2718[/C][C]0.104788[/C][/ROW]
[ROW][C]14[/C][C]-0.01818[/C][C]-0.126[/C][C]0.450147[/C][/ROW]
[ROW][C]15[/C][C]0.129596[/C][C]0.8979[/C][C]0.186869[/C][/ROW]
[ROW][C]16[/C][C]-0.168064[/C][C]-1.1644[/C][C]0.125012[/C][/ROW]
[ROW][C]17[/C][C]0.030791[/C][C]0.2133[/C][C]0.415989[/C][/ROW]
[ROW][C]18[/C][C]0.175324[/C][C]1.2147[/C][C]0.115215[/C][/ROW]
[ROW][C]19[/C][C]-0.163762[/C][C]-1.1346[/C][C]0.131094[/C][/ROW]
[ROW][C]20[/C][C]-0.04433[/C][C]-0.3071[/C][C]0.380038[/C][/ROW]
[ROW][C]21[/C][C]-0.005644[/C][C]-0.0391[/C][C]0.484485[/C][/ROW]
[ROW][C]22[/C][C]-0.117325[/C][C]-0.8129[/C][C]0.210158[/C][/ROW]
[ROW][C]23[/C][C]0.124092[/C][C]0.8597[/C][C]0.197104[/C][/ROW]
[ROW][C]24[/C][C]-0.2545[/C][C]-1.7632[/C][C]0.042113[/C][/ROW]
[ROW][C]25[/C][C]0.039114[/C][C]0.271[/C][C]0.393779[/C][/ROW]
[ROW][C]26[/C][C]0.092242[/C][C]0.6391[/C][C]0.262906[/C][/ROW]
[ROW][C]27[/C][C]-0.144667[/C][C]-1.0023[/C][C]0.160617[/C][/ROW]
[ROW][C]28[/C][C]-0.199008[/C][C]-1.3788[/C][C]0.087179[/C][/ROW]
[ROW][C]29[/C][C]0.082326[/C][C]0.5704[/C][C]0.285543[/C][/ROW]
[ROW][C]30[/C][C]-0.168653[/C][C]-1.1685[/C][C]0.124196[/C][/ROW]
[ROW][C]31[/C][C]-0.1328[/C][C]-0.9201[/C][C]0.18107[/C][/ROW]
[ROW][C]32[/C][C]0.033854[/C][C]0.2345[/C][C]0.407779[/C][/ROW]
[ROW][C]33[/C][C]-0.082673[/C][C]-0.5728[/C][C]0.284736[/C][/ROW]
[ROW][C]34[/C][C]-0.118266[/C][C]-0.8194[/C][C]0.208311[/C][/ROW]
[ROW][C]35[/C][C]0.100789[/C][C]0.6983[/C][C]0.244184[/C][/ROW]
[ROW][C]36[/C][C]-0.057965[/C][C]-0.4016[/C][C]0.344884[/C][/ROW]
[/TABLE]
Source: https://freestatistics.org/blog/index.php?pk=25989&T=1

Globally Unique Identifier (entire table): ba.freestatistics.org/blog/index.php?pk=25989&T=1

As an alternative you can also use a QR Code:  

The GUIDs for individual cells are displayed in the table below:

Autocorrelation Function
Time lag kACF(k)T-STATP-value
1-0.116992-0.81050.210813
2-0.029948-0.20750.418253
30.3625262.51170.007717
40.0027550.01910.492426
5-0.081067-0.56160.288485
60.2018141.39820.084239
7-0.086268-0.59770.276432
80.0619180.4290.334927
90.1765611.22330.113603
10-0.09896-0.68560.248126
11-0.036105-0.25010.401773
120.0516660.3580.360974
13-0.183566-1.27180.104788
14-0.01818-0.1260.450147
150.1295960.89790.186869
16-0.168064-1.16440.125012
170.0307910.21330.415989
180.1753241.21470.115215
19-0.163762-1.13460.131094
20-0.04433-0.30710.380038
21-0.005644-0.03910.484485
22-0.117325-0.81290.210158
230.1240920.85970.197104
24-0.2545-1.76320.042113
250.0391140.2710.393779
260.0922420.63910.262906
27-0.144667-1.00230.160617
28-0.199008-1.37880.087179
290.0823260.57040.285543
30-0.168653-1.16850.124196
31-0.1328-0.92010.18107
320.0338540.23450.407779
33-0.082673-0.57280.284736
34-0.118266-0.81940.208311
350.1007890.69830.244184
36-0.057965-0.40160.344884


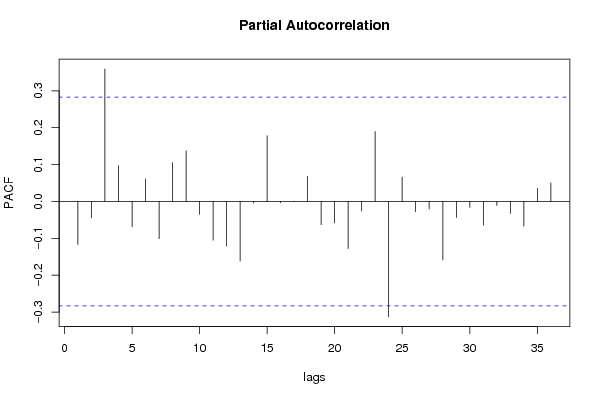
Partial Autocorrelation Function
Time lag kPACF(k)T-STATP-value
1-0.116992-0.81050.210813
2-0.044241-0.30650.380271
30.3593032.48930.008159
40.0971730.67320.252013
5-0.068448-0.47420.318746
60.0608820.42180.337526
7-0.101146-0.70080.243417
80.1052150.7290.234786
90.1373770.95180.17299
10-0.035107-0.24320.404433
11-0.105055-0.72780.235123
12-0.120999-0.83830.203008
13-0.161579-1.11950.134259
14-0.004294-0.02970.488195
150.1784451.23630.111181
16-0.003679-0.02550.489886
170.000890.00620.497552
180.0682740.4730.319173
19-0.062906-0.43580.33246
20-0.057788-0.40040.34533
21-0.127801-0.88540.190169
22-0.025927-0.17960.4291
230.1895771.31340.097642
24-0.312376-2.16420.017727
250.0662520.4590.324149
26-0.027819-0.19270.423989
27-0.020378-0.14120.444159
28-0.15858-1.09870.138696
29-0.043646-0.30240.38183
30-0.016191-0.11220.455577
31-0.064677-0.44810.328051
32-0.01075-0.07450.470471
33-0.032506-0.22520.411386
34-0.066828-0.4630.32273
350.035650.2470.402985
360.05010.34710.365016

\begin{tabular}{lllllllll}
\hline
Partial Autocorrelation Function \tabularnewline
Time lag k & PACF(k) & T-STAT & P-value \tabularnewline
1 & -0.116992 & -0.8105 & 0.210813 \tabularnewline
2 & -0.044241 & -0.3065 & 0.380271 \tabularnewline
3 & 0.359303 & 2.4893 & 0.008159 \tabularnewline
4 & 0.097173 & 0.6732 & 0.252013 \tabularnewline
5 & -0.068448 & -0.4742 & 0.318746 \tabularnewline
6 & 0.060882 & 0.4218 & 0.337526 \tabularnewline
7 & -0.101146 & -0.7008 & 0.243417 \tabularnewline
8 & 0.105215 & 0.729 & 0.234786 \tabularnewline
9 & 0.137377 & 0.9518 & 0.17299 \tabularnewline
10 & -0.035107 & -0.2432 & 0.404433 \tabularnewline
11 & -0.105055 & -0.7278 & 0.235123 \tabularnewline
12 & -0.120999 & -0.8383 & 0.203008 \tabularnewline
13 & -0.161579 & -1.1195 & 0.134259 \tabularnewline
14 & -0.004294 & -0.0297 & 0.488195 \tabularnewline
15 & 0.178445 & 1.2363 & 0.111181 \tabularnewline
16 & -0.003679 & -0.0255 & 0.489886 \tabularnewline
17 & 0.00089 & 0.0062 & 0.497552 \tabularnewline
18 & 0.068274 & 0.473 & 0.319173 \tabularnewline
19 & -0.062906 & -0.4358 & 0.33246 \tabularnewline
20 & -0.057788 & -0.4004 & 0.34533 \tabularnewline
21 & -0.127801 & -0.8854 & 0.190169 \tabularnewline
22 & -0.025927 & -0.1796 & 0.4291 \tabularnewline
23 & 0.189577 & 1.3134 & 0.097642 \tabularnewline
24 & -0.312376 & -2.1642 & 0.017727 \tabularnewline
25 & 0.066252 & 0.459 & 0.324149 \tabularnewline
26 & -0.027819 & -0.1927 & 0.423989 \tabularnewline
27 & -0.020378 & -0.1412 & 0.444159 \tabularnewline
28 & -0.15858 & -1.0987 & 0.138696 \tabularnewline
29 & -0.043646 & -0.3024 & 0.38183 \tabularnewline
30 & -0.016191 & -0.1122 & 0.455577 \tabularnewline
31 & -0.064677 & -0.4481 & 0.328051 \tabularnewline
32 & -0.01075 & -0.0745 & 0.470471 \tabularnewline
33 & -0.032506 & -0.2252 & 0.411386 \tabularnewline
34 & -0.066828 & -0.463 & 0.32273 \tabularnewline
35 & 0.03565 & 0.247 & 0.402985 \tabularnewline
36 & 0.0501 & 0.3471 & 0.365016 \tabularnewline
\hline
\end{tabular}
%Source: https://freestatistics.org/blog/index.php?pk=25989&T=2

[TABLE]
[ROW][C]Partial Autocorrelation Function[/C][/ROW]
[ROW][C]Time lag k[/C][C]PACF(k)[/C][C]T-STAT[/C][C]P-value[/C][/ROW]
[ROW][C]1[/C][C]-0.116992[/C][C]-0.8105[/C][C]0.210813[/C][/ROW]
[ROW][C]2[/C][C]-0.044241[/C][C]-0.3065[/C][C]0.380271[/C][/ROW]
[ROW][C]3[/C][C]0.359303[/C][C]2.4893[/C][C]0.008159[/C][/ROW]
[ROW][C]4[/C][C]0.097173[/C][C]0.6732[/C][C]0.252013[/C][/ROW]
[ROW][C]5[/C][C]-0.068448[/C][C]-0.4742[/C][C]0.318746[/C][/ROW]
[ROW][C]6[/C][C]0.060882[/C][C]0.4218[/C][C]0.337526[/C][/ROW]
[ROW][C]7[/C][C]-0.101146[/C][C]-0.7008[/C][C]0.243417[/C][/ROW]
[ROW][C]8[/C][C]0.105215[/C][C]0.729[/C][C]0.234786[/C][/ROW]
[ROW][C]9[/C][C]0.137377[/C][C]0.9518[/C][C]0.17299[/C][/ROW]
[ROW][C]10[/C][C]-0.035107[/C][C]-0.2432[/C][C]0.404433[/C][/ROW]
[ROW][C]11[/C][C]-0.105055[/C][C]-0.7278[/C][C]0.235123[/C][/ROW]
[ROW][C]12[/C][C]-0.120999[/C][C]-0.8383[/C][C]0.203008[/C][/ROW]
[ROW][C]13[/C][C]-0.161579[/C][C]-1.1195[/C][C]0.134259[/C][/ROW]
[ROW][C]14[/C][C]-0.004294[/C][C]-0.0297[/C][C]0.488195[/C][/ROW]
[ROW][C]15[/C][C]0.178445[/C][C]1.2363[/C][C]0.111181[/C][/ROW]
[ROW][C]16[/C][C]-0.003679[/C][C]-0.0255[/C][C]0.489886[/C][/ROW]
[ROW][C]17[/C][C]0.00089[/C][C]0.0062[/C][C]0.497552[/C][/ROW]
[ROW][C]18[/C][C]0.068274[/C][C]0.473[/C][C]0.319173[/C][/ROW]
[ROW][C]19[/C][C]-0.062906[/C][C]-0.4358[/C][C]0.33246[/C][/ROW]
[ROW][C]20[/C][C]-0.057788[/C][C]-0.4004[/C][C]0.34533[/C][/ROW]
[ROW][C]21[/C][C]-0.127801[/C][C]-0.8854[/C][C]0.190169[/C][/ROW]
[ROW][C]22[/C][C]-0.025927[/C][C]-0.1796[/C][C]0.4291[/C][/ROW]
[ROW][C]23[/C][C]0.189577[/C][C]1.3134[/C][C]0.097642[/C][/ROW]
[ROW][C]24[/C][C]-0.312376[/C][C]-2.1642[/C][C]0.017727[/C][/ROW]
[ROW][C]25[/C][C]0.066252[/C][C]0.459[/C][C]0.324149[/C][/ROW]
[ROW][C]26[/C][C]-0.027819[/C][C]-0.1927[/C][C]0.423989[/C][/ROW]
[ROW][C]27[/C][C]-0.020378[/C][C]-0.1412[/C][C]0.444159[/C][/ROW]
[ROW][C]28[/C][C]-0.15858[/C][C]-1.0987[/C][C]0.138696[/C][/ROW]
[ROW][C]29[/C][C]-0.043646[/C][C]-0.3024[/C][C]0.38183[/C][/ROW]
[ROW][C]30[/C][C]-0.016191[/C][C]-0.1122[/C][C]0.455577[/C][/ROW]
[ROW][C]31[/C][C]-0.064677[/C][C]-0.4481[/C][C]0.328051[/C][/ROW]
[ROW][C]32[/C][C]-0.01075[/C][C]-0.0745[/C][C]0.470471[/C][/ROW]
[ROW][C]33[/C][C]-0.032506[/C][C]-0.2252[/C][C]0.411386[/C][/ROW]
[ROW][C]34[/C][C]-0.066828[/C][C]-0.463[/C][C]0.32273[/C][/ROW]
[ROW][C]35[/C][C]0.03565[/C][C]0.247[/C][C]0.402985[/C][/ROW]
[ROW][C]36[/C][C]0.0501[/C][C]0.3471[/C][C]0.365016[/C][/ROW]
[/TABLE]
Source: https://freestatistics.org/blog/index.php?pk=25989&T=2

Globally Unique Identifier (entire table): ba.freestatistics.org/blog/index.php?pk=25989&T=2

As an alternative you can also use a QR Code:  

The GUIDs for individual cells are displayed in the table below:

Partial Autocorrelation Function
Time lag kPACF(k)T-STATP-value
1-0.116992-0.81050.210813
2-0.044241-0.30650.380271
30.3593032.48930.008159
40.0971730.67320.252013
5-0.068448-0.47420.318746
60.0608820.42180.337526
7-0.101146-0.70080.243417
80.1052150.7290.234786
90.1373770.95180.17299
10-0.035107-0.24320.404433
11-0.105055-0.72780.235123
12-0.120999-0.83830.203008
13-0.161579-1.11950.134259
14-0.004294-0.02970.488195
150.1784451.23630.111181
16-0.003679-0.02550.489886
170.000890.00620.497552
180.0682740.4730.319173
19-0.062906-0.43580.33246
20-0.057788-0.40040.34533
21-0.127801-0.88540.190169
22-0.025927-0.17960.4291
230.1895771.31340.097642
24-0.312376-2.16420.017727
250.0662520.4590.324149
26-0.027819-0.19270.423989
27-0.020378-0.14120.444159
28-0.15858-1.09870.138696
29-0.043646-0.30240.38183
30-0.016191-0.11220.455577
31-0.064677-0.44810.328051
32-0.01075-0.07450.470471
33-0.032506-0.22520.411386
34-0.066828-0.4630.32273
350.035650.2470.402985
360.05010.34710.365016


Parameters (Session):
par1 = 36 ; par2 = 1 ; par3 = 0 ; par4 = 1 ; par5 = 12 ;
Parameters (R input):
par1 = 36 ; par2 = 1 ; par3 = 0 ; par4 = 1 ; par5 = 12 ;
R code (references can be found in the software module):
if (par1 == 'Default') {
par1 = 10*log10(length(x))
} else {
par1 <- as.numeric(par1)
}
par2 <- as.numeric(par2)
par3 <- as.numeric(par3)
par4 <- as.numeric(par4)
par5 <- as.numeric(par5)
if (par2 == 0) {
x <- log(x)
} else {
x <- (x ^ par2 - 1) / par2
}
if (par3 > 0) x <- diff(x,lag=1,difference=par3)
if (par4 > 0) x <- diff(x,lag=par5,difference=par4)
bitmap(file='pic1.png')
racf <- acf(x,par1,main='Autocorrelation',xlab='lags',ylab='ACF')
dev.off()
bitmap(file='pic2.png')
rpacf <- pacf(x,par1,main='Partial Autocorrelation',xlab='lags',ylab='PACF')
dev.off()
(myacf <- c(racf$acf))
(mypacf <- c(rpacf$acf))
lengthx <- length(x)
sqrtn <- sqrt(lengthx)
load(file='createtable')
a<-table.start()
a<-table.row.start(a)
a<-table.element(a,'Autocorrelation Function',4,TRUE)
a<-table.row.end(a)
a<-table.row.start(a)
a<-table.element(a,'Time lag k',header=TRUE)
a<-table.element(a,hyperlink('basics.htm','ACF(k)','click here for more information about the Autocorrelation Function'),header=TRUE)
a<-table.element(a,'T-STAT',header=TRUE)
a<-table.element(a,'P-value',header=TRUE)
a<-table.row.end(a)
for (i in 2:(par1+1)) {
a<-table.row.start(a)
a<-table.element(a,i-1,header=TRUE)
a<-table.element(a,round(myacf[i],6))
mytstat <- myacf[i]*sqrtn
a<-table.element(a,round(mytstat,4))
a<-table.element(a,round(1-pt(abs(mytstat),lengthx),6))
a<-table.row.end(a)
}
a<-table.end(a)
table.save(a,file='mytable.tab')
a<-table.start()
a<-table.row.start(a)
a<-table.element(a,'Partial Autocorrelation Function',4,TRUE)
a<-table.row.end(a)
a<-table.row.start(a)
a<-table.element(a,'Time lag k',header=TRUE)
a<-table.element(a,hyperlink('basics.htm','PACF(k)','click here for more information about the Partial Autocorrelation Function'),header=TRUE)
a<-table.element(a,'T-STAT',header=TRUE)
a<-table.element(a,'P-value',header=TRUE)
a<-table.row.end(a)
for (i in 1:par1) {
a<-table.row.start(a)
a<-table.element(a,i,header=TRUE)
a<-table.element(a,round(mypacf[i],6))
mytstat <- mypacf[i]*sqrtn
a<-table.element(a,round(mytstat,4))
a<-table.element(a,round(1-pt(abs(mytstat),lengthx),6))
a<-table.row.end(a)
}
a<-table.end(a)
table.save(a,file='mytable1.tab')