Free Statistics

of Irreproducible Research!

Author's title

Author*The author of this computation has been verified*
R Software Modulerwasp_autocorrelation.wasp
Title produced by software(Partial) Autocorrelation Function
Date of computationFri, 28 Nov 2008 03:20:24 -0700
Cite this page as followsStatistical Computations at FreeStatistics.org, Office for Research Development and Education, URL https://freestatistics.org/blog/index.php?v=date/2008/Nov/28/t1227867662p46pu6vd0el1z7v.htm/, Retrieved Sun, 19 May 2024 10:06:27 +0000
Statistical Computations at FreeStatistics.org, Office for Research Development and Education, URL https://freestatistics.org/blog/index.php?pk=25985, Retrieved Sun, 19 May 2024 10:06:27 +0000
QR Codes:

Original text written by user:d=1 D=1
IsPrivate?No (this computation is public)
User-defined keywords
Estimated Impact184
Family? (F = Feedback message, R = changed R code, M = changed R Module, P = changed Parameters, D = changed Data)
F     [Law of Averages] [Random Walk Simul...] [2008-11-25 18:40:39] [b98453cac15ba1066b407e146608df68]
F       [Law of Averages] [Random Walk Simul...] [2008-11-27 19:45:04] [58bf45a666dc5198906262e8815a9722]
F RMPD    [Standard Deviation-Mean Plot] [Standard Deviatio...] [2008-11-27 22:08:29] [58bf45a666dc5198906262e8815a9722]
- RMP       [(Partial) Autocorrelation Function] [(Partial) Autocor...] [2008-11-27 22:25:58] [58bf45a666dc5198906262e8815a9722]
F   P           [(Partial) Autocorrelation Function] [(Partial) Autocor...] [2008-11-28 10:20:24] [63db34dadd44fb018112addcdefe949f] [Current]
Feedback Forum
2008-12-04 15:32:49 [Matthieu Blondeau] [reply
Men moet de 'd' en 'D' veranderen om zo de reeks stationair te maken. Dit is correct.

Post a new message
Dataseries X:
106
82
114
118
105
105
103
107
123
112
104
122
108
94
120
118
117
113
106
108
122
115
110
120
104
96
121
111
120
114
107
108
127
105
119
121
106
97
119
122
121
106
114
112
127
109
118
123
115
105
116
131
121
104
127
126
124
132
117
123


Summary of computational transaction
Raw Inputview raw input (R code)
Raw Outputview raw output of R engine
Computing time8 seconds
R Server'George Udny Yule' @ 72.249.76.132

\begin{tabular}{lllllllll}
\hline
Summary of computational transaction \tabularnewline
Raw Input & view raw input (R code)  \tabularnewline
Raw Output & view raw output of R engine  \tabularnewline
Computing time & 8 seconds \tabularnewline
R Server & 'George Udny Yule' @ 72.249.76.132 \tabularnewline
\hline
\end{tabular}
%Source: https://freestatistics.org/blog/index.php?pk=25985&T=0

[TABLE]
[ROW][C]Summary of computational transaction[/C][/ROW]
[ROW][C]Raw Input[/C][C]view raw input (R code) [/C][/ROW]
[ROW][C]Raw Output[/C][C]view raw output of R engine [/C][/ROW]
[ROW][C]Computing time[/C][C]8 seconds[/C][/ROW]
[ROW][C]R Server[/C][C]'George Udny Yule' @ 72.249.76.132[/C][/ROW]
[/TABLE]
Source: https://freestatistics.org/blog/index.php?pk=25985&T=0

Globally Unique Identifier (entire table): ba.freestatistics.org/blog/index.php?pk=25985&T=0

As an alternative you can also use a QR Code:  

The GUIDs for individual cells are displayed in the table below:

Summary of computational transaction
Raw Inputview raw input (R code)
Raw Outputview raw output of R engine
Computing time8 seconds
R Server'George Udny Yule' @ 72.249.76.132


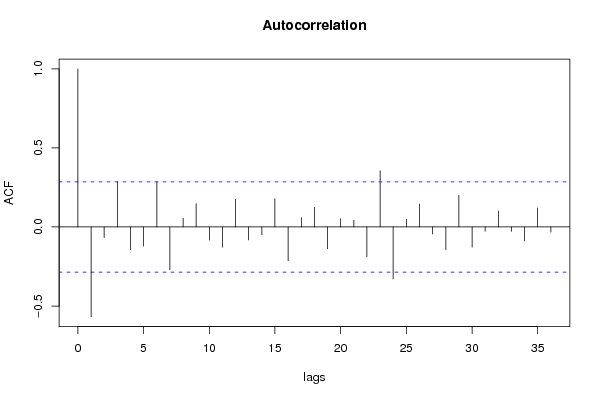
Autocorrelation Function
Time lag kACF(k)T-STATP-value
1-0.567323-3.88940.000157
2-0.067247-0.4610.323454
30.2874021.97030.027354
4-0.144658-0.99170.163205
5-0.120635-0.8270.206199
60.287621.97180.027266
7-0.270412-1.85390.035021
80.0557620.38230.351987
90.1477311.01280.158173
10-0.082519-0.56570.287137
11-0.127774-0.8760.192749
120.1752041.20110.117858
13-0.082332-0.56440.28757
14-0.048681-0.33370.37003
150.1790511.22750.112871
16-0.213293-1.46230.075162
170.0583560.40010.345458
180.1246630.85460.198541
19-0.138197-0.94740.174133
200.0525970.36060.360012
210.043020.29490.384674
22-0.188435-1.29180.101364
230.3555742.43770.009309
24-0.328482-2.2520.014518
250.0490160.3360.369169
260.1450640.99450.162535
27-0.04374-0.29990.382801
28-0.14254-0.97720.166736
290.2001791.37240.088233
30-0.127956-0.87720.192414
31-0.027136-0.1860.42661
320.1016440.69680.244669
33-0.027397-0.18780.425912
34-0.088278-0.60520.273978
350.1198880.82190.20764
36-0.032518-0.22290.412277

\begin{tabular}{lllllllll}
\hline
Autocorrelation Function \tabularnewline
Time lag k & ACF(k) & T-STAT & P-value \tabularnewline
1 & -0.567323 & -3.8894 & 0.000157 \tabularnewline
2 & -0.067247 & -0.461 & 0.323454 \tabularnewline
3 & 0.287402 & 1.9703 & 0.027354 \tabularnewline
4 & -0.144658 & -0.9917 & 0.163205 \tabularnewline
5 & -0.120635 & -0.827 & 0.206199 \tabularnewline
6 & 0.28762 & 1.9718 & 0.027266 \tabularnewline
7 & -0.270412 & -1.8539 & 0.035021 \tabularnewline
8 & 0.055762 & 0.3823 & 0.351987 \tabularnewline
9 & 0.147731 & 1.0128 & 0.158173 \tabularnewline
10 & -0.082519 & -0.5657 & 0.287137 \tabularnewline
11 & -0.127774 & -0.876 & 0.192749 \tabularnewline
12 & 0.175204 & 1.2011 & 0.117858 \tabularnewline
13 & -0.082332 & -0.5644 & 0.28757 \tabularnewline
14 & -0.048681 & -0.3337 & 0.37003 \tabularnewline
15 & 0.179051 & 1.2275 & 0.112871 \tabularnewline
16 & -0.213293 & -1.4623 & 0.075162 \tabularnewline
17 & 0.058356 & 0.4001 & 0.345458 \tabularnewline
18 & 0.124663 & 0.8546 & 0.198541 \tabularnewline
19 & -0.138197 & -0.9474 & 0.174133 \tabularnewline
20 & 0.052597 & 0.3606 & 0.360012 \tabularnewline
21 & 0.04302 & 0.2949 & 0.384674 \tabularnewline
22 & -0.188435 & -1.2918 & 0.101364 \tabularnewline
23 & 0.355574 & 2.4377 & 0.009309 \tabularnewline
24 & -0.328482 & -2.252 & 0.014518 \tabularnewline
25 & 0.049016 & 0.336 & 0.369169 \tabularnewline
26 & 0.145064 & 0.9945 & 0.162535 \tabularnewline
27 & -0.04374 & -0.2999 & 0.382801 \tabularnewline
28 & -0.14254 & -0.9772 & 0.166736 \tabularnewline
29 & 0.200179 & 1.3724 & 0.088233 \tabularnewline
30 & -0.127956 & -0.8772 & 0.192414 \tabularnewline
31 & -0.027136 & -0.186 & 0.42661 \tabularnewline
32 & 0.101644 & 0.6968 & 0.244669 \tabularnewline
33 & -0.027397 & -0.1878 & 0.425912 \tabularnewline
34 & -0.088278 & -0.6052 & 0.273978 \tabularnewline
35 & 0.119888 & 0.8219 & 0.20764 \tabularnewline
36 & -0.032518 & -0.2229 & 0.412277 \tabularnewline
\hline
\end{tabular}
%Source: https://freestatistics.org/blog/index.php?pk=25985&T=1

[TABLE]
[ROW][C]Autocorrelation Function[/C][/ROW]
[ROW][C]Time lag k[/C][C]ACF(k)[/C][C]T-STAT[/C][C]P-value[/C][/ROW]
[ROW][C]1[/C][C]-0.567323[/C][C]-3.8894[/C][C]0.000157[/C][/ROW]
[ROW][C]2[/C][C]-0.067247[/C][C]-0.461[/C][C]0.323454[/C][/ROW]
[ROW][C]3[/C][C]0.287402[/C][C]1.9703[/C][C]0.027354[/C][/ROW]
[ROW][C]4[/C][C]-0.144658[/C][C]-0.9917[/C][C]0.163205[/C][/ROW]
[ROW][C]5[/C][C]-0.120635[/C][C]-0.827[/C][C]0.206199[/C][/ROW]
[ROW][C]6[/C][C]0.28762[/C][C]1.9718[/C][C]0.027266[/C][/ROW]
[ROW][C]7[/C][C]-0.270412[/C][C]-1.8539[/C][C]0.035021[/C][/ROW]
[ROW][C]8[/C][C]0.055762[/C][C]0.3823[/C][C]0.351987[/C][/ROW]
[ROW][C]9[/C][C]0.147731[/C][C]1.0128[/C][C]0.158173[/C][/ROW]
[ROW][C]10[/C][C]-0.082519[/C][C]-0.5657[/C][C]0.287137[/C][/ROW]
[ROW][C]11[/C][C]-0.127774[/C][C]-0.876[/C][C]0.192749[/C][/ROW]
[ROW][C]12[/C][C]0.175204[/C][C]1.2011[/C][C]0.117858[/C][/ROW]
[ROW][C]13[/C][C]-0.082332[/C][C]-0.5644[/C][C]0.28757[/C][/ROW]
[ROW][C]14[/C][C]-0.048681[/C][C]-0.3337[/C][C]0.37003[/C][/ROW]
[ROW][C]15[/C][C]0.179051[/C][C]1.2275[/C][C]0.112871[/C][/ROW]
[ROW][C]16[/C][C]-0.213293[/C][C]-1.4623[/C][C]0.075162[/C][/ROW]
[ROW][C]17[/C][C]0.058356[/C][C]0.4001[/C][C]0.345458[/C][/ROW]
[ROW][C]18[/C][C]0.124663[/C][C]0.8546[/C][C]0.198541[/C][/ROW]
[ROW][C]19[/C][C]-0.138197[/C][C]-0.9474[/C][C]0.174133[/C][/ROW]
[ROW][C]20[/C][C]0.052597[/C][C]0.3606[/C][C]0.360012[/C][/ROW]
[ROW][C]21[/C][C]0.04302[/C][C]0.2949[/C][C]0.384674[/C][/ROW]
[ROW][C]22[/C][C]-0.188435[/C][C]-1.2918[/C][C]0.101364[/C][/ROW]
[ROW][C]23[/C][C]0.355574[/C][C]2.4377[/C][C]0.009309[/C][/ROW]
[ROW][C]24[/C][C]-0.328482[/C][C]-2.252[/C][C]0.014518[/C][/ROW]
[ROW][C]25[/C][C]0.049016[/C][C]0.336[/C][C]0.369169[/C][/ROW]
[ROW][C]26[/C][C]0.145064[/C][C]0.9945[/C][C]0.162535[/C][/ROW]
[ROW][C]27[/C][C]-0.04374[/C][C]-0.2999[/C][C]0.382801[/C][/ROW]
[ROW][C]28[/C][C]-0.14254[/C][C]-0.9772[/C][C]0.166736[/C][/ROW]
[ROW][C]29[/C][C]0.200179[/C][C]1.3724[/C][C]0.088233[/C][/ROW]
[ROW][C]30[/C][C]-0.127956[/C][C]-0.8772[/C][C]0.192414[/C][/ROW]
[ROW][C]31[/C][C]-0.027136[/C][C]-0.186[/C][C]0.42661[/C][/ROW]
[ROW][C]32[/C][C]0.101644[/C][C]0.6968[/C][C]0.244669[/C][/ROW]
[ROW][C]33[/C][C]-0.027397[/C][C]-0.1878[/C][C]0.425912[/C][/ROW]
[ROW][C]34[/C][C]-0.088278[/C][C]-0.6052[/C][C]0.273978[/C][/ROW]
[ROW][C]35[/C][C]0.119888[/C][C]0.8219[/C][C]0.20764[/C][/ROW]
[ROW][C]36[/C][C]-0.032518[/C][C]-0.2229[/C][C]0.412277[/C][/ROW]
[/TABLE]
Source: https://freestatistics.org/blog/index.php?pk=25985&T=1

Globally Unique Identifier (entire table): ba.freestatistics.org/blog/index.php?pk=25985&T=1

As an alternative you can also use a QR Code:  

The GUIDs for individual cells are displayed in the table below:

Autocorrelation Function
Time lag kACF(k)T-STATP-value
1-0.567323-3.88940.000157
2-0.067247-0.4610.323454
30.2874021.97030.027354
4-0.144658-0.99170.163205
5-0.120635-0.8270.206199
60.287621.97180.027266
7-0.270412-1.85390.035021
80.0557620.38230.351987
90.1477311.01280.158173
10-0.082519-0.56570.287137
11-0.127774-0.8760.192749
120.1752041.20110.117858
13-0.082332-0.56440.28757
14-0.048681-0.33370.37003
150.1790511.22750.112871
16-0.213293-1.46230.075162
170.0583560.40010.345458
180.1246630.85460.198541
19-0.138197-0.94740.174133
200.0525970.36060.360012
210.043020.29490.384674
22-0.188435-1.29180.101364
230.3555742.43770.009309
24-0.328482-2.2520.014518
250.0490160.3360.369169
260.1450640.99450.162535
27-0.04374-0.29990.382801
28-0.14254-0.97720.166736
290.2001791.37240.088233
30-0.127956-0.87720.192414
31-0.027136-0.1860.42661
320.1016440.69680.244669
33-0.027397-0.18780.425912
34-0.088278-0.60520.273978
350.1198880.82190.20764
36-0.032518-0.22290.412277


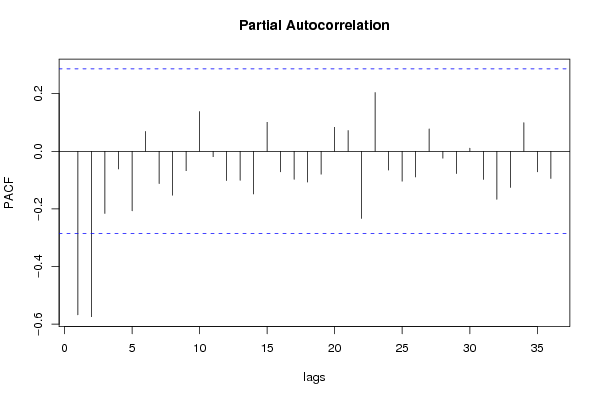
Partial Autocorrelation Function
Time lag kPACF(k)T-STATP-value
1-0.567323-3.88940.000157
2-0.573776-3.93360.000137
3-0.21578-1.47930.072865
4-0.060936-0.41780.339014
5-0.206328-1.41450.081901
60.0690240.47320.319128
7-0.111708-0.76580.223803
8-0.152223-1.04360.151008
9-0.067053-0.45970.323929
100.1381370.9470.174236
11-0.018516-0.12690.449765
12-0.10146-0.69560.245059
13-0.100589-0.68960.246917
14-0.147913-1.0140.157878
150.1005630.68940.246973
16-0.071112-0.48750.314078
17-0.097292-0.6670.254018
18-0.106588-0.73070.234286
19-0.079386-0.54420.294425
200.083540.57270.284782
210.0718840.49280.312221
22-0.233055-1.59770.058401
230.2041381.39950.084115
24-0.065095-0.44630.328726
25-0.103697-0.71090.240326
26-0.089092-0.61080.272143
270.0777980.53340.29815
28-0.023781-0.1630.435596
29-0.077078-0.52840.299846
300.0109520.07510.470233
31-0.097483-0.66830.253603
32-0.16673-1.1430.129405
33-0.125522-0.86050.196932
340.0995620.68260.249117
35-0.070948-0.48640.314474
36-0.094318-0.64660.260515

\begin{tabular}{lllllllll}
\hline
Partial Autocorrelation Function \tabularnewline
Time lag k & PACF(k) & T-STAT & P-value \tabularnewline
1 & -0.567323 & -3.8894 & 0.000157 \tabularnewline
2 & -0.573776 & -3.9336 & 0.000137 \tabularnewline
3 & -0.21578 & -1.4793 & 0.072865 \tabularnewline
4 & -0.060936 & -0.4178 & 0.339014 \tabularnewline
5 & -0.206328 & -1.4145 & 0.081901 \tabularnewline
6 & 0.069024 & 0.4732 & 0.319128 \tabularnewline
7 & -0.111708 & -0.7658 & 0.223803 \tabularnewline
8 & -0.152223 & -1.0436 & 0.151008 \tabularnewline
9 & -0.067053 & -0.4597 & 0.323929 \tabularnewline
10 & 0.138137 & 0.947 & 0.174236 \tabularnewline
11 & -0.018516 & -0.1269 & 0.449765 \tabularnewline
12 & -0.10146 & -0.6956 & 0.245059 \tabularnewline
13 & -0.100589 & -0.6896 & 0.246917 \tabularnewline
14 & -0.147913 & -1.014 & 0.157878 \tabularnewline
15 & 0.100563 & 0.6894 & 0.246973 \tabularnewline
16 & -0.071112 & -0.4875 & 0.314078 \tabularnewline
17 & -0.097292 & -0.667 & 0.254018 \tabularnewline
18 & -0.106588 & -0.7307 & 0.234286 \tabularnewline
19 & -0.079386 & -0.5442 & 0.294425 \tabularnewline
20 & 0.08354 & 0.5727 & 0.284782 \tabularnewline
21 & 0.071884 & 0.4928 & 0.312221 \tabularnewline
22 & -0.233055 & -1.5977 & 0.058401 \tabularnewline
23 & 0.204138 & 1.3995 & 0.084115 \tabularnewline
24 & -0.065095 & -0.4463 & 0.328726 \tabularnewline
25 & -0.103697 & -0.7109 & 0.240326 \tabularnewline
26 & -0.089092 & -0.6108 & 0.272143 \tabularnewline
27 & 0.077798 & 0.5334 & 0.29815 \tabularnewline
28 & -0.023781 & -0.163 & 0.435596 \tabularnewline
29 & -0.077078 & -0.5284 & 0.299846 \tabularnewline
30 & 0.010952 & 0.0751 & 0.470233 \tabularnewline
31 & -0.097483 & -0.6683 & 0.253603 \tabularnewline
32 & -0.16673 & -1.143 & 0.129405 \tabularnewline
33 & -0.125522 & -0.8605 & 0.196932 \tabularnewline
34 & 0.099562 & 0.6826 & 0.249117 \tabularnewline
35 & -0.070948 & -0.4864 & 0.314474 \tabularnewline
36 & -0.094318 & -0.6466 & 0.260515 \tabularnewline
\hline
\end{tabular}
%Source: https://freestatistics.org/blog/index.php?pk=25985&T=2

[TABLE]
[ROW][C]Partial Autocorrelation Function[/C][/ROW]
[ROW][C]Time lag k[/C][C]PACF(k)[/C][C]T-STAT[/C][C]P-value[/C][/ROW]
[ROW][C]1[/C][C]-0.567323[/C][C]-3.8894[/C][C]0.000157[/C][/ROW]
[ROW][C]2[/C][C]-0.573776[/C][C]-3.9336[/C][C]0.000137[/C][/ROW]
[ROW][C]3[/C][C]-0.21578[/C][C]-1.4793[/C][C]0.072865[/C][/ROW]
[ROW][C]4[/C][C]-0.060936[/C][C]-0.4178[/C][C]0.339014[/C][/ROW]
[ROW][C]5[/C][C]-0.206328[/C][C]-1.4145[/C][C]0.081901[/C][/ROW]
[ROW][C]6[/C][C]0.069024[/C][C]0.4732[/C][C]0.319128[/C][/ROW]
[ROW][C]7[/C][C]-0.111708[/C][C]-0.7658[/C][C]0.223803[/C][/ROW]
[ROW][C]8[/C][C]-0.152223[/C][C]-1.0436[/C][C]0.151008[/C][/ROW]
[ROW][C]9[/C][C]-0.067053[/C][C]-0.4597[/C][C]0.323929[/C][/ROW]
[ROW][C]10[/C][C]0.138137[/C][C]0.947[/C][C]0.174236[/C][/ROW]
[ROW][C]11[/C][C]-0.018516[/C][C]-0.1269[/C][C]0.449765[/C][/ROW]
[ROW][C]12[/C][C]-0.10146[/C][C]-0.6956[/C][C]0.245059[/C][/ROW]
[ROW][C]13[/C][C]-0.100589[/C][C]-0.6896[/C][C]0.246917[/C][/ROW]
[ROW][C]14[/C][C]-0.147913[/C][C]-1.014[/C][C]0.157878[/C][/ROW]
[ROW][C]15[/C][C]0.100563[/C][C]0.6894[/C][C]0.246973[/C][/ROW]
[ROW][C]16[/C][C]-0.071112[/C][C]-0.4875[/C][C]0.314078[/C][/ROW]
[ROW][C]17[/C][C]-0.097292[/C][C]-0.667[/C][C]0.254018[/C][/ROW]
[ROW][C]18[/C][C]-0.106588[/C][C]-0.7307[/C][C]0.234286[/C][/ROW]
[ROW][C]19[/C][C]-0.079386[/C][C]-0.5442[/C][C]0.294425[/C][/ROW]
[ROW][C]20[/C][C]0.08354[/C][C]0.5727[/C][C]0.284782[/C][/ROW]
[ROW][C]21[/C][C]0.071884[/C][C]0.4928[/C][C]0.312221[/C][/ROW]
[ROW][C]22[/C][C]-0.233055[/C][C]-1.5977[/C][C]0.058401[/C][/ROW]
[ROW][C]23[/C][C]0.204138[/C][C]1.3995[/C][C]0.084115[/C][/ROW]
[ROW][C]24[/C][C]-0.065095[/C][C]-0.4463[/C][C]0.328726[/C][/ROW]
[ROW][C]25[/C][C]-0.103697[/C][C]-0.7109[/C][C]0.240326[/C][/ROW]
[ROW][C]26[/C][C]-0.089092[/C][C]-0.6108[/C][C]0.272143[/C][/ROW]
[ROW][C]27[/C][C]0.077798[/C][C]0.5334[/C][C]0.29815[/C][/ROW]
[ROW][C]28[/C][C]-0.023781[/C][C]-0.163[/C][C]0.435596[/C][/ROW]
[ROW][C]29[/C][C]-0.077078[/C][C]-0.5284[/C][C]0.299846[/C][/ROW]
[ROW][C]30[/C][C]0.010952[/C][C]0.0751[/C][C]0.470233[/C][/ROW]
[ROW][C]31[/C][C]-0.097483[/C][C]-0.6683[/C][C]0.253603[/C][/ROW]
[ROW][C]32[/C][C]-0.16673[/C][C]-1.143[/C][C]0.129405[/C][/ROW]
[ROW][C]33[/C][C]-0.125522[/C][C]-0.8605[/C][C]0.196932[/C][/ROW]
[ROW][C]34[/C][C]0.099562[/C][C]0.6826[/C][C]0.249117[/C][/ROW]
[ROW][C]35[/C][C]-0.070948[/C][C]-0.4864[/C][C]0.314474[/C][/ROW]
[ROW][C]36[/C][C]-0.094318[/C][C]-0.6466[/C][C]0.260515[/C][/ROW]
[/TABLE]
Source: https://freestatistics.org/blog/index.php?pk=25985&T=2

Globally Unique Identifier (entire table): ba.freestatistics.org/blog/index.php?pk=25985&T=2

As an alternative you can also use a QR Code:  

The GUIDs for individual cells are displayed in the table below:

Partial Autocorrelation Function
Time lag kPACF(k)T-STATP-value
1-0.567323-3.88940.000157
2-0.573776-3.93360.000137
3-0.21578-1.47930.072865
4-0.060936-0.41780.339014
5-0.206328-1.41450.081901
60.0690240.47320.319128
7-0.111708-0.76580.223803
8-0.152223-1.04360.151008
9-0.067053-0.45970.323929
100.1381370.9470.174236
11-0.018516-0.12690.449765
12-0.10146-0.69560.245059
13-0.100589-0.68960.246917
14-0.147913-1.0140.157878
150.1005630.68940.246973
16-0.071112-0.48750.314078
17-0.097292-0.6670.254018
18-0.106588-0.73070.234286
19-0.079386-0.54420.294425
200.083540.57270.284782
210.0718840.49280.312221
22-0.233055-1.59770.058401
230.2041381.39950.084115
24-0.065095-0.44630.328726
25-0.103697-0.71090.240326
26-0.089092-0.61080.272143
270.0777980.53340.29815
28-0.023781-0.1630.435596
29-0.077078-0.52840.299846
300.0109520.07510.470233
31-0.097483-0.66830.253603
32-0.16673-1.1430.129405
33-0.125522-0.86050.196932
340.0995620.68260.249117
35-0.070948-0.48640.314474
36-0.094318-0.64660.260515


Parameters (Session):
par1 = 36 ; par2 = 1 ; par3 = 1 ; par4 = 1 ; par5 = 12 ;
Parameters (R input):
par1 = 36 ; par2 = 1 ; par3 = 1 ; par4 = 1 ; par5 = 12 ;
R code (references can be found in the software module):
if (par1 == 'Default') {
par1 = 10*log10(length(x))
} else {
par1 <- as.numeric(par1)
}
par2 <- as.numeric(par2)
par3 <- as.numeric(par3)
par4 <- as.numeric(par4)
par5 <- as.numeric(par5)
if (par2 == 0) {
x <- log(x)
} else {
x <- (x ^ par2 - 1) / par2
}
if (par3 > 0) x <- diff(x,lag=1,difference=par3)
if (par4 > 0) x <- diff(x,lag=par5,difference=par4)
bitmap(file='pic1.png')
racf <- acf(x,par1,main='Autocorrelation',xlab='lags',ylab='ACF')
dev.off()
bitmap(file='pic2.png')
rpacf <- pacf(x,par1,main='Partial Autocorrelation',xlab='lags',ylab='PACF')
dev.off()
(myacf <- c(racf$acf))
(mypacf <- c(rpacf$acf))
lengthx <- length(x)
sqrtn <- sqrt(lengthx)
load(file='createtable')
a<-table.start()
a<-table.row.start(a)
a<-table.element(a,'Autocorrelation Function',4,TRUE)
a<-table.row.end(a)
a<-table.row.start(a)
a<-table.element(a,'Time lag k',header=TRUE)
a<-table.element(a,hyperlink('basics.htm','ACF(k)','click here for more information about the Autocorrelation Function'),header=TRUE)
a<-table.element(a,'T-STAT',header=TRUE)
a<-table.element(a,'P-value',header=TRUE)
a<-table.row.end(a)
for (i in 2:(par1+1)) {
a<-table.row.start(a)
a<-table.element(a,i-1,header=TRUE)
a<-table.element(a,round(myacf[i],6))
mytstat <- myacf[i]*sqrtn
a<-table.element(a,round(mytstat,4))
a<-table.element(a,round(1-pt(abs(mytstat),lengthx),6))
a<-table.row.end(a)
}
a<-table.end(a)
table.save(a,file='mytable.tab')
a<-table.start()
a<-table.row.start(a)
a<-table.element(a,'Partial Autocorrelation Function',4,TRUE)
a<-table.row.end(a)
a<-table.row.start(a)
a<-table.element(a,'Time lag k',header=TRUE)
a<-table.element(a,hyperlink('basics.htm','PACF(k)','click here for more information about the Partial Autocorrelation Function'),header=TRUE)
a<-table.element(a,'T-STAT',header=TRUE)
a<-table.element(a,'P-value',header=TRUE)
a<-table.row.end(a)
for (i in 1:par1) {
a<-table.row.start(a)
a<-table.element(a,i,header=TRUE)
a<-table.element(a,round(mypacf[i],6))
mytstat <- mypacf[i]*sqrtn
a<-table.element(a,round(mytstat,4))
a<-table.element(a,round(1-pt(abs(mytstat),lengthx),6))
a<-table.row.end(a)
}
a<-table.end(a)
table.save(a,file='mytable1.tab')