Free Statistics

of Irreproducible Research!

Author's title

Author*Unverified author*
R Software Modulerwasp_multipleregression.wasp
Title produced by softwareMultiple Regression
Date of computationThu, 27 Nov 2008 11:58:16 -0700
Cite this page as followsStatistical Computations at FreeStatistics.org, Office for Research Development and Education, URL https://freestatistics.org/blog/index.php?v=date/2008/Nov/27/t12278123956xtg7kre9evp0jz.htm/, Retrieved Sun, 19 May 2024 10:41:57 +0000
Statistical Computations at FreeStatistics.org, Office for Research Development and Education, URL https://freestatistics.org/blog/index.php?pk=25879, Retrieved Sun, 19 May 2024 10:41:57 +0000
QR Codes:

Original text written by user:
IsPrivate?No (this computation is public)
User-defined keywords
Estimated Impact125
Family? (F = Feedback message, R = changed R code, M = changed R Module, P = changed Parameters, D = changed Data)
F     [Multiple Regression] [] [2007-11-19 19:55:31] [b731da8b544846036771bbf9bf2f34ce]
F R PD    [Multiple Regression] [] [2008-11-27 18:58:16] [8fe13e00c5696af38d958e9734b9d18e] [Current]
Feedback Forum
2008-11-30 13:55:09 [Britt Severijns] [reply
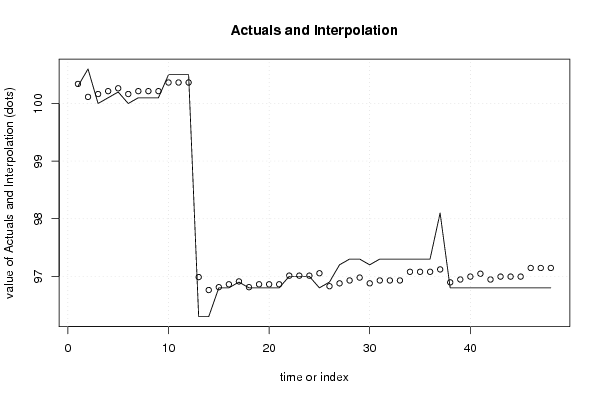
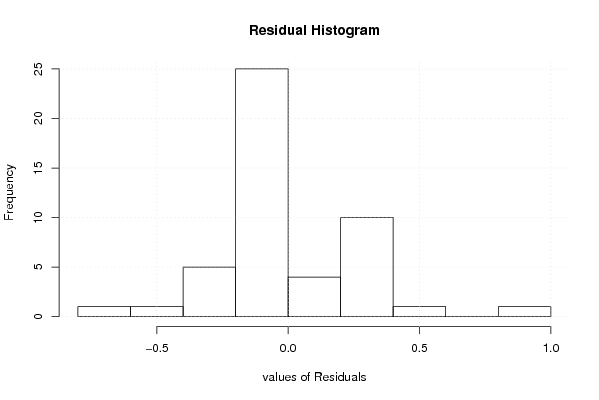
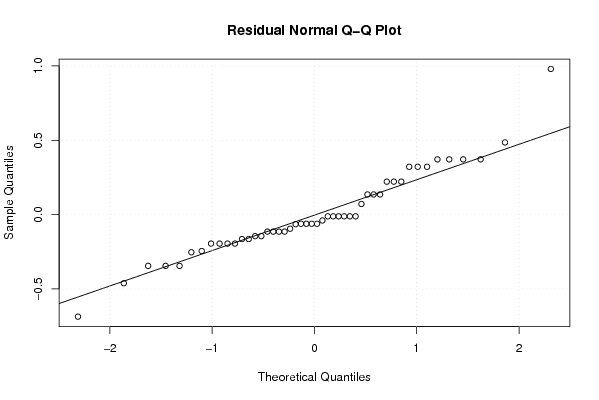
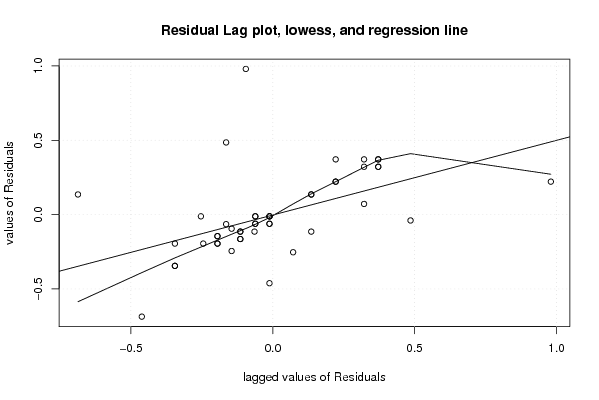
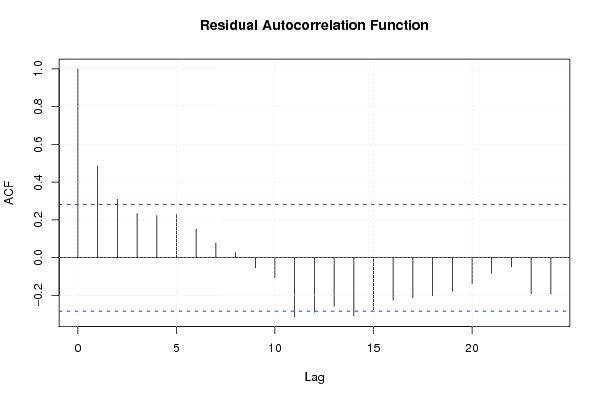
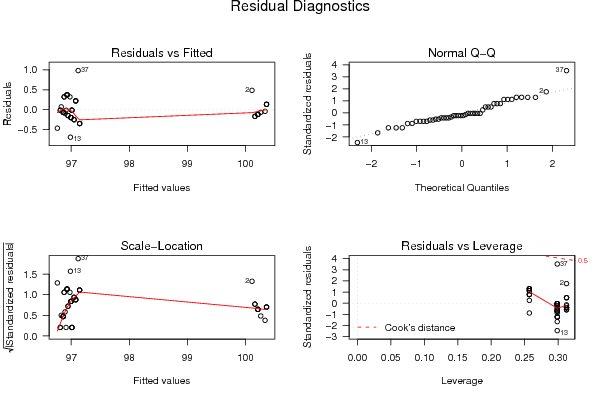
De p-values zijn groter dan 5 % waardoor dit alles aan toeval te wijten is. Zoals de student heeft opgemerkt ziet men inderdaad ineens een daling in de afzetprijs. De residuals liggen inderdaad dikwijls bij 0 maar ze moeten ook constant zijn wat hier niet het geval is. Er is dus niet voldaan aan de assumptie voor een goed model. Als men het residual histogram en de residual density plot bekijkt is er helemaal geen normaalverdeling te zien. Volgens de student wel. Men kan dus besluiten dat het model niet zo goed is.
2008-12-01 16:06:05 [An Knapen] [reply
2008-12-01 16:18:07 [An Knapen] [reply
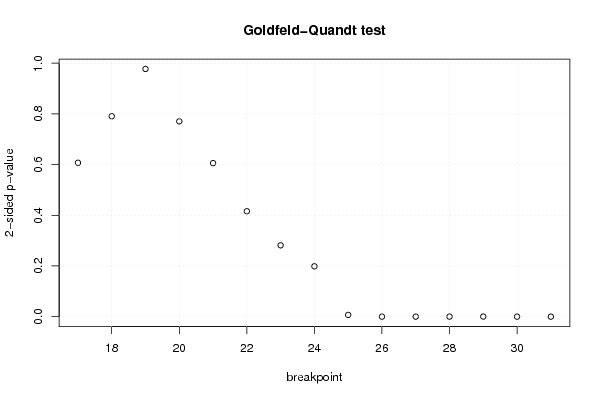
De student heeft nauwkeurig vermeld welke datareeks er werd gebruikt en wanneer de dummievariabele ingevoerd werd. Vervolgens is er gekeken naar de p-waarde, die boven de waarde 0,05 gelegen is. Dit betekent dat er geen significant verschil is. Wanneer we kijken naar de R kwadraat, dan kunnen we vaststellen dat deze inderdaad wel zeer hoog is. 95% van de schommeling kunnen worden verklaard, wat dus echt zeer veel is. Wanneer we de grafiek van de residu's bekijken,kunnen we inderdaad vaststellen dat de residu's dichtbij nul gelegen zijn. Bijgevolg is de voorspellingsfout dus zeer klein. Ook dit besluit had de student vermeld. Verder kunnen we ook vaststellen dat de gegevens toch niet echt normaal verdeeld zijn. Er zijn te veel afwijkingen vast te stellen.

Post a new message
Dataseries X:
100.30	0
100.60	0
100.00	0
100.10	0
100.20	0
100.00	0
100.10	0
100.10	0
100.10	0
100.50	0
100.50	0
100.50	0
96.30	1
96.30	1
96.80	1
96.80	1
96.90	1
96.80	1
96.80	1
96.80	1
96.80	1
97.00	1
97.00	1
97.00	1
96.80	1
96.90	1
97.20	1
97.30	1
97.30	1
97.20	1
97.30	1
97.30	1
97.30	1
97.30	1
97.30	1
97.30	1
98.10	1
96.80	1
96.80	1
96.80	1
96.80	1
96.80	1
96.80	1
96.80	1
96.80	1
96.80	1
96.80	1
96.80	1


Summary of computational transaction
Raw Inputview raw input (R code)
Raw Outputview raw output of R engine
Computing time6 seconds
R Server'Herman Ole Andreas Wold' @ 193.190.124.10:1001

\begin{tabular}{lllllllll}
\hline
Summary of computational transaction \tabularnewline
Raw Input & view raw input (R code)  \tabularnewline
Raw Output & view raw output of R engine  \tabularnewline
Computing time & 6 seconds \tabularnewline
R Server & 'Herman Ole Andreas Wold' @ 193.190.124.10:1001 \tabularnewline
\hline
\end{tabular}
%Source: https://freestatistics.org/blog/index.php?pk=25879&T=0

[TABLE]
[ROW][C]Summary of computational transaction[/C][/ROW]
[ROW][C]Raw Input[/C][C]view raw input (R code) [/C][/ROW]
[ROW][C]Raw Output[/C][C]view raw output of R engine [/C][/ROW]
[ROW][C]Computing time[/C][C]6 seconds[/C][/ROW]
[ROW][C]R Server[/C][C]'Herman Ole Andreas Wold' @ 193.190.124.10:1001[/C][/ROW]
[/TABLE]
Source: https://freestatistics.org/blog/index.php?pk=25879&T=0

Globally Unique Identifier (entire table): ba.freestatistics.org/blog/index.php?pk=25879&T=0

As an alternative you can also use a QR Code:  

The GUIDs for individual cells are displayed in the table below:

Summary of computational transaction
Raw Inputview raw input (R code)
Raw Outputview raw output of R engine
Computing time6 seconds
R Server'Herman Ole Andreas Wold' @ 193.190.124.10:1001


Multiple Linear Regression - Estimated Regression Equation
x[t] = + 100.297916666667 -3.41944444444446d[t] + 0.0361111111111511M1[t] -0.194444444444445M2[t] -0.15M3[t] -0.105555555555558M4[t] -0.0611111111111095M5[t] -0.166666666666666M6[t] -0.122222222222225M7[t] -0.127777777777780M8[t] -0.133333333333336M9[t] + 0.0111111111111109M10[t] + 0.00555555555555547M11[t] + 0.00555555555555548t + e[t]

\begin{tabular}{lllllllll}
\hline
Multiple Linear Regression - Estimated Regression Equation \tabularnewline
x[t] =  +  100.297916666667 -3.41944444444446d[t] +  0.0361111111111511M1[t] -0.194444444444445M2[t] -0.15M3[t] -0.105555555555558M4[t] -0.0611111111111095M5[t] -0.166666666666666M6[t] -0.122222222222225M7[t] -0.127777777777780M8[t] -0.133333333333336M9[t] +  0.0111111111111109M10[t] +  0.00555555555555547M11[t] +  0.00555555555555548t  + e[t] \tabularnewline
\hline
\end{tabular}
%Source: https://freestatistics.org/blog/index.php?pk=25879&T=1

[TABLE]
[ROW][C]Multiple Linear Regression - Estimated Regression Equation[/C][/ROW]
[ROW][C]x[t] =  +  100.297916666667 -3.41944444444446d[t] +  0.0361111111111511M1[t] -0.194444444444445M2[t] -0.15M3[t] -0.105555555555558M4[t] -0.0611111111111095M5[t] -0.166666666666666M6[t] -0.122222222222225M7[t] -0.127777777777780M8[t] -0.133333333333336M9[t] +  0.0111111111111109M10[t] +  0.00555555555555547M11[t] +  0.00555555555555548t  + e[t][/C][/ROW]
[/TABLE]
Source: https://freestatistics.org/blog/index.php?pk=25879&T=1

Globally Unique Identifier (entire table): ba.freestatistics.org/blog/index.php?pk=25879&T=1

As an alternative you can also use a QR Code:  

The GUIDs for individual cells are displayed in the table below:

Multiple Linear Regression - Estimated Regression Equation
x[t] = + 100.297916666667 -3.41944444444446d[t] + 0.0361111111111511M1[t] -0.194444444444445M2[t] -0.15M3[t] -0.105555555555558M4[t] -0.0611111111111095M5[t] -0.166666666666666M6[t] -0.122222222222225M7[t] -0.127777777777780M8[t] -0.133333333333336M9[t] + 0.0111111111111109M10[t] + 0.00555555555555547M11[t] + 0.00555555555555548t + e[t]


Multiple Linear Regression - Ordinary Least Squares
VariableParameterS.D.T-STATH0: parameter = 02-tail p-value1-tail p-value
(Intercept)100.2979166666670.198013506.520600
d-3.419444444444460.175364-19.499200
M10.03611111111115110.2433730.14840.8829210.441461
M2-0.1944444444444450.241987-0.80350.4272490.213625
M3-0.150.240726-0.62310.5373670.268683
M4-0.1055555555555580.239592-0.44060.6623180.331159
M5-0.06111111111110950.238588-0.25610.7993880.399694
M6-0.1666666666666660.237713-0.70110.4879960.243998
M7-0.1222222222222250.236971-0.51580.6093540.304677
M8-0.1277777777777800.236362-0.54060.5923060.296153
M9-0.1333333333333360.235887-0.56520.575620.28781
M100.01111111111111090.2355470.04720.9626530.481326
M110.005555555555555470.2353430.02360.9813050.490652
t0.005555555555555480.005660.98160.3332430.166621

\begin{tabular}{lllllllll}
\hline
Multiple Linear Regression - Ordinary Least Squares \tabularnewline
Variable & Parameter & S.D. & T-STATH0: parameter = 0 & 2-tail p-value & 1-tail p-value \tabularnewline
(Intercept) & 100.297916666667 & 0.198013 & 506.5206 & 0 & 0 \tabularnewline
d & -3.41944444444446 & 0.175364 & -19.4992 & 0 & 0 \tabularnewline
M1 & 0.0361111111111511 & 0.243373 & 0.1484 & 0.882921 & 0.441461 \tabularnewline
M2 & -0.194444444444445 & 0.241987 & -0.8035 & 0.427249 & 0.213625 \tabularnewline
M3 & -0.15 & 0.240726 & -0.6231 & 0.537367 & 0.268683 \tabularnewline
M4 & -0.105555555555558 & 0.239592 & -0.4406 & 0.662318 & 0.331159 \tabularnewline
M5 & -0.0611111111111095 & 0.238588 & -0.2561 & 0.799388 & 0.399694 \tabularnewline
M6 & -0.166666666666666 & 0.237713 & -0.7011 & 0.487996 & 0.243998 \tabularnewline
M7 & -0.122222222222225 & 0.236971 & -0.5158 & 0.609354 & 0.304677 \tabularnewline
M8 & -0.127777777777780 & 0.236362 & -0.5406 & 0.592306 & 0.296153 \tabularnewline
M9 & -0.133333333333336 & 0.235887 & -0.5652 & 0.57562 & 0.28781 \tabularnewline
M10 & 0.0111111111111109 & 0.235547 & 0.0472 & 0.962653 & 0.481326 \tabularnewline
M11 & 0.00555555555555547 & 0.235343 & 0.0236 & 0.981305 & 0.490652 \tabularnewline
t & 0.00555555555555548 & 0.00566 & 0.9816 & 0.333243 & 0.166621 \tabularnewline
\hline
\end{tabular}
%Source: https://freestatistics.org/blog/index.php?pk=25879&T=2

[TABLE]
[ROW][C]Multiple Linear Regression - Ordinary Least Squares[/C][/ROW]
[ROW][C]Variable[/C][C]Parameter[/C][C]S.D.[/C][C]T-STATH0: parameter = 0[/C][C]2-tail p-value[/C][C]1-tail p-value[/C][/ROW]
[ROW][C](Intercept)[/C][C]100.297916666667[/C][C]0.198013[/C][C]506.5206[/C][C]0[/C][C]0[/C][/ROW]
[ROW][C]d[/C][C]-3.41944444444446[/C][C]0.175364[/C][C]-19.4992[/C][C]0[/C][C]0[/C][/ROW]
[ROW][C]M1[/C][C]0.0361111111111511[/C][C]0.243373[/C][C]0.1484[/C][C]0.882921[/C][C]0.441461[/C][/ROW]
[ROW][C]M2[/C][C]-0.194444444444445[/C][C]0.241987[/C][C]-0.8035[/C][C]0.427249[/C][C]0.213625[/C][/ROW]
[ROW][C]M3[/C][C]-0.15[/C][C]0.240726[/C][C]-0.6231[/C][C]0.537367[/C][C]0.268683[/C][/ROW]
[ROW][C]M4[/C][C]-0.105555555555558[/C][C]0.239592[/C][C]-0.4406[/C][C]0.662318[/C][C]0.331159[/C][/ROW]
[ROW][C]M5[/C][C]-0.0611111111111095[/C][C]0.238588[/C][C]-0.2561[/C][C]0.799388[/C][C]0.399694[/C][/ROW]
[ROW][C]M6[/C][C]-0.166666666666666[/C][C]0.237713[/C][C]-0.7011[/C][C]0.487996[/C][C]0.243998[/C][/ROW]
[ROW][C]M7[/C][C]-0.122222222222225[/C][C]0.236971[/C][C]-0.5158[/C][C]0.609354[/C][C]0.304677[/C][/ROW]
[ROW][C]M8[/C][C]-0.127777777777780[/C][C]0.236362[/C][C]-0.5406[/C][C]0.592306[/C][C]0.296153[/C][/ROW]
[ROW][C]M9[/C][C]-0.133333333333336[/C][C]0.235887[/C][C]-0.5652[/C][C]0.57562[/C][C]0.28781[/C][/ROW]
[ROW][C]M10[/C][C]0.0111111111111109[/C][C]0.235547[/C][C]0.0472[/C][C]0.962653[/C][C]0.481326[/C][/ROW]
[ROW][C]M11[/C][C]0.00555555555555547[/C][C]0.235343[/C][C]0.0236[/C][C]0.981305[/C][C]0.490652[/C][/ROW]
[ROW][C]t[/C][C]0.00555555555555548[/C][C]0.00566[/C][C]0.9816[/C][C]0.333243[/C][C]0.166621[/C][/ROW]
[/TABLE]
Source: https://freestatistics.org/blog/index.php?pk=25879&T=2

Globally Unique Identifier (entire table): ba.freestatistics.org/blog/index.php?pk=25879&T=2

As an alternative you can also use a QR Code:  

The GUIDs for individual cells are displayed in the table below:

Multiple Linear Regression - Ordinary Least Squares
VariableParameterS.D.T-STATH0: parameter = 02-tail p-value1-tail p-value
(Intercept)100.2979166666670.198013506.520600
d-3.419444444444460.175364-19.499200
M10.03611111111115110.2433730.14840.8829210.441461
M2-0.1944444444444450.241987-0.80350.4272490.213625
M3-0.150.240726-0.62310.5373670.268683
M4-0.1055555555555580.239592-0.44060.6623180.331159
M5-0.06111111111110950.238588-0.25610.7993880.399694
M6-0.1666666666666660.237713-0.70110.4879960.243998
M7-0.1222222222222250.236971-0.51580.6093540.304677
M8-0.1277777777777800.236362-0.54060.5923060.296153
M9-0.1333333333333360.235887-0.56520.575620.28781
M100.01111111111111090.2355470.04720.9626530.481326
M110.005555555555555470.2353430.02360.9813050.490652
t0.005555555555555480.005660.98160.3332430.166621


Multiple Linear Regression - Regression Statistics
Multiple R0.981263802119858
R-squared0.96287864935072
Adjusted R-squared0.948685191749525
F-TEST (value)67.8396114890038
F-TEST (DF numerator)13
F-TEST (DF denominator)34
p-value0
Multiple Linear Regression - Residual Statistics
Residual Standard Deviation0.332729232004140
Sum Squared Residuals3.76409722222221

\begin{tabular}{lllllllll}
\hline
Multiple Linear Regression - Regression Statistics \tabularnewline
Multiple R & 0.981263802119858 \tabularnewline
R-squared & 0.96287864935072 \tabularnewline
Adjusted R-squared & 0.948685191749525 \tabularnewline
F-TEST (value) & 67.8396114890038 \tabularnewline
F-TEST (DF numerator) & 13 \tabularnewline
F-TEST (DF denominator) & 34 \tabularnewline
p-value & 0 \tabularnewline
Multiple Linear Regression - Residual Statistics \tabularnewline
Residual Standard Deviation & 0.332729232004140 \tabularnewline
Sum Squared Residuals & 3.76409722222221 \tabularnewline
\hline
\end{tabular}
%Source: https://freestatistics.org/blog/index.php?pk=25879&T=3

[TABLE]
[ROW][C]Multiple Linear Regression - Regression Statistics[/C][/ROW]
[ROW][C]Multiple R[/C][C]0.981263802119858[/C][/ROW]
[ROW][C]R-squared[/C][C]0.96287864935072[/C][/ROW]
[ROW][C]Adjusted R-squared[/C][C]0.948685191749525[/C][/ROW]
[ROW][C]F-TEST (value)[/C][C]67.8396114890038[/C][/ROW]
[ROW][C]F-TEST (DF numerator)[/C][C]13[/C][/ROW]
[ROW][C]F-TEST (DF denominator)[/C][C]34[/C][/ROW]
[ROW][C]p-value[/C][C]0[/C][/ROW]
[ROW][C]Multiple Linear Regression - Residual Statistics[/C][/ROW]
[ROW][C]Residual Standard Deviation[/C][C]0.332729232004140[/C][/ROW]
[ROW][C]Sum Squared Residuals[/C][C]3.76409722222221[/C][/ROW]
[/TABLE]
Source: https://freestatistics.org/blog/index.php?pk=25879&T=3

Globally Unique Identifier (entire table): ba.freestatistics.org/blog/index.php?pk=25879&T=3

As an alternative you can also use a QR Code:  

The GUIDs for individual cells are displayed in the table below:

Multiple Linear Regression - Regression Statistics
Multiple R0.981263802119858
R-squared0.96287864935072
Adjusted R-squared0.948685191749525
F-TEST (value)67.8396114890038
F-TEST (DF numerator)13
F-TEST (DF denominator)34
p-value0
Multiple Linear Regression - Residual Statistics
Residual Standard Deviation0.332729232004140
Sum Squared Residuals3.76409722222221


Multiple Linear Regression - Actuals, Interpolation, and Residuals
Time or IndexActualsInterpolationForecastResidualsPrediction Error
1100.3100.339583333333-0.0395833333332142
2100.6100.1145833333330.485416666666652
3100100.164583333333-0.164583333333343
4100.1100.214583333333-0.114583333333346
5100.2100.264583333333-0.0645833333333415
6100100.164583333333-0.164583333333343
7100.1100.214583333333-0.114583333333346
8100.1100.214583333333-0.114583333333346
9100.1100.214583333333-0.114583333333346
10100.5100.3645833333330.135416666666658
11100.5100.3645833333330.135416666666658
12100.5100.3645833333330.135416666666658
1396.396.9868055555556-0.686805555555595
1496.396.7618055555556-0.461805555555554
1596.896.8118055555556-0.0118055555555551
1696.896.8618055555555-0.0618055555555523
1796.996.9118055555556-0.0118055555555480
1896.896.8118055555556-0.0118055555555551
1996.896.8618055555555-0.0618055555555523
2096.896.8618055555555-0.0618055555555523
2196.896.8618055555555-0.0618055555555523
229797.0118055555556-0.0118055555555516
239797.0118055555556-0.0118055555555517
249797.0118055555556-0.0118055555555516
2596.897.0534722222223-0.253472222222261
2696.996.82847222222220.0715277777777883
2797.296.87847222222220.321527777777785
2897.396.92847222222220.371527777777782
2997.396.97847222222220.321527777777778
3097.296.87847222222220.321527777777785
3197.396.92847222222220.371527777777782
3297.396.92847222222220.371527777777782
3397.396.92847222222220.371527777777782
3497.397.07847222222220.22152777777778
3597.397.07847222222220.22152777777778
3697.397.07847222222220.22152777777778
3798.197.1201388888890.97986111111107
3896.896.8951388888889-0.095138888888886
3996.896.9451388888889-0.145138888888887
4096.896.9951388888889-0.195138888888884
4196.897.0451388888889-0.245138888888888
4296.896.9451388888889-0.145138888888887
4396.896.9951388888889-0.195138888888884
4496.896.9951388888889-0.195138888888884
4596.896.9951388888889-0.195138888888884
4696.897.1451388888889-0.345138888888886
4796.897.1451388888889-0.345138888888886
4896.897.1451388888889-0.345138888888886

\begin{tabular}{lllllllll}
\hline
Multiple Linear Regression - Actuals, Interpolation, and Residuals \tabularnewline
Time or Index & Actuals & InterpolationForecast & ResidualsPrediction Error \tabularnewline
1 & 100.3 & 100.339583333333 & -0.0395833333332142 \tabularnewline
2 & 100.6 & 100.114583333333 & 0.485416666666652 \tabularnewline
3 & 100 & 100.164583333333 & -0.164583333333343 \tabularnewline
4 & 100.1 & 100.214583333333 & -0.114583333333346 \tabularnewline
5 & 100.2 & 100.264583333333 & -0.0645833333333415 \tabularnewline
6 & 100 & 100.164583333333 & -0.164583333333343 \tabularnewline
7 & 100.1 & 100.214583333333 & -0.114583333333346 \tabularnewline
8 & 100.1 & 100.214583333333 & -0.114583333333346 \tabularnewline
9 & 100.1 & 100.214583333333 & -0.114583333333346 \tabularnewline
10 & 100.5 & 100.364583333333 & 0.135416666666658 \tabularnewline
11 & 100.5 & 100.364583333333 & 0.135416666666658 \tabularnewline
12 & 100.5 & 100.364583333333 & 0.135416666666658 \tabularnewline
13 & 96.3 & 96.9868055555556 & -0.686805555555595 \tabularnewline
14 & 96.3 & 96.7618055555556 & -0.461805555555554 \tabularnewline
15 & 96.8 & 96.8118055555556 & -0.0118055555555551 \tabularnewline
16 & 96.8 & 96.8618055555555 & -0.0618055555555523 \tabularnewline
17 & 96.9 & 96.9118055555556 & -0.0118055555555480 \tabularnewline
18 & 96.8 & 96.8118055555556 & -0.0118055555555551 \tabularnewline
19 & 96.8 & 96.8618055555555 & -0.0618055555555523 \tabularnewline
20 & 96.8 & 96.8618055555555 & -0.0618055555555523 \tabularnewline
21 & 96.8 & 96.8618055555555 & -0.0618055555555523 \tabularnewline
22 & 97 & 97.0118055555556 & -0.0118055555555516 \tabularnewline
23 & 97 & 97.0118055555556 & -0.0118055555555517 \tabularnewline
24 & 97 & 97.0118055555556 & -0.0118055555555516 \tabularnewline
25 & 96.8 & 97.0534722222223 & -0.253472222222261 \tabularnewline
26 & 96.9 & 96.8284722222222 & 0.0715277777777883 \tabularnewline
27 & 97.2 & 96.8784722222222 & 0.321527777777785 \tabularnewline
28 & 97.3 & 96.9284722222222 & 0.371527777777782 \tabularnewline
29 & 97.3 & 96.9784722222222 & 0.321527777777778 \tabularnewline
30 & 97.2 & 96.8784722222222 & 0.321527777777785 \tabularnewline
31 & 97.3 & 96.9284722222222 & 0.371527777777782 \tabularnewline
32 & 97.3 & 96.9284722222222 & 0.371527777777782 \tabularnewline
33 & 97.3 & 96.9284722222222 & 0.371527777777782 \tabularnewline
34 & 97.3 & 97.0784722222222 & 0.22152777777778 \tabularnewline
35 & 97.3 & 97.0784722222222 & 0.22152777777778 \tabularnewline
36 & 97.3 & 97.0784722222222 & 0.22152777777778 \tabularnewline
37 & 98.1 & 97.120138888889 & 0.97986111111107 \tabularnewline
38 & 96.8 & 96.8951388888889 & -0.095138888888886 \tabularnewline
39 & 96.8 & 96.9451388888889 & -0.145138888888887 \tabularnewline
40 & 96.8 & 96.9951388888889 & -0.195138888888884 \tabularnewline
41 & 96.8 & 97.0451388888889 & -0.245138888888888 \tabularnewline
42 & 96.8 & 96.9451388888889 & -0.145138888888887 \tabularnewline
43 & 96.8 & 96.9951388888889 & -0.195138888888884 \tabularnewline
44 & 96.8 & 96.9951388888889 & -0.195138888888884 \tabularnewline
45 & 96.8 & 96.9951388888889 & -0.195138888888884 \tabularnewline
46 & 96.8 & 97.1451388888889 & -0.345138888888886 \tabularnewline
47 & 96.8 & 97.1451388888889 & -0.345138888888886 \tabularnewline
48 & 96.8 & 97.1451388888889 & -0.345138888888886 \tabularnewline
\hline
\end{tabular}
%Source: https://freestatistics.org/blog/index.php?pk=25879&T=4

[TABLE]
[ROW][C]Multiple Linear Regression - Actuals, Interpolation, and Residuals[/C][/ROW]
[ROW][C]Time or Index[/C][C]Actuals[/C][C]InterpolationForecast[/C][C]ResidualsPrediction Error[/C][/ROW]
[ROW][C]1[/C][C]100.3[/C][C]100.339583333333[/C][C]-0.0395833333332142[/C][/ROW]
[ROW][C]2[/C][C]100.6[/C][C]100.114583333333[/C][C]0.485416666666652[/C][/ROW]
[ROW][C]3[/C][C]100[/C][C]100.164583333333[/C][C]-0.164583333333343[/C][/ROW]
[ROW][C]4[/C][C]100.1[/C][C]100.214583333333[/C][C]-0.114583333333346[/C][/ROW]
[ROW][C]5[/C][C]100.2[/C][C]100.264583333333[/C][C]-0.0645833333333415[/C][/ROW]
[ROW][C]6[/C][C]100[/C][C]100.164583333333[/C][C]-0.164583333333343[/C][/ROW]
[ROW][C]7[/C][C]100.1[/C][C]100.214583333333[/C][C]-0.114583333333346[/C][/ROW]
[ROW][C]8[/C][C]100.1[/C][C]100.214583333333[/C][C]-0.114583333333346[/C][/ROW]
[ROW][C]9[/C][C]100.1[/C][C]100.214583333333[/C][C]-0.114583333333346[/C][/ROW]
[ROW][C]10[/C][C]100.5[/C][C]100.364583333333[/C][C]0.135416666666658[/C][/ROW]
[ROW][C]11[/C][C]100.5[/C][C]100.364583333333[/C][C]0.135416666666658[/C][/ROW]
[ROW][C]12[/C][C]100.5[/C][C]100.364583333333[/C][C]0.135416666666658[/C][/ROW]
[ROW][C]13[/C][C]96.3[/C][C]96.9868055555556[/C][C]-0.686805555555595[/C][/ROW]
[ROW][C]14[/C][C]96.3[/C][C]96.7618055555556[/C][C]-0.461805555555554[/C][/ROW]
[ROW][C]15[/C][C]96.8[/C][C]96.8118055555556[/C][C]-0.0118055555555551[/C][/ROW]
[ROW][C]16[/C][C]96.8[/C][C]96.8618055555555[/C][C]-0.0618055555555523[/C][/ROW]
[ROW][C]17[/C][C]96.9[/C][C]96.9118055555556[/C][C]-0.0118055555555480[/C][/ROW]
[ROW][C]18[/C][C]96.8[/C][C]96.8118055555556[/C][C]-0.0118055555555551[/C][/ROW]
[ROW][C]19[/C][C]96.8[/C][C]96.8618055555555[/C][C]-0.0618055555555523[/C][/ROW]
[ROW][C]20[/C][C]96.8[/C][C]96.8618055555555[/C][C]-0.0618055555555523[/C][/ROW]
[ROW][C]21[/C][C]96.8[/C][C]96.8618055555555[/C][C]-0.0618055555555523[/C][/ROW]
[ROW][C]22[/C][C]97[/C][C]97.0118055555556[/C][C]-0.0118055555555516[/C][/ROW]
[ROW][C]23[/C][C]97[/C][C]97.0118055555556[/C][C]-0.0118055555555517[/C][/ROW]
[ROW][C]24[/C][C]97[/C][C]97.0118055555556[/C][C]-0.0118055555555516[/C][/ROW]
[ROW][C]25[/C][C]96.8[/C][C]97.0534722222223[/C][C]-0.253472222222261[/C][/ROW]
[ROW][C]26[/C][C]96.9[/C][C]96.8284722222222[/C][C]0.0715277777777883[/C][/ROW]
[ROW][C]27[/C][C]97.2[/C][C]96.8784722222222[/C][C]0.321527777777785[/C][/ROW]
[ROW][C]28[/C][C]97.3[/C][C]96.9284722222222[/C][C]0.371527777777782[/C][/ROW]
[ROW][C]29[/C][C]97.3[/C][C]96.9784722222222[/C][C]0.321527777777778[/C][/ROW]
[ROW][C]30[/C][C]97.2[/C][C]96.8784722222222[/C][C]0.321527777777785[/C][/ROW]
[ROW][C]31[/C][C]97.3[/C][C]96.9284722222222[/C][C]0.371527777777782[/C][/ROW]
[ROW][C]32[/C][C]97.3[/C][C]96.9284722222222[/C][C]0.371527777777782[/C][/ROW]
[ROW][C]33[/C][C]97.3[/C][C]96.9284722222222[/C][C]0.371527777777782[/C][/ROW]
[ROW][C]34[/C][C]97.3[/C][C]97.0784722222222[/C][C]0.22152777777778[/C][/ROW]
[ROW][C]35[/C][C]97.3[/C][C]97.0784722222222[/C][C]0.22152777777778[/C][/ROW]
[ROW][C]36[/C][C]97.3[/C][C]97.0784722222222[/C][C]0.22152777777778[/C][/ROW]
[ROW][C]37[/C][C]98.1[/C][C]97.120138888889[/C][C]0.97986111111107[/C][/ROW]
[ROW][C]38[/C][C]96.8[/C][C]96.8951388888889[/C][C]-0.095138888888886[/C][/ROW]
[ROW][C]39[/C][C]96.8[/C][C]96.9451388888889[/C][C]-0.145138888888887[/C][/ROW]
[ROW][C]40[/C][C]96.8[/C][C]96.9951388888889[/C][C]-0.195138888888884[/C][/ROW]
[ROW][C]41[/C][C]96.8[/C][C]97.0451388888889[/C][C]-0.245138888888888[/C][/ROW]
[ROW][C]42[/C][C]96.8[/C][C]96.9451388888889[/C][C]-0.145138888888887[/C][/ROW]
[ROW][C]43[/C][C]96.8[/C][C]96.9951388888889[/C][C]-0.195138888888884[/C][/ROW]
[ROW][C]44[/C][C]96.8[/C][C]96.9951388888889[/C][C]-0.195138888888884[/C][/ROW]
[ROW][C]45[/C][C]96.8[/C][C]96.9951388888889[/C][C]-0.195138888888884[/C][/ROW]
[ROW][C]46[/C][C]96.8[/C][C]97.1451388888889[/C][C]-0.345138888888886[/C][/ROW]
[ROW][C]47[/C][C]96.8[/C][C]97.1451388888889[/C][C]-0.345138888888886[/C][/ROW]
[ROW][C]48[/C][C]96.8[/C][C]97.1451388888889[/C][C]-0.345138888888886[/C][/ROW]
[/TABLE]
Source: https://freestatistics.org/blog/index.php?pk=25879&T=4

Globally Unique Identifier (entire table): ba.freestatistics.org/blog/index.php?pk=25879&T=4

As an alternative you can also use a QR Code:  

The GUIDs for individual cells are displayed in the table below:

Multiple Linear Regression - Actuals, Interpolation, and Residuals
Time or IndexActualsInterpolationForecastResidualsPrediction Error
1100.3100.339583333333-0.0395833333332142
2100.6100.1145833333330.485416666666652
3100100.164583333333-0.164583333333343
4100.1100.214583333333-0.114583333333346
5100.2100.264583333333-0.0645833333333415
6100100.164583333333-0.164583333333343
7100.1100.214583333333-0.114583333333346
8100.1100.214583333333-0.114583333333346
9100.1100.214583333333-0.114583333333346
10100.5100.3645833333330.135416666666658
11100.5100.3645833333330.135416666666658
12100.5100.3645833333330.135416666666658
1396.396.9868055555556-0.686805555555595
1496.396.7618055555556-0.461805555555554
1596.896.8118055555556-0.0118055555555551
1696.896.8618055555555-0.0618055555555523
1796.996.9118055555556-0.0118055555555480
1896.896.8118055555556-0.0118055555555551
1996.896.8618055555555-0.0618055555555523
2096.896.8618055555555-0.0618055555555523
2196.896.8618055555555-0.0618055555555523
229797.0118055555556-0.0118055555555516
239797.0118055555556-0.0118055555555517
249797.0118055555556-0.0118055555555516
2596.897.0534722222223-0.253472222222261
2696.996.82847222222220.0715277777777883
2797.296.87847222222220.321527777777785
2897.396.92847222222220.371527777777782
2997.396.97847222222220.321527777777778
3097.296.87847222222220.321527777777785
3197.396.92847222222220.371527777777782
3297.396.92847222222220.371527777777782
3397.396.92847222222220.371527777777782
3497.397.07847222222220.22152777777778
3597.397.07847222222220.22152777777778
3697.397.07847222222220.22152777777778
3798.197.1201388888890.97986111111107
3896.896.8951388888889-0.095138888888886
3996.896.9451388888889-0.145138888888887
4096.896.9951388888889-0.195138888888884
4196.897.0451388888889-0.245138888888888
4296.896.9451388888889-0.145138888888887
4396.896.9951388888889-0.195138888888884
4496.896.9951388888889-0.195138888888884
4596.896.9951388888889-0.195138888888884
4696.897.1451388888889-0.345138888888886
4796.897.1451388888889-0.345138888888886
4896.897.1451388888889-0.345138888888886


Goldfeld-Quandt test for Heteroskedasticity
p-valuesAlternative Hypothesis
breakpoint indexgreater2-sidedless
170.6963408491913340.6073183016173320.303659150808666
180.6045579462633080.7908841074733840.395442053736692
190.4887308498487150.977461699697430.511269150151285
200.3852940808350930.7705881616701870.614705919164907
210.3029585813204060.6059171626408120.697041418679594
220.2080074420396710.4160148840793420.791992557960329
230.1407296317556510.2814592635113030.859270368244349
240.09931967838243670.1986393567648730.900680321617563
250.9965813641620820.006837271675836260.00341863583791813
260.9999970759705445.8480589121988e-062.9240294560994e-06
270.999997663137584.67372483799206e-062.33686241899603e-06
280.9999815841500463.68316999080638e-051.84158499540319e-05
290.9998470615097980.0003058769804030750.000152938490201538
3015.26779043697933e-532.63389521848966e-53
3112.42326766016825e-411.21163383008413e-41

\begin{tabular}{lllllllll}
\hline
Goldfeld-Quandt test for Heteroskedasticity \tabularnewline
p-values & Alternative Hypothesis \tabularnewline
breakpoint index & greater & 2-sided & less \tabularnewline
17 & 0.696340849191334 & 0.607318301617332 & 0.303659150808666 \tabularnewline
18 & 0.604557946263308 & 0.790884107473384 & 0.395442053736692 \tabularnewline
19 & 0.488730849848715 & 0.97746169969743 & 0.511269150151285 \tabularnewline
20 & 0.385294080835093 & 0.770588161670187 & 0.614705919164907 \tabularnewline
21 & 0.302958581320406 & 0.605917162640812 & 0.697041418679594 \tabularnewline
22 & 0.208007442039671 & 0.416014884079342 & 0.791992557960329 \tabularnewline
23 & 0.140729631755651 & 0.281459263511303 & 0.859270368244349 \tabularnewline
24 & 0.0993196783824367 & 0.198639356764873 & 0.900680321617563 \tabularnewline
25 & 0.996581364162082 & 0.00683727167583626 & 0.00341863583791813 \tabularnewline
26 & 0.999997075970544 & 5.8480589121988e-06 & 2.9240294560994e-06 \tabularnewline
27 & 0.99999766313758 & 4.67372483799206e-06 & 2.33686241899603e-06 \tabularnewline
28 & 0.999981584150046 & 3.68316999080638e-05 & 1.84158499540319e-05 \tabularnewline
29 & 0.999847061509798 & 0.000305876980403075 & 0.000152938490201538 \tabularnewline
30 & 1 & 5.26779043697933e-53 & 2.63389521848966e-53 \tabularnewline
31 & 1 & 2.42326766016825e-41 & 1.21163383008413e-41 \tabularnewline
\hline
\end{tabular}
%Source: https://freestatistics.org/blog/index.php?pk=25879&T=5

[TABLE]
[ROW][C]Goldfeld-Quandt test for Heteroskedasticity[/C][/ROW]
[ROW][C]p-values[/C][C]Alternative Hypothesis[/C][/ROW]
[ROW][C]breakpoint index[/C][C]greater[/C][C]2-sided[/C][C]less[/C][/ROW]
[ROW][C]17[/C][C]0.696340849191334[/C][C]0.607318301617332[/C][C]0.303659150808666[/C][/ROW]
[ROW][C]18[/C][C]0.604557946263308[/C][C]0.790884107473384[/C][C]0.395442053736692[/C][/ROW]
[ROW][C]19[/C][C]0.488730849848715[/C][C]0.97746169969743[/C][C]0.511269150151285[/C][/ROW]
[ROW][C]20[/C][C]0.385294080835093[/C][C]0.770588161670187[/C][C]0.614705919164907[/C][/ROW]
[ROW][C]21[/C][C]0.302958581320406[/C][C]0.605917162640812[/C][C]0.697041418679594[/C][/ROW]
[ROW][C]22[/C][C]0.208007442039671[/C][C]0.416014884079342[/C][C]0.791992557960329[/C][/ROW]
[ROW][C]23[/C][C]0.140729631755651[/C][C]0.281459263511303[/C][C]0.859270368244349[/C][/ROW]
[ROW][C]24[/C][C]0.0993196783824367[/C][C]0.198639356764873[/C][C]0.900680321617563[/C][/ROW]
[ROW][C]25[/C][C]0.996581364162082[/C][C]0.00683727167583626[/C][C]0.00341863583791813[/C][/ROW]
[ROW][C]26[/C][C]0.999997075970544[/C][C]5.8480589121988e-06[/C][C]2.9240294560994e-06[/C][/ROW]
[ROW][C]27[/C][C]0.99999766313758[/C][C]4.67372483799206e-06[/C][C]2.33686241899603e-06[/C][/ROW]
[ROW][C]28[/C][C]0.999981584150046[/C][C]3.68316999080638e-05[/C][C]1.84158499540319e-05[/C][/ROW]
[ROW][C]29[/C][C]0.999847061509798[/C][C]0.000305876980403075[/C][C]0.000152938490201538[/C][/ROW]
[ROW][C]30[/C][C]1[/C][C]5.26779043697933e-53[/C][C]2.63389521848966e-53[/C][/ROW]
[ROW][C]31[/C][C]1[/C][C]2.42326766016825e-41[/C][C]1.21163383008413e-41[/C][/ROW]
[/TABLE]
Source: https://freestatistics.org/blog/index.php?pk=25879&T=5

Globally Unique Identifier (entire table): ba.freestatistics.org/blog/index.php?pk=25879&T=5

As an alternative you can also use a QR Code:  

The GUIDs for individual cells are displayed in the table below:

Goldfeld-Quandt test for Heteroskedasticity
p-valuesAlternative Hypothesis
breakpoint indexgreater2-sidedless
170.6963408491913340.6073183016173320.303659150808666
180.6045579462633080.7908841074733840.395442053736692
190.4887308498487150.977461699697430.511269150151285
200.3852940808350930.7705881616701870.614705919164907
210.3029585813204060.6059171626408120.697041418679594
220.2080074420396710.4160148840793420.791992557960329
230.1407296317556510.2814592635113030.859270368244349
240.09931967838243670.1986393567648730.900680321617563
250.9965813641620820.006837271675836260.00341863583791813
260.9999970759705445.8480589121988e-062.9240294560994e-06
270.999997663137584.67372483799206e-062.33686241899603e-06
280.9999815841500463.68316999080638e-051.84158499540319e-05
290.9998470615097980.0003058769804030750.000152938490201538
3015.26779043697933e-532.63389521848966e-53
3112.42326766016825e-411.21163383008413e-41


Meta Analysis of Goldfeld-Quandt test for Heteroskedasticity
Description# significant tests% significant testsOK/NOK
1% type I error level70.466666666666667NOK
5% type I error level70.466666666666667NOK
10% type I error level70.466666666666667NOK

\begin{tabular}{lllllllll}
\hline
Meta Analysis of Goldfeld-Quandt test for Heteroskedasticity \tabularnewline
Description & # significant tests & % significant tests & OK/NOK \tabularnewline
1% type I error level & 7 & 0.466666666666667 & NOK \tabularnewline
5% type I error level & 7 & 0.466666666666667 & NOK \tabularnewline
10% type I error level & 7 & 0.466666666666667 & NOK \tabularnewline
\hline
\end{tabular}
%Source: https://freestatistics.org/blog/index.php?pk=25879&T=6

[TABLE]
[ROW][C]Meta Analysis of Goldfeld-Quandt test for Heteroskedasticity[/C][/ROW]
[ROW][C]Description[/C][C]# significant tests[/C][C]% significant tests[/C][C]OK/NOK[/C][/ROW]
[ROW][C]1% type I error level[/C][C]7[/C][C]0.466666666666667[/C][C]NOK[/C][/ROW]
[ROW][C]5% type I error level[/C][C]7[/C][C]0.466666666666667[/C][C]NOK[/C][/ROW]
[ROW][C]10% type I error level[/C][C]7[/C][C]0.466666666666667[/C][C]NOK[/C][/ROW]
[/TABLE]
Source: https://freestatistics.org/blog/index.php?pk=25879&T=6

Globally Unique Identifier (entire table): ba.freestatistics.org/blog/index.php?pk=25879&T=6

As an alternative you can also use a QR Code:  

The GUIDs for individual cells are displayed in the table below:

Meta Analysis of Goldfeld-Quandt test for Heteroskedasticity
Description# significant tests% significant testsOK/NOK
1% type I error level70.466666666666667NOK
5% type I error level70.466666666666667NOK
10% type I error level70.466666666666667NOK


Parameters (Session):
par1 = 1 ; par2 = Include Monthly Dummies ; par3 = Linear Trend ;
Parameters (R input):
par1 = 1 ; par2 = Include Monthly Dummies ; par3 = Linear Trend ;
R code (references can be found in the software module):
library(lattice)
library(lmtest)
n25 <- 25 #minimum number of obs. for Goldfeld-Quandt test
par1 <- as.numeric(par1)
x <- t(y)
k <- length(x[1,])
n <- length(x[,1])
x1 <- cbind(x[,par1], x[,1:k!=par1])
mycolnames <- c(colnames(x)[par1], colnames(x)[1:k!=par1])
colnames(x1) <- mycolnames #colnames(x)[par1]
x <- x1
if (par3 == 'First Differences'){
x2 <- array(0, dim=c(n-1,k), dimnames=list(1:(n-1), paste('(1-B)',colnames(x),sep='')))
for (i in 1:n-1) {
for (j in 1:k) {
x2[i,j] <- x[i+1,j] - x[i,j]
}
}
x <- x2
}
if (par2 == 'Include Monthly Dummies'){
x2 <- array(0, dim=c(n,11), dimnames=list(1:n, paste('M', seq(1:11), sep ='')))
for (i in 1:11){
x2[seq(i,n,12),i] <- 1
}
x <- cbind(x, x2)
}
if (par2 == 'Include Quarterly Dummies'){
x2 <- array(0, dim=c(n,3), dimnames=list(1:n, paste('Q', seq(1:3), sep ='')))
for (i in 1:3){
x2[seq(i,n,4),i] <- 1
}
x <- cbind(x, x2)
}
k <- length(x[1,])
if (par3 == 'Linear Trend'){
x <- cbind(x, c(1:n))
colnames(x)[k+1] <- 't'
}
x
k <- length(x[1,])
df <- as.data.frame(x)
(mylm <- lm(df))
(mysum <- summary(mylm))
if (n > n25) {
kp3 <- k + 3
nmkm3 <- n - k - 3
gqarr <- array(NA, dim=c(nmkm3-kp3+1,3))
numgqtests <- 0
numsignificant1 <- 0
numsignificant5 <- 0
numsignificant10 <- 0
for (mypoint in kp3:nmkm3) {
j <- 0
numgqtests <- numgqtests + 1
for (myalt in c('greater', 'two.sided', 'less')) {
j <- j + 1
gqarr[mypoint-kp3+1,j] <- gqtest(mylm, point=mypoint, alternative=myalt)$p.value
}
if (gqarr[mypoint-kp3+1,2] < 0.01) numsignificant1 <- numsignificant1 + 1
if (gqarr[mypoint-kp3+1,2] < 0.05) numsignificant5 <- numsignificant5 + 1
if (gqarr[mypoint-kp3+1,2] < 0.10) numsignificant10 <- numsignificant10 + 1
}
gqarr
}
bitmap(file='test0.png')
plot(x[,1], type='l', main='Actuals and Interpolation', ylab='value of Actuals and Interpolation (dots)', xlab='time or index')
points(x[,1]-mysum$resid)
grid()
dev.off()
bitmap(file='test1.png')
plot(mysum$resid, type='b', pch=19, main='Residuals', ylab='value of Residuals', xlab='time or index')
grid()
dev.off()
bitmap(file='test2.png')
hist(mysum$resid, main='Residual Histogram', xlab='values of Residuals')
grid()
dev.off()
bitmap(file='test3.png')
densityplot(~mysum$resid,col='black',main='Residual Density Plot', xlab='values of Residuals')
dev.off()
bitmap(file='test4.png')
qqnorm(mysum$resid, main='Residual Normal Q-Q Plot')
qqline(mysum$resid)
grid()
dev.off()
(myerror <- as.ts(mysum$resid))
bitmap(file='test5.png')
dum <- cbind(lag(myerror,k=1),myerror)
dum
dum1 <- dum[2:length(myerror),]
dum1
z <- as.data.frame(dum1)
z
plot(z,main=paste('Residual Lag plot, lowess, and regression line'), ylab='values of Residuals', xlab='lagged values of Residuals')
lines(lowess(z))
abline(lm(z))
grid()
dev.off()
bitmap(file='test6.png')
acf(mysum$resid, lag.max=length(mysum$resid)/2, main='Residual Autocorrelation Function')
grid()
dev.off()
bitmap(file='test7.png')
pacf(mysum$resid, lag.max=length(mysum$resid)/2, main='Residual Partial Autocorrelation Function')
grid()
dev.off()
bitmap(file='test8.png')
opar <- par(mfrow = c(2,2), oma = c(0, 0, 1.1, 0))
plot(mylm, las = 1, sub='Residual Diagnostics')
par(opar)
dev.off()
if (n > n25) {
bitmap(file='test9.png')
plot(kp3:nmkm3,gqarr[,2], main='Goldfeld-Quandt test',ylab='2-sided p-value',xlab='breakpoint')
grid()
dev.off()
}
load(file='createtable')
a<-table.start()
a<-table.row.start(a)
a<-table.element(a, 'Multiple Linear Regression - Estimated Regression Equation', 1, TRUE)
a<-table.row.end(a)
myeq <- colnames(x)[1]
myeq <- paste(myeq, '[t] = ', sep='')
for (i in 1:k){
if (mysum$coefficients[i,1] > 0) myeq <- paste(myeq, '+', '')
myeq <- paste(myeq, mysum$coefficients[i,1], sep=' ')
if (rownames(mysum$coefficients)[i] != '(Intercept)') {
myeq <- paste(myeq, rownames(mysum$coefficients)[i], sep='')
if (rownames(mysum$coefficients)[i] != 't') myeq <- paste(myeq, '[t]', sep='')
}
}
myeq <- paste(myeq, ' + e[t]')
a<-table.row.start(a)
a<-table.element(a, myeq)
a<-table.row.end(a)
a<-table.end(a)
table.save(a,file='mytable1.tab')
a<-table.start()
a<-table.row.start(a)
a<-table.element(a,hyperlink('ols1.htm','Multiple Linear Regression - Ordinary Least Squares',''), 6, TRUE)
a<-table.row.end(a)
a<-table.row.start(a)
a<-table.element(a,'Variable',header=TRUE)
a<-table.element(a,'Parameter',header=TRUE)
a<-table.element(a,'S.D.',header=TRUE)
a<-table.element(a,'T-STAT
H0: parameter = 0',header=TRUE)
a<-table.element(a,'2-tail p-value',header=TRUE)
a<-table.element(a,'1-tail p-value',header=TRUE)
a<-table.row.end(a)
for (i in 1:k){
a<-table.row.start(a)
a<-table.element(a,rownames(mysum$coefficients)[i],header=TRUE)
a<-table.element(a,mysum$coefficients[i,1])
a<-table.element(a, round(mysum$coefficients[i,2],6))
a<-table.element(a, round(mysum$coefficients[i,3],4))
a<-table.element(a, round(mysum$coefficients[i,4],6))
a<-table.element(a, round(mysum$coefficients[i,4]/2,6))
a<-table.row.end(a)
}
a<-table.end(a)
table.save(a,file='mytable2.tab')
a<-table.start()
a<-table.row.start(a)
a<-table.element(a, 'Multiple Linear Regression - Regression Statistics', 2, TRUE)
a<-table.row.end(a)
a<-table.row.start(a)
a<-table.element(a, 'Multiple R',1,TRUE)
a<-table.element(a, sqrt(mysum$r.squared))
a<-table.row.end(a)
a<-table.row.start(a)
a<-table.element(a, 'R-squared',1,TRUE)
a<-table.element(a, mysum$r.squared)
a<-table.row.end(a)
a<-table.row.start(a)
a<-table.element(a, 'Adjusted R-squared',1,TRUE)
a<-table.element(a, mysum$adj.r.squared)
a<-table.row.end(a)
a<-table.row.start(a)
a<-table.element(a, 'F-TEST (value)',1,TRUE)
a<-table.element(a, mysum$fstatistic[1])
a<-table.row.end(a)
a<-table.row.start(a)
a<-table.element(a, 'F-TEST (DF numerator)',1,TRUE)
a<-table.element(a, mysum$fstatistic[2])
a<-table.row.end(a)
a<-table.row.start(a)
a<-table.element(a, 'F-TEST (DF denominator)',1,TRUE)
a<-table.element(a, mysum$fstatistic[3])
a<-table.row.end(a)
a<-table.row.start(a)
a<-table.element(a, 'p-value',1,TRUE)
a<-table.element(a, 1-pf(mysum$fstatistic[1],mysum$fstatistic[2],mysum$fstatistic[3]))
a<-table.row.end(a)
a<-table.row.start(a)
a<-table.element(a, 'Multiple Linear Regression - Residual Statistics', 2, TRUE)
a<-table.row.end(a)
a<-table.row.start(a)
a<-table.element(a, 'Residual Standard Deviation',1,TRUE)
a<-table.element(a, mysum$sigma)
a<-table.row.end(a)
a<-table.row.start(a)
a<-table.element(a, 'Sum Squared Residuals',1,TRUE)
a<-table.element(a, sum(myerror*myerror))
a<-table.row.end(a)
a<-table.end(a)
table.save(a,file='mytable3.tab')
a<-table.start()
a<-table.row.start(a)
a<-table.element(a, 'Multiple Linear Regression - Actuals, Interpolation, and Residuals', 4, TRUE)
a<-table.row.end(a)
a<-table.row.start(a)
a<-table.element(a, 'Time or Index', 1, TRUE)
a<-table.element(a, 'Actuals', 1, TRUE)
a<-table.element(a, 'Interpolation
Forecast', 1, TRUE)
a<-table.element(a, 'Residuals
Prediction Error', 1, TRUE)
a<-table.row.end(a)
for (i in 1:n) {
a<-table.row.start(a)
a<-table.element(a,i, 1, TRUE)
a<-table.element(a,x[i])
a<-table.element(a,x[i]-mysum$resid[i])
a<-table.element(a,mysum$resid[i])
a<-table.row.end(a)
}
a<-table.end(a)
table.save(a,file='mytable4.tab')
if (n > n25) {
a<-table.start()
a<-table.row.start(a)
a<-table.element(a,'Goldfeld-Quandt test for Heteroskedasticity',4,TRUE)
a<-table.row.end(a)
a<-table.row.start(a)
a<-table.element(a,'p-values',header=TRUE)
a<-table.element(a,'Alternative Hypothesis',3,header=TRUE)
a<-table.row.end(a)
a<-table.row.start(a)
a<-table.element(a,'breakpoint index',header=TRUE)
a<-table.element(a,'greater',header=TRUE)
a<-table.element(a,'2-sided',header=TRUE)
a<-table.element(a,'less',header=TRUE)
a<-table.row.end(a)
for (mypoint in kp3:nmkm3) {
a<-table.row.start(a)
a<-table.element(a,mypoint,header=TRUE)
a<-table.element(a,gqarr[mypoint-kp3+1,1])
a<-table.element(a,gqarr[mypoint-kp3+1,2])
a<-table.element(a,gqarr[mypoint-kp3+1,3])
a<-table.row.end(a)
}
a<-table.end(a)
table.save(a,file='mytable5.tab')
a<-table.start()
a<-table.row.start(a)
a<-table.element(a,'Meta Analysis of Goldfeld-Quandt test for Heteroskedasticity',4,TRUE)
a<-table.row.end(a)
a<-table.row.start(a)
a<-table.element(a,'Description',header=TRUE)
a<-table.element(a,'# significant tests',header=TRUE)
a<-table.element(a,'% significant tests',header=TRUE)
a<-table.element(a,'OK/NOK',header=TRUE)
a<-table.row.end(a)
a<-table.row.start(a)
a<-table.element(a,'1% type I error level',header=TRUE)
a<-table.element(a,numsignificant1)
a<-table.element(a,numsignificant1/numgqtests)
if (numsignificant1/numgqtests < 0.01) dum <- 'OK' else dum <- 'NOK'
a<-table.element(a,dum)
a<-table.row.end(a)
a<-table.row.start(a)
a<-table.element(a,'5% type I error level',header=TRUE)
a<-table.element(a,numsignificant5)
a<-table.element(a,numsignificant5/numgqtests)
if (numsignificant5/numgqtests < 0.05) dum <- 'OK' else dum <- 'NOK'
a<-table.element(a,dum)
a<-table.row.end(a)
a<-table.row.start(a)
a<-table.element(a,'10% type I error level',header=TRUE)
a<-table.element(a,numsignificant10)
a<-table.element(a,numsignificant10/numgqtests)
if (numsignificant10/numgqtests < 0.1) dum <- 'OK' else dum <- 'NOK'
a<-table.element(a,dum)
a<-table.row.end(a)
a<-table.end(a)
table.save(a,file='mytable6.tab')
}