Free Statistics

of Irreproducible Research!

Author's title

Author*Unverified author*
R Software Modulerwasp_multipleregression.wasp
Title produced by softwareMultiple Regression
Date of computationThu, 27 Nov 2008 10:08:41 -0700
Cite this page as followsStatistical Computations at FreeStatistics.org, Office for Research Development and Education, URL https://freestatistics.org/blog/index.php?v=date/2008/Nov/27/t1227805780mhrdk505wttcrtf.htm/, Retrieved Sun, 19 May 2024 11:13:08 +0000
Statistical Computations at FreeStatistics.org, Office for Research Development and Education, URL https://freestatistics.org/blog/index.php?pk=25861, Retrieved Sun, 19 May 2024 11:13:08 +0000
QR Codes:

Original text written by user:
IsPrivate?No (this computation is public)
User-defined keywords
Estimated Impact140
Family? (F = Feedback message, R = changed R code, M = changed R Module, P = changed Parameters, D = changed Data)
F       [Multiple Regression] [s0700274] [2008-11-27 17:08:41] [e8ace8b3d80d7fc51f1760fb13a6fe6b] [Current]
Feedback Forum
2008-11-29 11:27:14 [Stephanie Vanderlinden] [reply
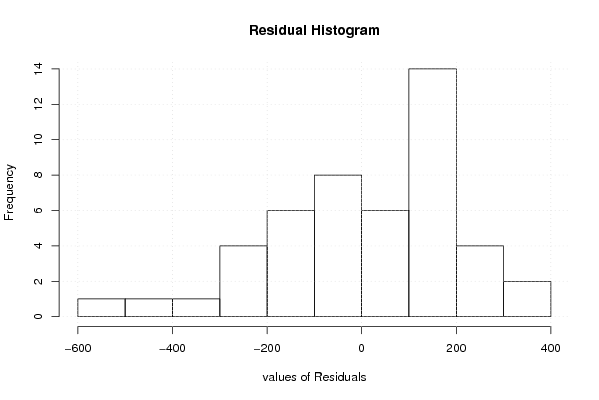
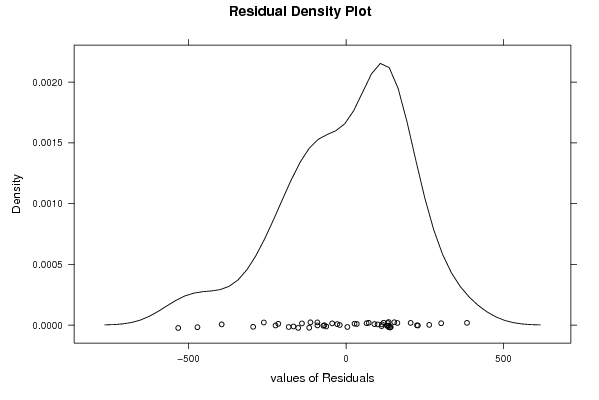
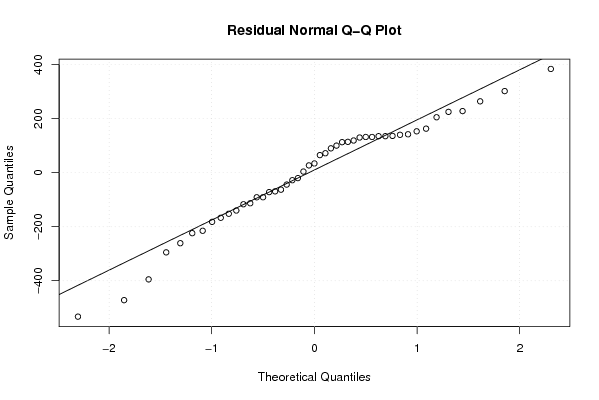
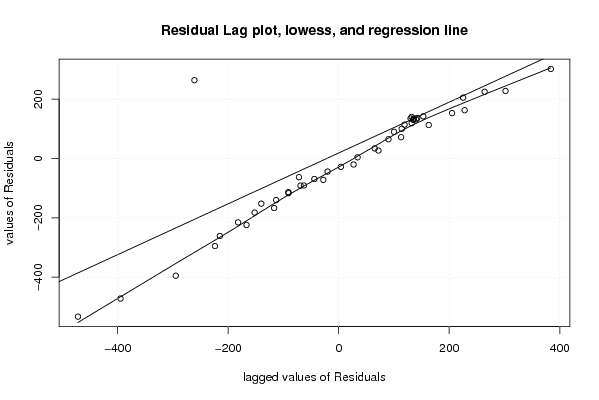
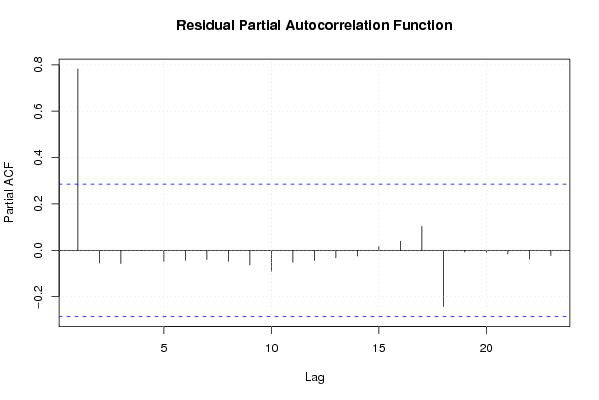
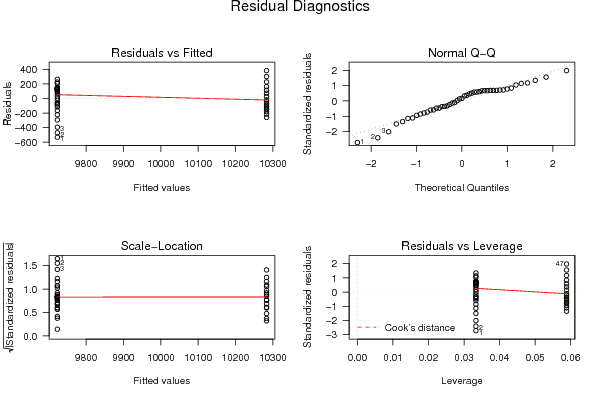
Goede berekeningen, de student heeft wel niet vermeld wat er is gebruikt als dummyvariabele. De uitleg bij de grafieken kon ook uitgebreider.
2008-11-30 15:02:53 [An Knapen] [reply
Deze vraag heeft de student goed opgelost, al is er wel niet vermeld wat er wordt gebruikt al dummievariabelen. De uitleg bij de grafieken is correct maar zeer beknopt. Bij de Residual Autocorrelation Function bijvoorbeeld, is het inderdaad correct de het betrouwbaarheidsintervan van 95% gelegen is binnen de blauwe lijnen. Er is echter niet vermeld dat in het begin, de verticale strepen duidelijk boven het interval uitsteken. Dit wijst erop dat we toch nog een aantal factoren over het hoofd hebben gezien.
2008-12-01 14:51:41 [] [reply
Je grafieken en conclusies zijn juist, maar ik weet niet wat je dummy variabele is.

Post a new message
Dataseries X:
9190	0
9251	0
9328	0
9428	0
9499	0
9556	0
9606	0
9632	0
9660	0
9651	0
9695	0
9727	0
9757	0
9788	0
9813	0
9823	0
9837	0
9842	0
9855	0
9863	0
9855	0
9858	0
9853	0
9858	0
9859	0
9865	0
9876	0
9928	0
9948	0
9987	0
10022	1
10068	1
10101	1
10131	1
10143	1
10170	1
10192	1
10214	1
10239	1
10263	1
10310	1
10355	1
10396	1
10446	1
10511	1
10585	1
10667	1


Summary of computational transaction
Raw Inputview raw input (R code)
Raw Outputview raw output of R engine
Computing time3 seconds
R Server'Gwilym Jenkins' @ 72.249.127.135

\begin{tabular}{lllllllll}
\hline
Summary of computational transaction \tabularnewline
Raw Input & view raw input (R code)  \tabularnewline
Raw Output & view raw output of R engine  \tabularnewline
Computing time & 3 seconds \tabularnewline
R Server & 'Gwilym Jenkins' @ 72.249.127.135 \tabularnewline
\hline
\end{tabular}
%Source: https://freestatistics.org/blog/index.php?pk=25861&T=0

[TABLE]
[ROW][C]Summary of computational transaction[/C][/ROW]
[ROW][C]Raw Input[/C][C]view raw input (R code) [/C][/ROW]
[ROW][C]Raw Output[/C][C]view raw output of R engine [/C][/ROW]
[ROW][C]Computing time[/C][C]3 seconds[/C][/ROW]
[ROW][C]R Server[/C][C]'Gwilym Jenkins' @ 72.249.127.135[/C][/ROW]
[/TABLE]
Source: https://freestatistics.org/blog/index.php?pk=25861&T=0

Globally Unique Identifier (entire table): ba.freestatistics.org/blog/index.php?pk=25861&T=0

As an alternative you can also use a QR Code:  

The GUIDs for individual cells are displayed in the table below:

Summary of computational transaction
Raw Inputview raw input (R code)
Raw Outputview raw output of R engine
Computing time3 seconds
R Server'Gwilym Jenkins' @ 72.249.127.135


Multiple Linear Regression - Estimated Regression Equation
Y[t] = + 9722.93333333333 + 560.18431372549D[t] + e[t]

\begin{tabular}{lllllllll}
\hline
Multiple Linear Regression - Estimated Regression Equation \tabularnewline
Y[t] =  +  9722.93333333333 +  560.18431372549D[t]  + e[t] \tabularnewline
\hline
\end{tabular}
%Source: https://freestatistics.org/blog/index.php?pk=25861&T=1

[TABLE]
[ROW][C]Multiple Linear Regression - Estimated Regression Equation[/C][/ROW]
[ROW][C]Y[t] =  +  9722.93333333333 +  560.18431372549D[t]  + e[t][/C][/ROW]
[/TABLE]
Source: https://freestatistics.org/blog/index.php?pk=25861&T=1

Globally Unique Identifier (entire table): ba.freestatistics.org/blog/index.php?pk=25861&T=1

As an alternative you can also use a QR Code:  

The GUIDs for individual cells are displayed in the table below:

Multiple Linear Regression - Estimated Regression Equation
Y[t] = + 9722.93333333333 + 560.18431372549D[t] + e[t]


Multiple Linear Regression - Ordinary Least Squares
VariableParameterS.D.T-STATH0: parameter = 02-tail p-value1-tail p-value
(Intercept)9722.9333333333336.484168266.497300
D560.1843137254960.6637039.234300

\begin{tabular}{lllllllll}
\hline
Multiple Linear Regression - Ordinary Least Squares \tabularnewline
Variable & Parameter & S.D. & T-STATH0: parameter = 0 & 2-tail p-value & 1-tail p-value \tabularnewline
(Intercept) & 9722.93333333333 & 36.484168 & 266.4973 & 0 & 0 \tabularnewline
D & 560.18431372549 & 60.663703 & 9.2343 & 0 & 0 \tabularnewline
\hline
\end{tabular}
%Source: https://freestatistics.org/blog/index.php?pk=25861&T=2

[TABLE]
[ROW][C]Multiple Linear Regression - Ordinary Least Squares[/C][/ROW]
[ROW][C]Variable[/C][C]Parameter[/C][C]S.D.[/C][C]T-STATH0: parameter = 0[/C][C]2-tail p-value[/C][C]1-tail p-value[/C][/ROW]
[ROW][C](Intercept)[/C][C]9722.93333333333[/C][C]36.484168[/C][C]266.4973[/C][C]0[/C][C]0[/C][/ROW]
[ROW][C]D[/C][C]560.18431372549[/C][C]60.663703[/C][C]9.2343[/C][C]0[/C][C]0[/C][/ROW]
[/TABLE]
Source: https://freestatistics.org/blog/index.php?pk=25861&T=2

Globally Unique Identifier (entire table): ba.freestatistics.org/blog/index.php?pk=25861&T=2

As an alternative you can also use a QR Code:  

The GUIDs for individual cells are displayed in the table below:

Multiple Linear Regression - Ordinary Least Squares
VariableParameterS.D.T-STATH0: parameter = 02-tail p-value1-tail p-value
(Intercept)9722.9333333333336.484168266.497300
D560.1843137254960.6637039.234300


Multiple Linear Regression - Regression Statistics
Multiple R0.809053553121173
R-squared0.654567651817994
Adjusted R-squared0.64689137741395
F-TEST (value)85.2715285260136
F-TEST (DF numerator)1
F-TEST (DF denominator)45
p-value5.93414206662146e-12
Multiple Linear Regression - Residual Statistics
Residual Standard Deviation199.832020088682
Sum Squared Residuals1796977.63137255

\begin{tabular}{lllllllll}
\hline
Multiple Linear Regression - Regression Statistics \tabularnewline
Multiple R & 0.809053553121173 \tabularnewline
R-squared & 0.654567651817994 \tabularnewline
Adjusted R-squared & 0.64689137741395 \tabularnewline
F-TEST (value) & 85.2715285260136 \tabularnewline
F-TEST (DF numerator) & 1 \tabularnewline
F-TEST (DF denominator) & 45 \tabularnewline
p-value & 5.93414206662146e-12 \tabularnewline
Multiple Linear Regression - Residual Statistics \tabularnewline
Residual Standard Deviation & 199.832020088682 \tabularnewline
Sum Squared Residuals & 1796977.63137255 \tabularnewline
\hline
\end{tabular}
%Source: https://freestatistics.org/blog/index.php?pk=25861&T=3

[TABLE]
[ROW][C]Multiple Linear Regression - Regression Statistics[/C][/ROW]
[ROW][C]Multiple R[/C][C]0.809053553121173[/C][/ROW]
[ROW][C]R-squared[/C][C]0.654567651817994[/C][/ROW]
[ROW][C]Adjusted R-squared[/C][C]0.64689137741395[/C][/ROW]
[ROW][C]F-TEST (value)[/C][C]85.2715285260136[/C][/ROW]
[ROW][C]F-TEST (DF numerator)[/C][C]1[/C][/ROW]
[ROW][C]F-TEST (DF denominator)[/C][C]45[/C][/ROW]
[ROW][C]p-value[/C][C]5.93414206662146e-12[/C][/ROW]
[ROW][C]Multiple Linear Regression - Residual Statistics[/C][/ROW]
[ROW][C]Residual Standard Deviation[/C][C]199.832020088682[/C][/ROW]
[ROW][C]Sum Squared Residuals[/C][C]1796977.63137255[/C][/ROW]
[/TABLE]
Source: https://freestatistics.org/blog/index.php?pk=25861&T=3

Globally Unique Identifier (entire table): ba.freestatistics.org/blog/index.php?pk=25861&T=3

As an alternative you can also use a QR Code:  

The GUIDs for individual cells are displayed in the table below:

Multiple Linear Regression - Regression Statistics
Multiple R0.809053553121173
R-squared0.654567651817994
Adjusted R-squared0.64689137741395
F-TEST (value)85.2715285260136
F-TEST (DF numerator)1
F-TEST (DF denominator)45
p-value5.93414206662146e-12
Multiple Linear Regression - Residual Statistics
Residual Standard Deviation199.832020088682
Sum Squared Residuals1796977.63137255


Multiple Linear Regression - Actuals, Interpolation, and Residuals
Time or IndexActualsInterpolationForecastResidualsPrediction Error
191909722.93333333334-532.933333333337
292519722.93333333333-471.933333333334
393289722.93333333333-394.933333333333
494289722.93333333333-294.933333333333
594999722.93333333333-223.933333333333
695569722.93333333333-166.933333333333
796069722.93333333333-116.933333333333
896329722.93333333333-90.9333333333332
996609722.93333333333-62.9333333333332
1096519722.93333333333-71.9333333333332
1196959722.93333333333-27.9333333333332
1297279722.933333333334.06666666666679
1397579722.9333333333334.0666666666668
1497889722.9333333333365.0666666666668
1598139722.9333333333390.0666666666668
1698239722.93333333333100.066666666667
1798379722.93333333333114.066666666667
1898429722.93333333333119.066666666667
1998559722.93333333333132.066666666667
2098639722.93333333333140.066666666667
2198559722.93333333333132.066666666667
2298589722.93333333333135.066666666667
2398539722.93333333333130.066666666667
2498589722.93333333333135.066666666667
2598599722.93333333333136.066666666667
2698659722.93333333333142.066666666667
2798769722.93333333333153.066666666667
2899289722.93333333333205.066666666667
2999489722.93333333333225.066666666667
3099879722.93333333333264.066666666667
311002210283.1176470588-261.117647058824
321006810283.1176470588-215.117647058824
331010110283.1176470588-182.117647058824
341013110283.1176470588-152.117647058824
351014310283.1176470588-140.117647058824
361017010283.1176470588-113.117647058824
371019210283.1176470588-91.1176470588236
381021410283.1176470588-69.1176470588236
391023910283.1176470588-44.1176470588236
401026310283.1176470588-20.1176470588236
411031010283.117647058826.8823529411764
421035510283.117647058871.8823529411764
431039610283.1176470588112.882352941176
441044610283.1176470588162.882352941176
451051110283.1176470588227.882352941176
461058510283.1176470588301.882352941176
471066710283.1176470588383.882352941176

\begin{tabular}{lllllllll}
\hline
Multiple Linear Regression - Actuals, Interpolation, and Residuals \tabularnewline
Time or Index & Actuals & InterpolationForecast & ResidualsPrediction Error \tabularnewline
1 & 9190 & 9722.93333333334 & -532.933333333337 \tabularnewline
2 & 9251 & 9722.93333333333 & -471.933333333334 \tabularnewline
3 & 9328 & 9722.93333333333 & -394.933333333333 \tabularnewline
4 & 9428 & 9722.93333333333 & -294.933333333333 \tabularnewline
5 & 9499 & 9722.93333333333 & -223.933333333333 \tabularnewline
6 & 9556 & 9722.93333333333 & -166.933333333333 \tabularnewline
7 & 9606 & 9722.93333333333 & -116.933333333333 \tabularnewline
8 & 9632 & 9722.93333333333 & -90.9333333333332 \tabularnewline
9 & 9660 & 9722.93333333333 & -62.9333333333332 \tabularnewline
10 & 9651 & 9722.93333333333 & -71.9333333333332 \tabularnewline
11 & 9695 & 9722.93333333333 & -27.9333333333332 \tabularnewline
12 & 9727 & 9722.93333333333 & 4.06666666666679 \tabularnewline
13 & 9757 & 9722.93333333333 & 34.0666666666668 \tabularnewline
14 & 9788 & 9722.93333333333 & 65.0666666666668 \tabularnewline
15 & 9813 & 9722.93333333333 & 90.0666666666668 \tabularnewline
16 & 9823 & 9722.93333333333 & 100.066666666667 \tabularnewline
17 & 9837 & 9722.93333333333 & 114.066666666667 \tabularnewline
18 & 9842 & 9722.93333333333 & 119.066666666667 \tabularnewline
19 & 9855 & 9722.93333333333 & 132.066666666667 \tabularnewline
20 & 9863 & 9722.93333333333 & 140.066666666667 \tabularnewline
21 & 9855 & 9722.93333333333 & 132.066666666667 \tabularnewline
22 & 9858 & 9722.93333333333 & 135.066666666667 \tabularnewline
23 & 9853 & 9722.93333333333 & 130.066666666667 \tabularnewline
24 & 9858 & 9722.93333333333 & 135.066666666667 \tabularnewline
25 & 9859 & 9722.93333333333 & 136.066666666667 \tabularnewline
26 & 9865 & 9722.93333333333 & 142.066666666667 \tabularnewline
27 & 9876 & 9722.93333333333 & 153.066666666667 \tabularnewline
28 & 9928 & 9722.93333333333 & 205.066666666667 \tabularnewline
29 & 9948 & 9722.93333333333 & 225.066666666667 \tabularnewline
30 & 9987 & 9722.93333333333 & 264.066666666667 \tabularnewline
31 & 10022 & 10283.1176470588 & -261.117647058824 \tabularnewline
32 & 10068 & 10283.1176470588 & -215.117647058824 \tabularnewline
33 & 10101 & 10283.1176470588 & -182.117647058824 \tabularnewline
34 & 10131 & 10283.1176470588 & -152.117647058824 \tabularnewline
35 & 10143 & 10283.1176470588 & -140.117647058824 \tabularnewline
36 & 10170 & 10283.1176470588 & -113.117647058824 \tabularnewline
37 & 10192 & 10283.1176470588 & -91.1176470588236 \tabularnewline
38 & 10214 & 10283.1176470588 & -69.1176470588236 \tabularnewline
39 & 10239 & 10283.1176470588 & -44.1176470588236 \tabularnewline
40 & 10263 & 10283.1176470588 & -20.1176470588236 \tabularnewline
41 & 10310 & 10283.1176470588 & 26.8823529411764 \tabularnewline
42 & 10355 & 10283.1176470588 & 71.8823529411764 \tabularnewline
43 & 10396 & 10283.1176470588 & 112.882352941176 \tabularnewline
44 & 10446 & 10283.1176470588 & 162.882352941176 \tabularnewline
45 & 10511 & 10283.1176470588 & 227.882352941176 \tabularnewline
46 & 10585 & 10283.1176470588 & 301.882352941176 \tabularnewline
47 & 10667 & 10283.1176470588 & 383.882352941176 \tabularnewline
\hline
\end{tabular}
%Source: https://freestatistics.org/blog/index.php?pk=25861&T=4

[TABLE]
[ROW][C]Multiple Linear Regression - Actuals, Interpolation, and Residuals[/C][/ROW]
[ROW][C]Time or Index[/C][C]Actuals[/C][C]InterpolationForecast[/C][C]ResidualsPrediction Error[/C][/ROW]
[ROW][C]1[/C][C]9190[/C][C]9722.93333333334[/C][C]-532.933333333337[/C][/ROW]
[ROW][C]2[/C][C]9251[/C][C]9722.93333333333[/C][C]-471.933333333334[/C][/ROW]
[ROW][C]3[/C][C]9328[/C][C]9722.93333333333[/C][C]-394.933333333333[/C][/ROW]
[ROW][C]4[/C][C]9428[/C][C]9722.93333333333[/C][C]-294.933333333333[/C][/ROW]
[ROW][C]5[/C][C]9499[/C][C]9722.93333333333[/C][C]-223.933333333333[/C][/ROW]
[ROW][C]6[/C][C]9556[/C][C]9722.93333333333[/C][C]-166.933333333333[/C][/ROW]
[ROW][C]7[/C][C]9606[/C][C]9722.93333333333[/C][C]-116.933333333333[/C][/ROW]
[ROW][C]8[/C][C]9632[/C][C]9722.93333333333[/C][C]-90.9333333333332[/C][/ROW]
[ROW][C]9[/C][C]9660[/C][C]9722.93333333333[/C][C]-62.9333333333332[/C][/ROW]
[ROW][C]10[/C][C]9651[/C][C]9722.93333333333[/C][C]-71.9333333333332[/C][/ROW]
[ROW][C]11[/C][C]9695[/C][C]9722.93333333333[/C][C]-27.9333333333332[/C][/ROW]
[ROW][C]12[/C][C]9727[/C][C]9722.93333333333[/C][C]4.06666666666679[/C][/ROW]
[ROW][C]13[/C][C]9757[/C][C]9722.93333333333[/C][C]34.0666666666668[/C][/ROW]
[ROW][C]14[/C][C]9788[/C][C]9722.93333333333[/C][C]65.0666666666668[/C][/ROW]
[ROW][C]15[/C][C]9813[/C][C]9722.93333333333[/C][C]90.0666666666668[/C][/ROW]
[ROW][C]16[/C][C]9823[/C][C]9722.93333333333[/C][C]100.066666666667[/C][/ROW]
[ROW][C]17[/C][C]9837[/C][C]9722.93333333333[/C][C]114.066666666667[/C][/ROW]
[ROW][C]18[/C][C]9842[/C][C]9722.93333333333[/C][C]119.066666666667[/C][/ROW]
[ROW][C]19[/C][C]9855[/C][C]9722.93333333333[/C][C]132.066666666667[/C][/ROW]
[ROW][C]20[/C][C]9863[/C][C]9722.93333333333[/C][C]140.066666666667[/C][/ROW]
[ROW][C]21[/C][C]9855[/C][C]9722.93333333333[/C][C]132.066666666667[/C][/ROW]
[ROW][C]22[/C][C]9858[/C][C]9722.93333333333[/C][C]135.066666666667[/C][/ROW]
[ROW][C]23[/C][C]9853[/C][C]9722.93333333333[/C][C]130.066666666667[/C][/ROW]
[ROW][C]24[/C][C]9858[/C][C]9722.93333333333[/C][C]135.066666666667[/C][/ROW]
[ROW][C]25[/C][C]9859[/C][C]9722.93333333333[/C][C]136.066666666667[/C][/ROW]
[ROW][C]26[/C][C]9865[/C][C]9722.93333333333[/C][C]142.066666666667[/C][/ROW]
[ROW][C]27[/C][C]9876[/C][C]9722.93333333333[/C][C]153.066666666667[/C][/ROW]
[ROW][C]28[/C][C]9928[/C][C]9722.93333333333[/C][C]205.066666666667[/C][/ROW]
[ROW][C]29[/C][C]9948[/C][C]9722.93333333333[/C][C]225.066666666667[/C][/ROW]
[ROW][C]30[/C][C]9987[/C][C]9722.93333333333[/C][C]264.066666666667[/C][/ROW]
[ROW][C]31[/C][C]10022[/C][C]10283.1176470588[/C][C]-261.117647058824[/C][/ROW]
[ROW][C]32[/C][C]10068[/C][C]10283.1176470588[/C][C]-215.117647058824[/C][/ROW]
[ROW][C]33[/C][C]10101[/C][C]10283.1176470588[/C][C]-182.117647058824[/C][/ROW]
[ROW][C]34[/C][C]10131[/C][C]10283.1176470588[/C][C]-152.117647058824[/C][/ROW]
[ROW][C]35[/C][C]10143[/C][C]10283.1176470588[/C][C]-140.117647058824[/C][/ROW]
[ROW][C]36[/C][C]10170[/C][C]10283.1176470588[/C][C]-113.117647058824[/C][/ROW]
[ROW][C]37[/C][C]10192[/C][C]10283.1176470588[/C][C]-91.1176470588236[/C][/ROW]
[ROW][C]38[/C][C]10214[/C][C]10283.1176470588[/C][C]-69.1176470588236[/C][/ROW]
[ROW][C]39[/C][C]10239[/C][C]10283.1176470588[/C][C]-44.1176470588236[/C][/ROW]
[ROW][C]40[/C][C]10263[/C][C]10283.1176470588[/C][C]-20.1176470588236[/C][/ROW]
[ROW][C]41[/C][C]10310[/C][C]10283.1176470588[/C][C]26.8823529411764[/C][/ROW]
[ROW][C]42[/C][C]10355[/C][C]10283.1176470588[/C][C]71.8823529411764[/C][/ROW]
[ROW][C]43[/C][C]10396[/C][C]10283.1176470588[/C][C]112.882352941176[/C][/ROW]
[ROW][C]44[/C][C]10446[/C][C]10283.1176470588[/C][C]162.882352941176[/C][/ROW]
[ROW][C]45[/C][C]10511[/C][C]10283.1176470588[/C][C]227.882352941176[/C][/ROW]
[ROW][C]46[/C][C]10585[/C][C]10283.1176470588[/C][C]301.882352941176[/C][/ROW]
[ROW][C]47[/C][C]10667[/C][C]10283.1176470588[/C][C]383.882352941176[/C][/ROW]
[/TABLE]
Source: https://freestatistics.org/blog/index.php?pk=25861&T=4

Globally Unique Identifier (entire table): ba.freestatistics.org/blog/index.php?pk=25861&T=4

As an alternative you can also use a QR Code:  

The GUIDs for individual cells are displayed in the table below:

Multiple Linear Regression - Actuals, Interpolation, and Residuals
Time or IndexActualsInterpolationForecastResidualsPrediction Error
191909722.93333333334-532.933333333337
292519722.93333333333-471.933333333334
393289722.93333333333-394.933333333333
494289722.93333333333-294.933333333333
594999722.93333333333-223.933333333333
695569722.93333333333-166.933333333333
796069722.93333333333-116.933333333333
896329722.93333333333-90.9333333333332
996609722.93333333333-62.9333333333332
1096519722.93333333333-71.9333333333332
1196959722.93333333333-27.9333333333332
1297279722.933333333334.06666666666679
1397579722.9333333333334.0666666666668
1497889722.9333333333365.0666666666668
1598139722.9333333333390.0666666666668
1698239722.93333333333100.066666666667
1798379722.93333333333114.066666666667
1898429722.93333333333119.066666666667
1998559722.93333333333132.066666666667
2098639722.93333333333140.066666666667
2198559722.93333333333132.066666666667
2298589722.93333333333135.066666666667
2398539722.93333333333130.066666666667
2498589722.93333333333135.066666666667
2598599722.93333333333136.066666666667
2698659722.93333333333142.066666666667
2798769722.93333333333153.066666666667
2899289722.93333333333205.066666666667
2999489722.93333333333225.066666666667
3099879722.93333333333264.066666666667
311002210283.1176470588-261.117647058824
321006810283.1176470588-215.117647058824
331010110283.1176470588-182.117647058824
341013110283.1176470588-152.117647058824
351014310283.1176470588-140.117647058824
361017010283.1176470588-113.117647058824
371019210283.1176470588-91.1176470588236
381021410283.1176470588-69.1176470588236
391023910283.1176470588-44.1176470588236
401026310283.1176470588-20.1176470588236
411031010283.117647058826.8823529411764
421035510283.117647058871.8823529411764
431039610283.1176470588112.882352941176
441044610283.1176470588162.882352941176
451051110283.1176470588227.882352941176
461058510283.1176470588301.882352941176
471066710283.1176470588383.882352941176


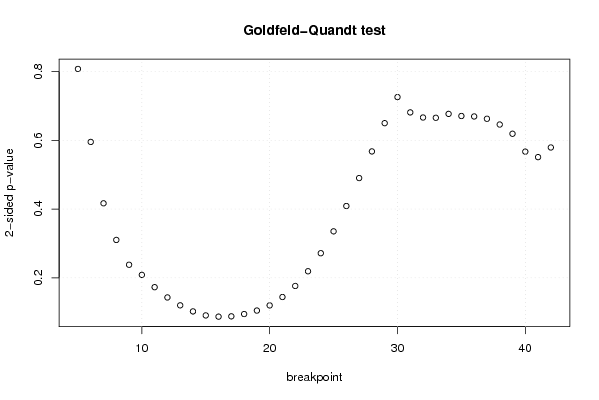
Goldfeld-Quandt test for Heteroskedasticity
p-valuesAlternative Hypothesis
breakpoint indexgreater2-sidedless
50.5961208842562770.8077582314874450.403879115743723
60.7022780502629370.5954438994741250.297721949737063
70.7915709720656850.4168580558686310.208429027934315
80.8448720680204540.3102558639590920.155127931979546
90.8809793114914650.2380413770170710.119020688508535
100.8956823783090310.2086352433819380.104317621690969
110.9135890353337250.1728219293325500.0864109646662752
120.9285111039308380.1429777921383250.0714888960691623
130.939995737419460.1200085251610820.0600042625805408
140.9488183114362640.1023633771274730.0511816885637363
150.9546536329816780.09069273403664440.0453463670183222
160.9564605763613170.08707884727736560.0435394236386828
170.9560068280554650.08798634388906970.0439931719445349
180.9526677222073230.09466455558535420.0473322777926771
190.9475983472135840.1048033055728310.0524016527864156
200.9400763449420020.1198473101159960.0599236550579978
210.9278849744081710.1442300511836580.072115025591829
220.9118197998133450.1763604003733100.0881802001866551
230.8904156232157570.2191687535684860.109584376784243
240.8641635924445560.2716728151108870.135836407555444
250.832338951625880.3353220967482410.167661048374121
260.795523342925790.4089533141484220.204476657074211
270.7548534443297520.4902931113404970.245146555670248
280.7161012753855870.5677974492288250.283898724614413
290.6749771604705690.6500456790588630.325022839529431
300.6370445045472770.7259109909054450.362955495452723
310.659335831391590.681328337216820.34066416860841
320.666751346407270.6664973071854610.333248653592730
330.6671738473427090.6656523053145820.332826152657291
340.6614829351699540.6770341296600920.338517064830046
350.6645696270748980.6708607458502030.335430372925102
360.6652379643313460.6695240713373090.334762035668654
370.6686023933264630.6627952133470750.331397606673537
380.6769652796747770.6460694406504450.323034720325223
390.6903848284698320.6192303430603350.309615171530168
400.7164175268446850.5671649463106310.283582473155315
410.7243673156036830.5512653687926350.275632684396317
420.710345612691360.5793087746172780.289654387308639

\begin{tabular}{lllllllll}
\hline
Goldfeld-Quandt test for Heteroskedasticity \tabularnewline
p-values & Alternative Hypothesis \tabularnewline
breakpoint index & greater & 2-sided & less \tabularnewline
5 & 0.596120884256277 & 0.807758231487445 & 0.403879115743723 \tabularnewline
6 & 0.702278050262937 & 0.595443899474125 & 0.297721949737063 \tabularnewline
7 & 0.791570972065685 & 0.416858055868631 & 0.208429027934315 \tabularnewline
8 & 0.844872068020454 & 0.310255863959092 & 0.155127931979546 \tabularnewline
9 & 0.880979311491465 & 0.238041377017071 & 0.119020688508535 \tabularnewline
10 & 0.895682378309031 & 0.208635243381938 & 0.104317621690969 \tabularnewline
11 & 0.913589035333725 & 0.172821929332550 & 0.0864109646662752 \tabularnewline
12 & 0.928511103930838 & 0.142977792138325 & 0.0714888960691623 \tabularnewline
13 & 0.93999573741946 & 0.120008525161082 & 0.0600042625805408 \tabularnewline
14 & 0.948818311436264 & 0.102363377127473 & 0.0511816885637363 \tabularnewline
15 & 0.954653632981678 & 0.0906927340366444 & 0.0453463670183222 \tabularnewline
16 & 0.956460576361317 & 0.0870788472773656 & 0.0435394236386828 \tabularnewline
17 & 0.956006828055465 & 0.0879863438890697 & 0.0439931719445349 \tabularnewline
18 & 0.952667722207323 & 0.0946645555853542 & 0.0473322777926771 \tabularnewline
19 & 0.947598347213584 & 0.104803305572831 & 0.0524016527864156 \tabularnewline
20 & 0.940076344942002 & 0.119847310115996 & 0.0599236550579978 \tabularnewline
21 & 0.927884974408171 & 0.144230051183658 & 0.072115025591829 \tabularnewline
22 & 0.911819799813345 & 0.176360400373310 & 0.0881802001866551 \tabularnewline
23 & 0.890415623215757 & 0.219168753568486 & 0.109584376784243 \tabularnewline
24 & 0.864163592444556 & 0.271672815110887 & 0.135836407555444 \tabularnewline
25 & 0.83233895162588 & 0.335322096748241 & 0.167661048374121 \tabularnewline
26 & 0.79552334292579 & 0.408953314148422 & 0.204476657074211 \tabularnewline
27 & 0.754853444329752 & 0.490293111340497 & 0.245146555670248 \tabularnewline
28 & 0.716101275385587 & 0.567797449228825 & 0.283898724614413 \tabularnewline
29 & 0.674977160470569 & 0.650045679058863 & 0.325022839529431 \tabularnewline
30 & 0.637044504547277 & 0.725910990905445 & 0.362955495452723 \tabularnewline
31 & 0.65933583139159 & 0.68132833721682 & 0.34066416860841 \tabularnewline
32 & 0.66675134640727 & 0.666497307185461 & 0.333248653592730 \tabularnewline
33 & 0.667173847342709 & 0.665652305314582 & 0.332826152657291 \tabularnewline
34 & 0.661482935169954 & 0.677034129660092 & 0.338517064830046 \tabularnewline
35 & 0.664569627074898 & 0.670860745850203 & 0.335430372925102 \tabularnewline
36 & 0.665237964331346 & 0.669524071337309 & 0.334762035668654 \tabularnewline
37 & 0.668602393326463 & 0.662795213347075 & 0.331397606673537 \tabularnewline
38 & 0.676965279674777 & 0.646069440650445 & 0.323034720325223 \tabularnewline
39 & 0.690384828469832 & 0.619230343060335 & 0.309615171530168 \tabularnewline
40 & 0.716417526844685 & 0.567164946310631 & 0.283582473155315 \tabularnewline
41 & 0.724367315603683 & 0.551265368792635 & 0.275632684396317 \tabularnewline
42 & 0.71034561269136 & 0.579308774617278 & 0.289654387308639 \tabularnewline
\hline
\end{tabular}
%Source: https://freestatistics.org/blog/index.php?pk=25861&T=5

[TABLE]
[ROW][C]Goldfeld-Quandt test for Heteroskedasticity[/C][/ROW]
[ROW][C]p-values[/C][C]Alternative Hypothesis[/C][/ROW]
[ROW][C]breakpoint index[/C][C]greater[/C][C]2-sided[/C][C]less[/C][/ROW]
[ROW][C]5[/C][C]0.596120884256277[/C][C]0.807758231487445[/C][C]0.403879115743723[/C][/ROW]
[ROW][C]6[/C][C]0.702278050262937[/C][C]0.595443899474125[/C][C]0.297721949737063[/C][/ROW]
[ROW][C]7[/C][C]0.791570972065685[/C][C]0.416858055868631[/C][C]0.208429027934315[/C][/ROW]
[ROW][C]8[/C][C]0.844872068020454[/C][C]0.310255863959092[/C][C]0.155127931979546[/C][/ROW]
[ROW][C]9[/C][C]0.880979311491465[/C][C]0.238041377017071[/C][C]0.119020688508535[/C][/ROW]
[ROW][C]10[/C][C]0.895682378309031[/C][C]0.208635243381938[/C][C]0.104317621690969[/C][/ROW]
[ROW][C]11[/C][C]0.913589035333725[/C][C]0.172821929332550[/C][C]0.0864109646662752[/C][/ROW]
[ROW][C]12[/C][C]0.928511103930838[/C][C]0.142977792138325[/C][C]0.0714888960691623[/C][/ROW]
[ROW][C]13[/C][C]0.93999573741946[/C][C]0.120008525161082[/C][C]0.0600042625805408[/C][/ROW]
[ROW][C]14[/C][C]0.948818311436264[/C][C]0.102363377127473[/C][C]0.0511816885637363[/C][/ROW]
[ROW][C]15[/C][C]0.954653632981678[/C][C]0.0906927340366444[/C][C]0.0453463670183222[/C][/ROW]
[ROW][C]16[/C][C]0.956460576361317[/C][C]0.0870788472773656[/C][C]0.0435394236386828[/C][/ROW]
[ROW][C]17[/C][C]0.956006828055465[/C][C]0.0879863438890697[/C][C]0.0439931719445349[/C][/ROW]
[ROW][C]18[/C][C]0.952667722207323[/C][C]0.0946645555853542[/C][C]0.0473322777926771[/C][/ROW]
[ROW][C]19[/C][C]0.947598347213584[/C][C]0.104803305572831[/C][C]0.0524016527864156[/C][/ROW]
[ROW][C]20[/C][C]0.940076344942002[/C][C]0.119847310115996[/C][C]0.0599236550579978[/C][/ROW]
[ROW][C]21[/C][C]0.927884974408171[/C][C]0.144230051183658[/C][C]0.072115025591829[/C][/ROW]
[ROW][C]22[/C][C]0.911819799813345[/C][C]0.176360400373310[/C][C]0.0881802001866551[/C][/ROW]
[ROW][C]23[/C][C]0.890415623215757[/C][C]0.219168753568486[/C][C]0.109584376784243[/C][/ROW]
[ROW][C]24[/C][C]0.864163592444556[/C][C]0.271672815110887[/C][C]0.135836407555444[/C][/ROW]
[ROW][C]25[/C][C]0.83233895162588[/C][C]0.335322096748241[/C][C]0.167661048374121[/C][/ROW]
[ROW][C]26[/C][C]0.79552334292579[/C][C]0.408953314148422[/C][C]0.204476657074211[/C][/ROW]
[ROW][C]27[/C][C]0.754853444329752[/C][C]0.490293111340497[/C][C]0.245146555670248[/C][/ROW]
[ROW][C]28[/C][C]0.716101275385587[/C][C]0.567797449228825[/C][C]0.283898724614413[/C][/ROW]
[ROW][C]29[/C][C]0.674977160470569[/C][C]0.650045679058863[/C][C]0.325022839529431[/C][/ROW]
[ROW][C]30[/C][C]0.637044504547277[/C][C]0.725910990905445[/C][C]0.362955495452723[/C][/ROW]
[ROW][C]31[/C][C]0.65933583139159[/C][C]0.68132833721682[/C][C]0.34066416860841[/C][/ROW]
[ROW][C]32[/C][C]0.66675134640727[/C][C]0.666497307185461[/C][C]0.333248653592730[/C][/ROW]
[ROW][C]33[/C][C]0.667173847342709[/C][C]0.665652305314582[/C][C]0.332826152657291[/C][/ROW]
[ROW][C]34[/C][C]0.661482935169954[/C][C]0.677034129660092[/C][C]0.338517064830046[/C][/ROW]
[ROW][C]35[/C][C]0.664569627074898[/C][C]0.670860745850203[/C][C]0.335430372925102[/C][/ROW]
[ROW][C]36[/C][C]0.665237964331346[/C][C]0.669524071337309[/C][C]0.334762035668654[/C][/ROW]
[ROW][C]37[/C][C]0.668602393326463[/C][C]0.662795213347075[/C][C]0.331397606673537[/C][/ROW]
[ROW][C]38[/C][C]0.676965279674777[/C][C]0.646069440650445[/C][C]0.323034720325223[/C][/ROW]
[ROW][C]39[/C][C]0.690384828469832[/C][C]0.619230343060335[/C][C]0.309615171530168[/C][/ROW]
[ROW][C]40[/C][C]0.716417526844685[/C][C]0.567164946310631[/C][C]0.283582473155315[/C][/ROW]
[ROW][C]41[/C][C]0.724367315603683[/C][C]0.551265368792635[/C][C]0.275632684396317[/C][/ROW]
[ROW][C]42[/C][C]0.71034561269136[/C][C]0.579308774617278[/C][C]0.289654387308639[/C][/ROW]
[/TABLE]
Source: https://freestatistics.org/blog/index.php?pk=25861&T=5

Globally Unique Identifier (entire table): ba.freestatistics.org/blog/index.php?pk=25861&T=5

As an alternative you can also use a QR Code:  

The GUIDs for individual cells are displayed in the table below:

Goldfeld-Quandt test for Heteroskedasticity
p-valuesAlternative Hypothesis
breakpoint indexgreater2-sidedless
50.5961208842562770.8077582314874450.403879115743723
60.7022780502629370.5954438994741250.297721949737063
70.7915709720656850.4168580558686310.208429027934315
80.8448720680204540.3102558639590920.155127931979546
90.8809793114914650.2380413770170710.119020688508535
100.8956823783090310.2086352433819380.104317621690969
110.9135890353337250.1728219293325500.0864109646662752
120.9285111039308380.1429777921383250.0714888960691623
130.939995737419460.1200085251610820.0600042625805408
140.9488183114362640.1023633771274730.0511816885637363
150.9546536329816780.09069273403664440.0453463670183222
160.9564605763613170.08707884727736560.0435394236386828
170.9560068280554650.08798634388906970.0439931719445349
180.9526677222073230.09466455558535420.0473322777926771
190.9475983472135840.1048033055728310.0524016527864156
200.9400763449420020.1198473101159960.0599236550579978
210.9278849744081710.1442300511836580.072115025591829
220.9118197998133450.1763604003733100.0881802001866551
230.8904156232157570.2191687535684860.109584376784243
240.8641635924445560.2716728151108870.135836407555444
250.832338951625880.3353220967482410.167661048374121
260.795523342925790.4089533141484220.204476657074211
270.7548534443297520.4902931113404970.245146555670248
280.7161012753855870.5677974492288250.283898724614413
290.6749771604705690.6500456790588630.325022839529431
300.6370445045472770.7259109909054450.362955495452723
310.659335831391590.681328337216820.34066416860841
320.666751346407270.6664973071854610.333248653592730
330.6671738473427090.6656523053145820.332826152657291
340.6614829351699540.6770341296600920.338517064830046
350.6645696270748980.6708607458502030.335430372925102
360.6652379643313460.6695240713373090.334762035668654
370.6686023933264630.6627952133470750.331397606673537
380.6769652796747770.6460694406504450.323034720325223
390.6903848284698320.6192303430603350.309615171530168
400.7164175268446850.5671649463106310.283582473155315
410.7243673156036830.5512653687926350.275632684396317
420.710345612691360.5793087746172780.289654387308639


Meta Analysis of Goldfeld-Quandt test for Heteroskedasticity
Description# significant tests% significant testsOK/NOK
1% type I error level00OK
5% type I error level00OK
10% type I error level40.105263157894737NOK

\begin{tabular}{lllllllll}
\hline
Meta Analysis of Goldfeld-Quandt test for Heteroskedasticity \tabularnewline
Description & # significant tests & % significant tests & OK/NOK \tabularnewline
1% type I error level & 0 & 0 & OK \tabularnewline
5% type I error level & 0 & 0 & OK \tabularnewline
10% type I error level & 4 & 0.105263157894737 & NOK \tabularnewline
\hline
\end{tabular}
%Source: https://freestatistics.org/blog/index.php?pk=25861&T=6

[TABLE]
[ROW][C]Meta Analysis of Goldfeld-Quandt test for Heteroskedasticity[/C][/ROW]
[ROW][C]Description[/C][C]# significant tests[/C][C]% significant tests[/C][C]OK/NOK[/C][/ROW]
[ROW][C]1% type I error level[/C][C]0[/C][C]0[/C][C]OK[/C][/ROW]
[ROW][C]5% type I error level[/C][C]0[/C][C]0[/C][C]OK[/C][/ROW]
[ROW][C]10% type I error level[/C][C]4[/C][C]0.105263157894737[/C][C]NOK[/C][/ROW]
[/TABLE]
Source: https://freestatistics.org/blog/index.php?pk=25861&T=6

Globally Unique Identifier (entire table): ba.freestatistics.org/blog/index.php?pk=25861&T=6

As an alternative you can also use a QR Code:  

The GUIDs for individual cells are displayed in the table below:

Meta Analysis of Goldfeld-Quandt test for Heteroskedasticity
Description# significant tests% significant testsOK/NOK
1% type I error level00OK
5% type I error level00OK
10% type I error level40.105263157894737NOK


Parameters (Session):
par1 = 1 ; par2 = Do not include Seasonal Dummies ; par3 = No Linear Trend ;
Parameters (R input):
par1 = 1 ; par2 = Do not include Seasonal Dummies ; par3 = No Linear Trend ;
R code (references can be found in the software module):
library(lattice)
library(lmtest)
n25 <- 25 #minimum number of obs. for Goldfeld-Quandt test
par1 <- as.numeric(par1)
x <- t(y)
k <- length(x[1,])
n <- length(x[,1])
x1 <- cbind(x[,par1], x[,1:k!=par1])
mycolnames <- c(colnames(x)[par1], colnames(x)[1:k!=par1])
colnames(x1) <- mycolnames #colnames(x)[par1]
x <- x1
if (par3 == 'First Differences'){
x2 <- array(0, dim=c(n-1,k), dimnames=list(1:(n-1), paste('(1-B)',colnames(x),sep='')))
for (i in 1:n-1) {
for (j in 1:k) {
x2[i,j] <- x[i+1,j] - x[i,j]
}
}
x <- x2
}
if (par2 == 'Include Monthly Dummies'){
x2 <- array(0, dim=c(n,11), dimnames=list(1:n, paste('M', seq(1:11), sep ='')))
for (i in 1:11){
x2[seq(i,n,12),i] <- 1
}
x <- cbind(x, x2)
}
if (par2 == 'Include Quarterly Dummies'){
x2 <- array(0, dim=c(n,3), dimnames=list(1:n, paste('Q', seq(1:3), sep ='')))
for (i in 1:3){
x2[seq(i,n,4),i] <- 1
}
x <- cbind(x, x2)
}
k <- length(x[1,])
if (par3 == 'Linear Trend'){
x <- cbind(x, c(1:n))
colnames(x)[k+1] <- 't'
}
x
k <- length(x[1,])
df <- as.data.frame(x)
(mylm <- lm(df))
(mysum <- summary(mylm))
if (n > n25) {
kp3 <- k + 3
nmkm3 <- n - k - 3
gqarr <- array(NA, dim=c(nmkm3-kp3+1,3))
numgqtests <- 0
numsignificant1 <- 0
numsignificant5 <- 0
numsignificant10 <- 0
for (mypoint in kp3:nmkm3) {
j <- 0
numgqtests <- numgqtests + 1
for (myalt in c('greater', 'two.sided', 'less')) {
j <- j + 1
gqarr[mypoint-kp3+1,j] <- gqtest(mylm, point=mypoint, alternative=myalt)$p.value
}
if (gqarr[mypoint-kp3+1,2] < 0.01) numsignificant1 <- numsignificant1 + 1
if (gqarr[mypoint-kp3+1,2] < 0.05) numsignificant5 <- numsignificant5 + 1
if (gqarr[mypoint-kp3+1,2] < 0.10) numsignificant10 <- numsignificant10 + 1
}
gqarr
}
bitmap(file='test0.png')
plot(x[,1], type='l', main='Actuals and Interpolation', ylab='value of Actuals and Interpolation (dots)', xlab='time or index')
points(x[,1]-mysum$resid)
grid()
dev.off()
bitmap(file='test1.png')
plot(mysum$resid, type='b', pch=19, main='Residuals', ylab='value of Residuals', xlab='time or index')
grid()
dev.off()
bitmap(file='test2.png')
hist(mysum$resid, main='Residual Histogram', xlab='values of Residuals')
grid()
dev.off()
bitmap(file='test3.png')
densityplot(~mysum$resid,col='black',main='Residual Density Plot', xlab='values of Residuals')
dev.off()
bitmap(file='test4.png')
qqnorm(mysum$resid, main='Residual Normal Q-Q Plot')
qqline(mysum$resid)
grid()
dev.off()
(myerror <- as.ts(mysum$resid))
bitmap(file='test5.png')
dum <- cbind(lag(myerror,k=1),myerror)
dum
dum1 <- dum[2:length(myerror),]
dum1
z <- as.data.frame(dum1)
z
plot(z,main=paste('Residual Lag plot, lowess, and regression line'), ylab='values of Residuals', xlab='lagged values of Residuals')
lines(lowess(z))
abline(lm(z))
grid()
dev.off()
bitmap(file='test6.png')
acf(mysum$resid, lag.max=length(mysum$resid)/2, main='Residual Autocorrelation Function')
grid()
dev.off()
bitmap(file='test7.png')
pacf(mysum$resid, lag.max=length(mysum$resid)/2, main='Residual Partial Autocorrelation Function')
grid()
dev.off()
bitmap(file='test8.png')
opar <- par(mfrow = c(2,2), oma = c(0, 0, 1.1, 0))
plot(mylm, las = 1, sub='Residual Diagnostics')
par(opar)
dev.off()
if (n > n25) {
bitmap(file='test9.png')
plot(kp3:nmkm3,gqarr[,2], main='Goldfeld-Quandt test',ylab='2-sided p-value',xlab='breakpoint')
grid()
dev.off()
}
load(file='createtable')
a<-table.start()
a<-table.row.start(a)
a<-table.element(a, 'Multiple Linear Regression - Estimated Regression Equation', 1, TRUE)
a<-table.row.end(a)
myeq <- colnames(x)[1]
myeq <- paste(myeq, '[t] = ', sep='')
for (i in 1:k){
if (mysum$coefficients[i,1] > 0) myeq <- paste(myeq, '+', '')
myeq <- paste(myeq, mysum$coefficients[i,1], sep=' ')
if (rownames(mysum$coefficients)[i] != '(Intercept)') {
myeq <- paste(myeq, rownames(mysum$coefficients)[i], sep='')
if (rownames(mysum$coefficients)[i] != 't') myeq <- paste(myeq, '[t]', sep='')
}
}
myeq <- paste(myeq, ' + e[t]')
a<-table.row.start(a)
a<-table.element(a, myeq)
a<-table.row.end(a)
a<-table.end(a)
table.save(a,file='mytable1.tab')
a<-table.start()
a<-table.row.start(a)
a<-table.element(a,hyperlink('ols1.htm','Multiple Linear Regression - Ordinary Least Squares',''), 6, TRUE)
a<-table.row.end(a)
a<-table.row.start(a)
a<-table.element(a,'Variable',header=TRUE)
a<-table.element(a,'Parameter',header=TRUE)
a<-table.element(a,'S.D.',header=TRUE)
a<-table.element(a,'T-STAT
H0: parameter = 0',header=TRUE)
a<-table.element(a,'2-tail p-value',header=TRUE)
a<-table.element(a,'1-tail p-value',header=TRUE)
a<-table.row.end(a)
for (i in 1:k){
a<-table.row.start(a)
a<-table.element(a,rownames(mysum$coefficients)[i],header=TRUE)
a<-table.element(a,mysum$coefficients[i,1])
a<-table.element(a, round(mysum$coefficients[i,2],6))
a<-table.element(a, round(mysum$coefficients[i,3],4))
a<-table.element(a, round(mysum$coefficients[i,4],6))
a<-table.element(a, round(mysum$coefficients[i,4]/2,6))
a<-table.row.end(a)
}
a<-table.end(a)
table.save(a,file='mytable2.tab')
a<-table.start()
a<-table.row.start(a)
a<-table.element(a, 'Multiple Linear Regression - Regression Statistics', 2, TRUE)
a<-table.row.end(a)
a<-table.row.start(a)
a<-table.element(a, 'Multiple R',1,TRUE)
a<-table.element(a, sqrt(mysum$r.squared))
a<-table.row.end(a)
a<-table.row.start(a)
a<-table.element(a, 'R-squared',1,TRUE)
a<-table.element(a, mysum$r.squared)
a<-table.row.end(a)
a<-table.row.start(a)
a<-table.element(a, 'Adjusted R-squared',1,TRUE)
a<-table.element(a, mysum$adj.r.squared)
a<-table.row.end(a)
a<-table.row.start(a)
a<-table.element(a, 'F-TEST (value)',1,TRUE)
a<-table.element(a, mysum$fstatistic[1])
a<-table.row.end(a)
a<-table.row.start(a)
a<-table.element(a, 'F-TEST (DF numerator)',1,TRUE)
a<-table.element(a, mysum$fstatistic[2])
a<-table.row.end(a)
a<-table.row.start(a)
a<-table.element(a, 'F-TEST (DF denominator)',1,TRUE)
a<-table.element(a, mysum$fstatistic[3])
a<-table.row.end(a)
a<-table.row.start(a)
a<-table.element(a, 'p-value',1,TRUE)
a<-table.element(a, 1-pf(mysum$fstatistic[1],mysum$fstatistic[2],mysum$fstatistic[3]))
a<-table.row.end(a)
a<-table.row.start(a)
a<-table.element(a, 'Multiple Linear Regression - Residual Statistics', 2, TRUE)
a<-table.row.end(a)
a<-table.row.start(a)
a<-table.element(a, 'Residual Standard Deviation',1,TRUE)
a<-table.element(a, mysum$sigma)
a<-table.row.end(a)
a<-table.row.start(a)
a<-table.element(a, 'Sum Squared Residuals',1,TRUE)
a<-table.element(a, sum(myerror*myerror))
a<-table.row.end(a)
a<-table.end(a)
table.save(a,file='mytable3.tab')
a<-table.start()
a<-table.row.start(a)
a<-table.element(a, 'Multiple Linear Regression - Actuals, Interpolation, and Residuals', 4, TRUE)
a<-table.row.end(a)
a<-table.row.start(a)
a<-table.element(a, 'Time or Index', 1, TRUE)
a<-table.element(a, 'Actuals', 1, TRUE)
a<-table.element(a, 'Interpolation
Forecast', 1, TRUE)
a<-table.element(a, 'Residuals
Prediction Error', 1, TRUE)
a<-table.row.end(a)
for (i in 1:n) {
a<-table.row.start(a)
a<-table.element(a,i, 1, TRUE)
a<-table.element(a,x[i])
a<-table.element(a,x[i]-mysum$resid[i])
a<-table.element(a,mysum$resid[i])
a<-table.row.end(a)
}
a<-table.end(a)
table.save(a,file='mytable4.tab')
if (n > n25) {
a<-table.start()
a<-table.row.start(a)
a<-table.element(a,'Goldfeld-Quandt test for Heteroskedasticity',4,TRUE)
a<-table.row.end(a)
a<-table.row.start(a)
a<-table.element(a,'p-values',header=TRUE)
a<-table.element(a,'Alternative Hypothesis',3,header=TRUE)
a<-table.row.end(a)
a<-table.row.start(a)
a<-table.element(a,'breakpoint index',header=TRUE)
a<-table.element(a,'greater',header=TRUE)
a<-table.element(a,'2-sided',header=TRUE)
a<-table.element(a,'less',header=TRUE)
a<-table.row.end(a)
for (mypoint in kp3:nmkm3) {
a<-table.row.start(a)
a<-table.element(a,mypoint,header=TRUE)
a<-table.element(a,gqarr[mypoint-kp3+1,1])
a<-table.element(a,gqarr[mypoint-kp3+1,2])
a<-table.element(a,gqarr[mypoint-kp3+1,3])
a<-table.row.end(a)
}
a<-table.end(a)
table.save(a,file='mytable5.tab')
a<-table.start()
a<-table.row.start(a)
a<-table.element(a,'Meta Analysis of Goldfeld-Quandt test for Heteroskedasticity',4,TRUE)
a<-table.row.end(a)
a<-table.row.start(a)
a<-table.element(a,'Description',header=TRUE)
a<-table.element(a,'# significant tests',header=TRUE)
a<-table.element(a,'% significant tests',header=TRUE)
a<-table.element(a,'OK/NOK',header=TRUE)
a<-table.row.end(a)
a<-table.row.start(a)
a<-table.element(a,'1% type I error level',header=TRUE)
a<-table.element(a,numsignificant1)
a<-table.element(a,numsignificant1/numgqtests)
if (numsignificant1/numgqtests < 0.01) dum <- 'OK' else dum <- 'NOK'
a<-table.element(a,dum)
a<-table.row.end(a)
a<-table.row.start(a)
a<-table.element(a,'5% type I error level',header=TRUE)
a<-table.element(a,numsignificant5)
a<-table.element(a,numsignificant5/numgqtests)
if (numsignificant5/numgqtests < 0.05) dum <- 'OK' else dum <- 'NOK'
a<-table.element(a,dum)
a<-table.row.end(a)
a<-table.row.start(a)
a<-table.element(a,'10% type I error level',header=TRUE)
a<-table.element(a,numsignificant10)
a<-table.element(a,numsignificant10/numgqtests)
if (numsignificant10/numgqtests < 0.1) dum <- 'OK' else dum <- 'NOK'
a<-table.element(a,dum)
a<-table.row.end(a)
a<-table.end(a)
table.save(a,file='mytable6.tab')
}