Free Statistics

of Irreproducible Research!

Author's title

Author*The author of this computation has been verified*
R Software Modulerwasp_multipleregression.wasp
Title produced by softwareMultiple Regression
Date of computationThu, 27 Nov 2008 09:42:54 -0700
Cite this page as followsStatistical Computations at FreeStatistics.org, Office for Research Development and Education, URL https://freestatistics.org/blog/index.php?v=date/2008/Nov/27/t1227804400jx5ptybmg72g4vt.htm/, Retrieved Sun, 19 May 2024 12:18:30 +0000
Statistical Computations at FreeStatistics.org, Office for Research Development and Education, URL https://freestatistics.org/blog/index.php?pk=25856, Retrieved Sun, 19 May 2024 12:18:30 +0000
QR Codes:

Original text written by user:
IsPrivate?No (this computation is public)
User-defined keywords
Estimated Impact149
Family? (F = Feedback message, R = changed R code, M = changed R Module, P = changed Parameters, D = changed Data)
-     [Multiple Regression] [The seatbelt law Q1] [2008-11-27 13:39:04] [fadb34a91ae52f73505d685a320f62da]
F   PD    [Multiple Regression] [Seatbelt law q3] [2008-11-27 16:42:54] [3452c99afdd85d4fde81272403cd85da] [Current]
Feedback Forum
2008-11-30 13:28:57 [Britt Severijns] [reply
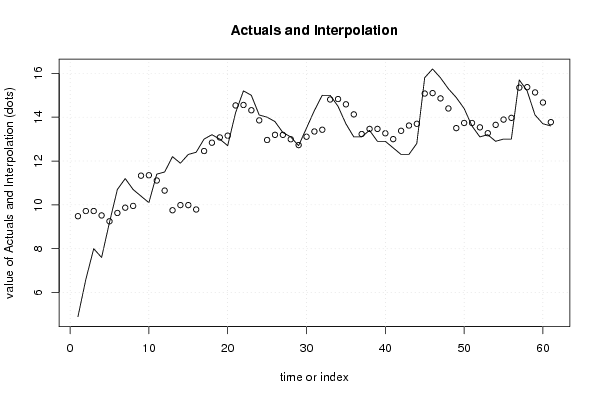
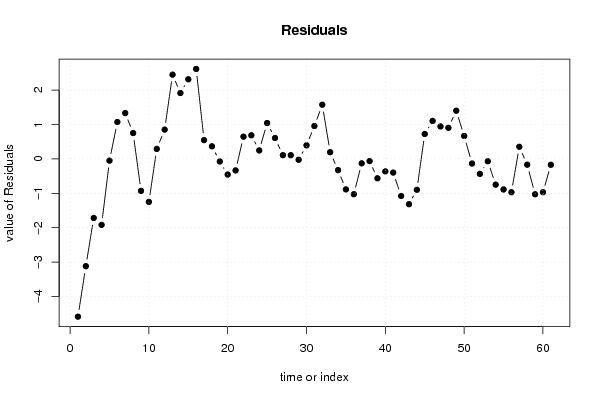
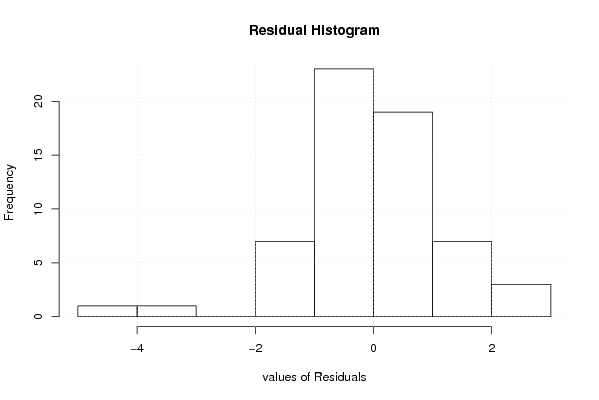
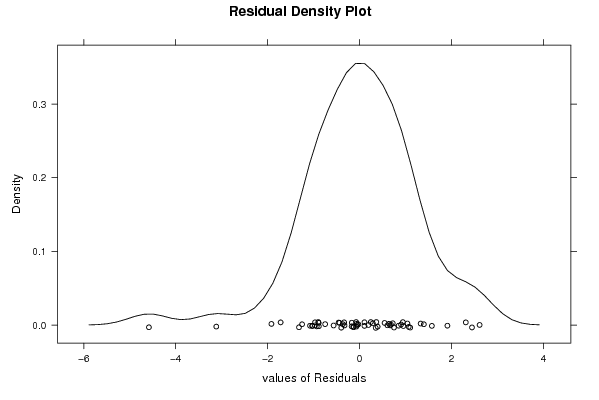
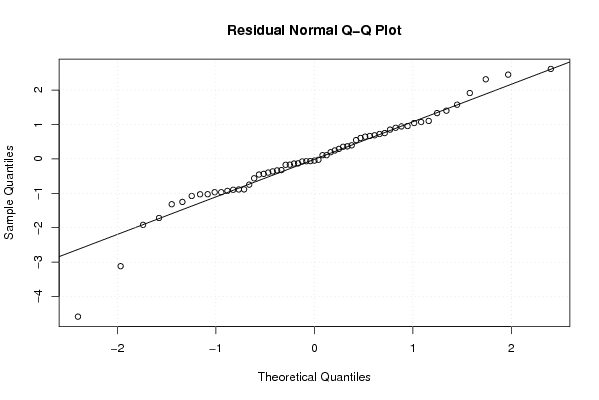
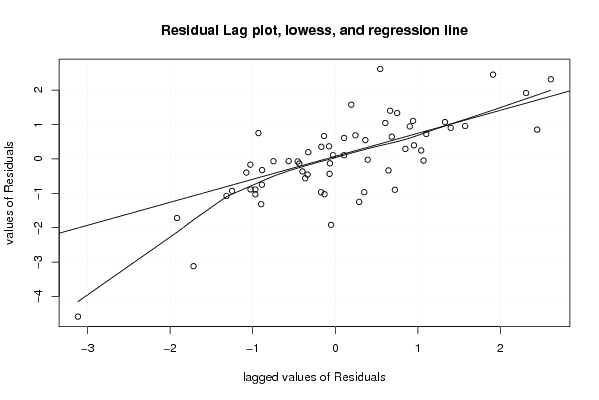
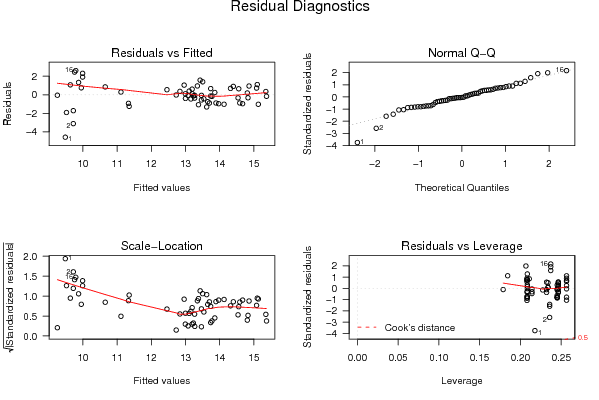
Ik denk dat je data nog verkeerd staat. De oudste gegevens moeten bovenaan en de jongste gegevens moeten onderaan. Hierdoor kan men de gegevens verkeerd interpreteren. Nu heeft men de indruk dat de koers/winst verhouding stijgend is maar eigenlijk is er een daling aanwezig. Zoals de student opmerkt kan er 60 % van de schommelingen verklaard worden met dit model. Als je de residuals bekijkt ziet men dat het gemiddelde niet constant is en niet gelijk aan 0 is.Er is dus niet voldaan aan de eerste assumtie. Er is ook geen normaalverdeling aanwezig bij residual histogram en de residual density plot. Aan de tweede assumptie van de autocorrelatie is wel voldaan. Zoals de student dus ook opmerkt kan het model nog verbetert worden.

Post a new message
Dataseries X:
4,9	1
6,6	1
8	1
7,6	1
9,2	1
10,7	1
11,2	1
10,7	1
10,4	1
10,1	1
11,4	1
11,5	1
12,2	1
11,9	1
12,3	1
12,4	1
13	0
13,2	0
13	0
12,7	0
14,2	0
15,2	0
15	0
14,1	0
14	0
13,8	0
13,3	0
13,1	0
12,7	0
13,5	0
14,3	0
15	0
15	0
14,5	0
13,7	0
13,1	0
13,1	0
13,4	0
12,9	0
12,9	0
12,6	0
12,3	0
12,3	0
12,8	0
15,8	0
16,2	0
15,8	0
15,3	0
14,9	0
14,4	0
13,6	0
13,1	0
13,2	0
12,9	0
13	0
13	0
15,7	0
15,2	0
14,1	0
13,7	0
13,6	0


Summary of computational transaction
Raw Inputview raw input (R code)
Raw Outputview raw output of R engine
Computing time4 seconds
R Server'Gwilym Jenkins' @ 72.249.127.135

\begin{tabular}{lllllllll}
\hline
Summary of computational transaction \tabularnewline
Raw Input & view raw input (R code)  \tabularnewline
Raw Output & view raw output of R engine  \tabularnewline
Computing time & 4 seconds \tabularnewline
R Server & 'Gwilym Jenkins' @ 72.249.127.135 \tabularnewline
\hline
\end{tabular}
%Source: https://freestatistics.org/blog/index.php?pk=25856&T=0

[TABLE]
[ROW][C]Summary of computational transaction[/C][/ROW]
[ROW][C]Raw Input[/C][C]view raw input (R code) [/C][/ROW]
[ROW][C]Raw Output[/C][C]view raw output of R engine [/C][/ROW]
[ROW][C]Computing time[/C][C]4 seconds[/C][/ROW]
[ROW][C]R Server[/C][C]'Gwilym Jenkins' @ 72.249.127.135[/C][/ROW]
[/TABLE]
Source: https://freestatistics.org/blog/index.php?pk=25856&T=0

Globally Unique Identifier (entire table): ba.freestatistics.org/blog/index.php?pk=25856&T=0

As an alternative you can also use a QR Code:  

The GUIDs for individual cells are displayed in the table below:

Summary of computational transaction
Raw Inputview raw input (R code)
Raw Outputview raw output of R engine
Computing time4 seconds
R Server'Gwilym Jenkins' @ 72.249.127.135


Multiple Linear Regression - Estimated Regression Equation
Koers/winst[t] = + 13.3134768211921 -2.93394039735099kredietcrisis[t] -0.919181383370124M1[t] -0.707292126563647M2[t] -0.729884105960267M3[t] -0.952476085356883M4[t] -1.24185614422370M5[t] -0.884448123620311M6[t] -0.667040103016925M7[t] -0.609632082413541M8[t] + 0.747775938189843M9[t] + 0.745183958793227M10[t] + 0.482591979396612M11[t] + 0.0225919793966151t + e[t]

\begin{tabular}{lllllllll}
\hline
Multiple Linear Regression - Estimated Regression Equation \tabularnewline
Koers/winst[t] =  +  13.3134768211921 -2.93394039735099kredietcrisis[t] -0.919181383370124M1[t] -0.707292126563647M2[t] -0.729884105960267M3[t] -0.952476085356883M4[t] -1.24185614422370M5[t] -0.884448123620311M6[t] -0.667040103016925M7[t] -0.609632082413541M8[t] +  0.747775938189843M9[t] +  0.745183958793227M10[t] +  0.482591979396612M11[t] +  0.0225919793966151t  + e[t] \tabularnewline
\hline
\end{tabular}
%Source: https://freestatistics.org/blog/index.php?pk=25856&T=1

[TABLE]
[ROW][C]Multiple Linear Regression - Estimated Regression Equation[/C][/ROW]
[ROW][C]Koers/winst[t] =  +  13.3134768211921 -2.93394039735099kredietcrisis[t] -0.919181383370124M1[t] -0.707292126563647M2[t] -0.729884105960267M3[t] -0.952476085356883M4[t] -1.24185614422370M5[t] -0.884448123620311M6[t] -0.667040103016925M7[t] -0.609632082413541M8[t] +  0.747775938189843M9[t] +  0.745183958793227M10[t] +  0.482591979396612M11[t] +  0.0225919793966151t  + e[t][/C][/ROW]
[/TABLE]
Source: https://freestatistics.org/blog/index.php?pk=25856&T=1

Globally Unique Identifier (entire table): ba.freestatistics.org/blog/index.php?pk=25856&T=1

As an alternative you can also use a QR Code:  

The GUIDs for individual cells are displayed in the table below:

Multiple Linear Regression - Estimated Regression Equation
Koers/winst[t] = + 13.3134768211921 -2.93394039735099kredietcrisis[t] -0.919181383370124M1[t] -0.707292126563647M2[t] -0.729884105960267M3[t] -0.952476085356883M4[t] -1.24185614422370M5[t] -0.884448123620311M6[t] -0.667040103016925M7[t] -0.609632082413541M8[t] + 0.747775938189843M9[t] + 0.745183958793227M10[t] + 0.482591979396612M11[t] + 0.0225919793966151t + e[t]


Multiple Linear Regression - Ordinary Least Squares
VariableParameterS.D.T-STATH0: parameter = 02-tail p-value1-tail p-value
(Intercept)13.31347682119210.90959414.636700
kredietcrisis-2.933940397350990.633684-4.632.9e-051.5e-05
M1-0.9191813833701240.83707-1.09810.2777570.138879
M2-0.7072921265636470.878244-0.80530.4246750.212337
M3-0.7298841059602670.877296-0.8320.4096330.204816
M4-0.9524760853568830.876629-1.08650.282790.141395
M5-1.241856144223700.879235-1.41240.1644120.082206
M6-0.8844481236203110.8774-1.0080.3186010.1593
M7-0.6670401030169250.875845-0.76160.4501060.225053
M8-0.6096320824135410.874571-0.69710.4891960.244598
M90.7477759381898430.8735780.8560.3963450.198173
M100.7451839587932270.8728690.85370.3975910.198796
M110.4825919793966120.8724430.55320.5827820.291391
t0.02259197939661510.0157441.4350.1579210.07896

\begin{tabular}{lllllllll}
\hline
Multiple Linear Regression - Ordinary Least Squares \tabularnewline
Variable & Parameter & S.D. & T-STATH0: parameter = 0 & 2-tail p-value & 1-tail p-value \tabularnewline
(Intercept) & 13.3134768211921 & 0.909594 & 14.6367 & 0 & 0 \tabularnewline
kredietcrisis & -2.93394039735099 & 0.633684 & -4.63 & 2.9e-05 & 1.5e-05 \tabularnewline
M1 & -0.919181383370124 & 0.83707 & -1.0981 & 0.277757 & 0.138879 \tabularnewline
M2 & -0.707292126563647 & 0.878244 & -0.8053 & 0.424675 & 0.212337 \tabularnewline
M3 & -0.729884105960267 & 0.877296 & -0.832 & 0.409633 & 0.204816 \tabularnewline
M4 & -0.952476085356883 & 0.876629 & -1.0865 & 0.28279 & 0.141395 \tabularnewline
M5 & -1.24185614422370 & 0.879235 & -1.4124 & 0.164412 & 0.082206 \tabularnewline
M6 & -0.884448123620311 & 0.8774 & -1.008 & 0.318601 & 0.1593 \tabularnewline
M7 & -0.667040103016925 & 0.875845 & -0.7616 & 0.450106 & 0.225053 \tabularnewline
M8 & -0.609632082413541 & 0.874571 & -0.6971 & 0.489196 & 0.244598 \tabularnewline
M9 & 0.747775938189843 & 0.873578 & 0.856 & 0.396345 & 0.198173 \tabularnewline
M10 & 0.745183958793227 & 0.872869 & 0.8537 & 0.397591 & 0.198796 \tabularnewline
M11 & 0.482591979396612 & 0.872443 & 0.5532 & 0.582782 & 0.291391 \tabularnewline
t & 0.0225919793966151 & 0.015744 & 1.435 & 0.157921 & 0.07896 \tabularnewline
\hline
\end{tabular}
%Source: https://freestatistics.org/blog/index.php?pk=25856&T=2

[TABLE]
[ROW][C]Multiple Linear Regression - Ordinary Least Squares[/C][/ROW]
[ROW][C]Variable[/C][C]Parameter[/C][C]S.D.[/C][C]T-STATH0: parameter = 0[/C][C]2-tail p-value[/C][C]1-tail p-value[/C][/ROW]
[ROW][C](Intercept)[/C][C]13.3134768211921[/C][C]0.909594[/C][C]14.6367[/C][C]0[/C][C]0[/C][/ROW]
[ROW][C]kredietcrisis[/C][C]-2.93394039735099[/C][C]0.633684[/C][C]-4.63[/C][C]2.9e-05[/C][C]1.5e-05[/C][/ROW]
[ROW][C]M1[/C][C]-0.919181383370124[/C][C]0.83707[/C][C]-1.0981[/C][C]0.277757[/C][C]0.138879[/C][/ROW]
[ROW][C]M2[/C][C]-0.707292126563647[/C][C]0.878244[/C][C]-0.8053[/C][C]0.424675[/C][C]0.212337[/C][/ROW]
[ROW][C]M3[/C][C]-0.729884105960267[/C][C]0.877296[/C][C]-0.832[/C][C]0.409633[/C][C]0.204816[/C][/ROW]
[ROW][C]M4[/C][C]-0.952476085356883[/C][C]0.876629[/C][C]-1.0865[/C][C]0.28279[/C][C]0.141395[/C][/ROW]
[ROW][C]M5[/C][C]-1.24185614422370[/C][C]0.879235[/C][C]-1.4124[/C][C]0.164412[/C][C]0.082206[/C][/ROW]
[ROW][C]M6[/C][C]-0.884448123620311[/C][C]0.8774[/C][C]-1.008[/C][C]0.318601[/C][C]0.1593[/C][/ROW]
[ROW][C]M7[/C][C]-0.667040103016925[/C][C]0.875845[/C][C]-0.7616[/C][C]0.450106[/C][C]0.225053[/C][/ROW]
[ROW][C]M8[/C][C]-0.609632082413541[/C][C]0.874571[/C][C]-0.6971[/C][C]0.489196[/C][C]0.244598[/C][/ROW]
[ROW][C]M9[/C][C]0.747775938189843[/C][C]0.873578[/C][C]0.856[/C][C]0.396345[/C][C]0.198173[/C][/ROW]
[ROW][C]M10[/C][C]0.745183958793227[/C][C]0.872869[/C][C]0.8537[/C][C]0.397591[/C][C]0.198796[/C][/ROW]
[ROW][C]M11[/C][C]0.482591979396612[/C][C]0.872443[/C][C]0.5532[/C][C]0.582782[/C][C]0.291391[/C][/ROW]
[ROW][C]t[/C][C]0.0225919793966151[/C][C]0.015744[/C][C]1.435[/C][C]0.157921[/C][C]0.07896[/C][/ROW]
[/TABLE]
Source: https://freestatistics.org/blog/index.php?pk=25856&T=2

Globally Unique Identifier (entire table): ba.freestatistics.org/blog/index.php?pk=25856&T=2

As an alternative you can also use a QR Code:  

The GUIDs for individual cells are displayed in the table below:

Multiple Linear Regression - Ordinary Least Squares
VariableParameterS.D.T-STATH0: parameter = 02-tail p-value1-tail p-value
(Intercept)13.31347682119210.90959414.636700
kredietcrisis-2.933940397350990.633684-4.632.9e-051.5e-05
M1-0.9191813833701240.83707-1.09810.2777570.138879
M2-0.7072921265636470.878244-0.80530.4246750.212337
M3-0.7298841059602670.877296-0.8320.4096330.204816
M4-0.9524760853568830.876629-1.08650.282790.141395
M5-1.241856144223700.879235-1.41240.1644120.082206
M6-0.8844481236203110.8774-1.0080.3186010.1593
M7-0.6670401030169250.875845-0.76160.4501060.225053
M8-0.6096320824135410.874571-0.69710.4891960.244598
M90.7477759381898430.8735780.8560.3963450.198173
M100.7451839587932270.8728690.85370.3975910.198796
M110.4825919793966120.8724430.55320.5827820.291391
t0.02259197939661510.0157441.4350.1579210.07896


Multiple Linear Regression - Regression Statistics
Multiple R0.831061812260906
R-squared0.690663735798381
Adjusted R-squared0.605102641444742
F-TEST (value)8.0721704299824
F-TEST (DF numerator)13
F-TEST (DF denominator)47
p-value3.74107753664532e-08
Multiple Linear Regression - Residual Statistics
Residual Standard Deviation1.37922812038804
Sum Squared Residuals89.4066997792492

\begin{tabular}{lllllllll}
\hline
Multiple Linear Regression - Regression Statistics \tabularnewline
Multiple R & 0.831061812260906 \tabularnewline
R-squared & 0.690663735798381 \tabularnewline
Adjusted R-squared & 0.605102641444742 \tabularnewline
F-TEST (value) & 8.0721704299824 \tabularnewline
F-TEST (DF numerator) & 13 \tabularnewline
F-TEST (DF denominator) & 47 \tabularnewline
p-value & 3.74107753664532e-08 \tabularnewline
Multiple Linear Regression - Residual Statistics \tabularnewline
Residual Standard Deviation & 1.37922812038804 \tabularnewline
Sum Squared Residuals & 89.4066997792492 \tabularnewline
\hline
\end{tabular}
%Source: https://freestatistics.org/blog/index.php?pk=25856&T=3

[TABLE]
[ROW][C]Multiple Linear Regression - Regression Statistics[/C][/ROW]
[ROW][C]Multiple R[/C][C]0.831061812260906[/C][/ROW]
[ROW][C]R-squared[/C][C]0.690663735798381[/C][/ROW]
[ROW][C]Adjusted R-squared[/C][C]0.605102641444742[/C][/ROW]
[ROW][C]F-TEST (value)[/C][C]8.0721704299824[/C][/ROW]
[ROW][C]F-TEST (DF numerator)[/C][C]13[/C][/ROW]
[ROW][C]F-TEST (DF denominator)[/C][C]47[/C][/ROW]
[ROW][C]p-value[/C][C]3.74107753664532e-08[/C][/ROW]
[ROW][C]Multiple Linear Regression - Residual Statistics[/C][/ROW]
[ROW][C]Residual Standard Deviation[/C][C]1.37922812038804[/C][/ROW]
[ROW][C]Sum Squared Residuals[/C][C]89.4066997792492[/C][/ROW]
[/TABLE]
Source: https://freestatistics.org/blog/index.php?pk=25856&T=3

Globally Unique Identifier (entire table): ba.freestatistics.org/blog/index.php?pk=25856&T=3

As an alternative you can also use a QR Code:  

The GUIDs for individual cells are displayed in the table below:

Multiple Linear Regression - Regression Statistics
Multiple R0.831061812260906
R-squared0.690663735798381
Adjusted R-squared0.605102641444742
F-TEST (value)8.0721704299824
F-TEST (DF numerator)13
F-TEST (DF denominator)47
p-value3.74107753664532e-08
Multiple Linear Regression - Residual Statistics
Residual Standard Deviation1.37922812038804
Sum Squared Residuals89.4066997792492


Multiple Linear Regression - Actuals, Interpolation, and Residuals
Time or IndexActualsInterpolationForecastResidualsPrediction Error
14.99.48294701986753-4.58294701986754
26.69.71742825607062-3.11742825607062
389.71742825607064-1.71742825607064
47.69.51742825607064-1.91742825607064
59.29.25064017660044-0.0506401766004418
610.79.630640176600441.06935982339956
711.29.870640176600441.32935982339956
810.79.950640176600440.749359823399557
910.411.3306401766004-0.930640176600441
1010.111.3506401766004-1.25064017660044
1111.411.11064017660040.289359823399559
1211.510.65064017660040.849359823399558
1312.29.754050772626942.44594922737306
1411.99.988532008830021.91146799116998
1512.39.988532008830022.31146799116998
1612.49.788532008830022.61146799116998
171312.45568432671080.544315673289182
1813.212.83568432671080.364315673289181
191313.0756843267108-0.0756843267108186
2012.713.1556843267108-0.455684326710819
2114.214.5356843267108-0.335684326710818
2215.214.55568432671080.644315673289182
231514.31568432671080.684315673289182
2414.113.85568432671080.244315673289181
251412.95909492273731.04090507726269
2613.813.19357615894040.606423841059599
2713.313.19357615894040.106423841059602
2813.112.99357615894040.106423841059602
2912.712.7267880794702-0.0267880794701999
3013.513.10678807947020.3932119205298
3114.313.34678807947020.953211920529801
321513.42678807947021.5732119205298
331514.80678807947020.193211920529802
3414.514.8267880794702-0.326788079470198
3513.714.5867880794702-0.8867880794702
3613.114.1267880794702-1.0267880794702
3713.113.2301986754967-0.130198675496692
3813.413.4646799116998-0.0646799116997822
3912.913.4646799116998-0.564679911699779
4012.913.2646799116998-0.364679911699778
4112.612.9978918322296-0.39789183222958
4212.313.3778918322296-1.07789183222958
4312.313.6178918322296-1.31789183222958
4412.813.6978918322296-0.897891832229579
4515.815.07789183222960.722108167770421
4616.215.09789183222961.10210816777042
4715.814.85789183222960.94210816777042
4815.314.39789183222960.90210816777042
4914.913.50130242825611.39869757174393
5014.413.73578366445920.664216335540837
5113.613.7357836644592-0.135783664459160
5213.113.5357836644592-0.43578366445916
5313.213.2689955849890-0.0689955849889616
5412.913.6489955849890-0.74899558498896
551313.8889955849890-0.88899558498896
561313.9689955849890-0.968995584988961
5715.715.34899558498900.351004415011039
5815.215.3689955849890-0.168995584988961
5914.115.1289955849890-1.02899558498896
6013.714.6689955849890-0.968995584988962
6113.613.7724061810155-0.172406181015454

\begin{tabular}{lllllllll}
\hline
Multiple Linear Regression - Actuals, Interpolation, and Residuals \tabularnewline
Time or Index & Actuals & InterpolationForecast & ResidualsPrediction Error \tabularnewline
1 & 4.9 & 9.48294701986753 & -4.58294701986754 \tabularnewline
2 & 6.6 & 9.71742825607062 & -3.11742825607062 \tabularnewline
3 & 8 & 9.71742825607064 & -1.71742825607064 \tabularnewline
4 & 7.6 & 9.51742825607064 & -1.91742825607064 \tabularnewline
5 & 9.2 & 9.25064017660044 & -0.0506401766004418 \tabularnewline
6 & 10.7 & 9.63064017660044 & 1.06935982339956 \tabularnewline
7 & 11.2 & 9.87064017660044 & 1.32935982339956 \tabularnewline
8 & 10.7 & 9.95064017660044 & 0.749359823399557 \tabularnewline
9 & 10.4 & 11.3306401766004 & -0.930640176600441 \tabularnewline
10 & 10.1 & 11.3506401766004 & -1.25064017660044 \tabularnewline
11 & 11.4 & 11.1106401766004 & 0.289359823399559 \tabularnewline
12 & 11.5 & 10.6506401766004 & 0.849359823399558 \tabularnewline
13 & 12.2 & 9.75405077262694 & 2.44594922737306 \tabularnewline
14 & 11.9 & 9.98853200883002 & 1.91146799116998 \tabularnewline
15 & 12.3 & 9.98853200883002 & 2.31146799116998 \tabularnewline
16 & 12.4 & 9.78853200883002 & 2.61146799116998 \tabularnewline
17 & 13 & 12.4556843267108 & 0.544315673289182 \tabularnewline
18 & 13.2 & 12.8356843267108 & 0.364315673289181 \tabularnewline
19 & 13 & 13.0756843267108 & -0.0756843267108186 \tabularnewline
20 & 12.7 & 13.1556843267108 & -0.455684326710819 \tabularnewline
21 & 14.2 & 14.5356843267108 & -0.335684326710818 \tabularnewline
22 & 15.2 & 14.5556843267108 & 0.644315673289182 \tabularnewline
23 & 15 & 14.3156843267108 & 0.684315673289182 \tabularnewline
24 & 14.1 & 13.8556843267108 & 0.244315673289181 \tabularnewline
25 & 14 & 12.9590949227373 & 1.04090507726269 \tabularnewline
26 & 13.8 & 13.1935761589404 & 0.606423841059599 \tabularnewline
27 & 13.3 & 13.1935761589404 & 0.106423841059602 \tabularnewline
28 & 13.1 & 12.9935761589404 & 0.106423841059602 \tabularnewline
29 & 12.7 & 12.7267880794702 & -0.0267880794701999 \tabularnewline
30 & 13.5 & 13.1067880794702 & 0.3932119205298 \tabularnewline
31 & 14.3 & 13.3467880794702 & 0.953211920529801 \tabularnewline
32 & 15 & 13.4267880794702 & 1.5732119205298 \tabularnewline
33 & 15 & 14.8067880794702 & 0.193211920529802 \tabularnewline
34 & 14.5 & 14.8267880794702 & -0.326788079470198 \tabularnewline
35 & 13.7 & 14.5867880794702 & -0.8867880794702 \tabularnewline
36 & 13.1 & 14.1267880794702 & -1.0267880794702 \tabularnewline
37 & 13.1 & 13.2301986754967 & -0.130198675496692 \tabularnewline
38 & 13.4 & 13.4646799116998 & -0.0646799116997822 \tabularnewline
39 & 12.9 & 13.4646799116998 & -0.564679911699779 \tabularnewline
40 & 12.9 & 13.2646799116998 & -0.364679911699778 \tabularnewline
41 & 12.6 & 12.9978918322296 & -0.39789183222958 \tabularnewline
42 & 12.3 & 13.3778918322296 & -1.07789183222958 \tabularnewline
43 & 12.3 & 13.6178918322296 & -1.31789183222958 \tabularnewline
44 & 12.8 & 13.6978918322296 & -0.897891832229579 \tabularnewline
45 & 15.8 & 15.0778918322296 & 0.722108167770421 \tabularnewline
46 & 16.2 & 15.0978918322296 & 1.10210816777042 \tabularnewline
47 & 15.8 & 14.8578918322296 & 0.94210816777042 \tabularnewline
48 & 15.3 & 14.3978918322296 & 0.90210816777042 \tabularnewline
49 & 14.9 & 13.5013024282561 & 1.39869757174393 \tabularnewline
50 & 14.4 & 13.7357836644592 & 0.664216335540837 \tabularnewline
51 & 13.6 & 13.7357836644592 & -0.135783664459160 \tabularnewline
52 & 13.1 & 13.5357836644592 & -0.43578366445916 \tabularnewline
53 & 13.2 & 13.2689955849890 & -0.0689955849889616 \tabularnewline
54 & 12.9 & 13.6489955849890 & -0.74899558498896 \tabularnewline
55 & 13 & 13.8889955849890 & -0.88899558498896 \tabularnewline
56 & 13 & 13.9689955849890 & -0.968995584988961 \tabularnewline
57 & 15.7 & 15.3489955849890 & 0.351004415011039 \tabularnewline
58 & 15.2 & 15.3689955849890 & -0.168995584988961 \tabularnewline
59 & 14.1 & 15.1289955849890 & -1.02899558498896 \tabularnewline
60 & 13.7 & 14.6689955849890 & -0.968995584988962 \tabularnewline
61 & 13.6 & 13.7724061810155 & -0.172406181015454 \tabularnewline
\hline
\end{tabular}
%Source: https://freestatistics.org/blog/index.php?pk=25856&T=4

[TABLE]
[ROW][C]Multiple Linear Regression - Actuals, Interpolation, and Residuals[/C][/ROW]
[ROW][C]Time or Index[/C][C]Actuals[/C][C]InterpolationForecast[/C][C]ResidualsPrediction Error[/C][/ROW]
[ROW][C]1[/C][C]4.9[/C][C]9.48294701986753[/C][C]-4.58294701986754[/C][/ROW]
[ROW][C]2[/C][C]6.6[/C][C]9.71742825607062[/C][C]-3.11742825607062[/C][/ROW]
[ROW][C]3[/C][C]8[/C][C]9.71742825607064[/C][C]-1.71742825607064[/C][/ROW]
[ROW][C]4[/C][C]7.6[/C][C]9.51742825607064[/C][C]-1.91742825607064[/C][/ROW]
[ROW][C]5[/C][C]9.2[/C][C]9.25064017660044[/C][C]-0.0506401766004418[/C][/ROW]
[ROW][C]6[/C][C]10.7[/C][C]9.63064017660044[/C][C]1.06935982339956[/C][/ROW]
[ROW][C]7[/C][C]11.2[/C][C]9.87064017660044[/C][C]1.32935982339956[/C][/ROW]
[ROW][C]8[/C][C]10.7[/C][C]9.95064017660044[/C][C]0.749359823399557[/C][/ROW]
[ROW][C]9[/C][C]10.4[/C][C]11.3306401766004[/C][C]-0.930640176600441[/C][/ROW]
[ROW][C]10[/C][C]10.1[/C][C]11.3506401766004[/C][C]-1.25064017660044[/C][/ROW]
[ROW][C]11[/C][C]11.4[/C][C]11.1106401766004[/C][C]0.289359823399559[/C][/ROW]
[ROW][C]12[/C][C]11.5[/C][C]10.6506401766004[/C][C]0.849359823399558[/C][/ROW]
[ROW][C]13[/C][C]12.2[/C][C]9.75405077262694[/C][C]2.44594922737306[/C][/ROW]
[ROW][C]14[/C][C]11.9[/C][C]9.98853200883002[/C][C]1.91146799116998[/C][/ROW]
[ROW][C]15[/C][C]12.3[/C][C]9.98853200883002[/C][C]2.31146799116998[/C][/ROW]
[ROW][C]16[/C][C]12.4[/C][C]9.78853200883002[/C][C]2.61146799116998[/C][/ROW]
[ROW][C]17[/C][C]13[/C][C]12.4556843267108[/C][C]0.544315673289182[/C][/ROW]
[ROW][C]18[/C][C]13.2[/C][C]12.8356843267108[/C][C]0.364315673289181[/C][/ROW]
[ROW][C]19[/C][C]13[/C][C]13.0756843267108[/C][C]-0.0756843267108186[/C][/ROW]
[ROW][C]20[/C][C]12.7[/C][C]13.1556843267108[/C][C]-0.455684326710819[/C][/ROW]
[ROW][C]21[/C][C]14.2[/C][C]14.5356843267108[/C][C]-0.335684326710818[/C][/ROW]
[ROW][C]22[/C][C]15.2[/C][C]14.5556843267108[/C][C]0.644315673289182[/C][/ROW]
[ROW][C]23[/C][C]15[/C][C]14.3156843267108[/C][C]0.684315673289182[/C][/ROW]
[ROW][C]24[/C][C]14.1[/C][C]13.8556843267108[/C][C]0.244315673289181[/C][/ROW]
[ROW][C]25[/C][C]14[/C][C]12.9590949227373[/C][C]1.04090507726269[/C][/ROW]
[ROW][C]26[/C][C]13.8[/C][C]13.1935761589404[/C][C]0.606423841059599[/C][/ROW]
[ROW][C]27[/C][C]13.3[/C][C]13.1935761589404[/C][C]0.106423841059602[/C][/ROW]
[ROW][C]28[/C][C]13.1[/C][C]12.9935761589404[/C][C]0.106423841059602[/C][/ROW]
[ROW][C]29[/C][C]12.7[/C][C]12.7267880794702[/C][C]-0.0267880794701999[/C][/ROW]
[ROW][C]30[/C][C]13.5[/C][C]13.1067880794702[/C][C]0.3932119205298[/C][/ROW]
[ROW][C]31[/C][C]14.3[/C][C]13.3467880794702[/C][C]0.953211920529801[/C][/ROW]
[ROW][C]32[/C][C]15[/C][C]13.4267880794702[/C][C]1.5732119205298[/C][/ROW]
[ROW][C]33[/C][C]15[/C][C]14.8067880794702[/C][C]0.193211920529802[/C][/ROW]
[ROW][C]34[/C][C]14.5[/C][C]14.8267880794702[/C][C]-0.326788079470198[/C][/ROW]
[ROW][C]35[/C][C]13.7[/C][C]14.5867880794702[/C][C]-0.8867880794702[/C][/ROW]
[ROW][C]36[/C][C]13.1[/C][C]14.1267880794702[/C][C]-1.0267880794702[/C][/ROW]
[ROW][C]37[/C][C]13.1[/C][C]13.2301986754967[/C][C]-0.130198675496692[/C][/ROW]
[ROW][C]38[/C][C]13.4[/C][C]13.4646799116998[/C][C]-0.0646799116997822[/C][/ROW]
[ROW][C]39[/C][C]12.9[/C][C]13.4646799116998[/C][C]-0.564679911699779[/C][/ROW]
[ROW][C]40[/C][C]12.9[/C][C]13.2646799116998[/C][C]-0.364679911699778[/C][/ROW]
[ROW][C]41[/C][C]12.6[/C][C]12.9978918322296[/C][C]-0.39789183222958[/C][/ROW]
[ROW][C]42[/C][C]12.3[/C][C]13.3778918322296[/C][C]-1.07789183222958[/C][/ROW]
[ROW][C]43[/C][C]12.3[/C][C]13.6178918322296[/C][C]-1.31789183222958[/C][/ROW]
[ROW][C]44[/C][C]12.8[/C][C]13.6978918322296[/C][C]-0.897891832229579[/C][/ROW]
[ROW][C]45[/C][C]15.8[/C][C]15.0778918322296[/C][C]0.722108167770421[/C][/ROW]
[ROW][C]46[/C][C]16.2[/C][C]15.0978918322296[/C][C]1.10210816777042[/C][/ROW]
[ROW][C]47[/C][C]15.8[/C][C]14.8578918322296[/C][C]0.94210816777042[/C][/ROW]
[ROW][C]48[/C][C]15.3[/C][C]14.3978918322296[/C][C]0.90210816777042[/C][/ROW]
[ROW][C]49[/C][C]14.9[/C][C]13.5013024282561[/C][C]1.39869757174393[/C][/ROW]
[ROW][C]50[/C][C]14.4[/C][C]13.7357836644592[/C][C]0.664216335540837[/C][/ROW]
[ROW][C]51[/C][C]13.6[/C][C]13.7357836644592[/C][C]-0.135783664459160[/C][/ROW]
[ROW][C]52[/C][C]13.1[/C][C]13.5357836644592[/C][C]-0.43578366445916[/C][/ROW]
[ROW][C]53[/C][C]13.2[/C][C]13.2689955849890[/C][C]-0.0689955849889616[/C][/ROW]
[ROW][C]54[/C][C]12.9[/C][C]13.6489955849890[/C][C]-0.74899558498896[/C][/ROW]
[ROW][C]55[/C][C]13[/C][C]13.8889955849890[/C][C]-0.88899558498896[/C][/ROW]
[ROW][C]56[/C][C]13[/C][C]13.9689955849890[/C][C]-0.968995584988961[/C][/ROW]
[ROW][C]57[/C][C]15.7[/C][C]15.3489955849890[/C][C]0.351004415011039[/C][/ROW]
[ROW][C]58[/C][C]15.2[/C][C]15.3689955849890[/C][C]-0.168995584988961[/C][/ROW]
[ROW][C]59[/C][C]14.1[/C][C]15.1289955849890[/C][C]-1.02899558498896[/C][/ROW]
[ROW][C]60[/C][C]13.7[/C][C]14.6689955849890[/C][C]-0.968995584988962[/C][/ROW]
[ROW][C]61[/C][C]13.6[/C][C]13.7724061810155[/C][C]-0.172406181015454[/C][/ROW]
[/TABLE]
Source: https://freestatistics.org/blog/index.php?pk=25856&T=4

Globally Unique Identifier (entire table): ba.freestatistics.org/blog/index.php?pk=25856&T=4

As an alternative you can also use a QR Code:  

The GUIDs for individual cells are displayed in the table below:

Multiple Linear Regression - Actuals, Interpolation, and Residuals
Time or IndexActualsInterpolationForecastResidualsPrediction Error
14.99.48294701986753-4.58294701986754
26.69.71742825607062-3.11742825607062
389.71742825607064-1.71742825607064
47.69.51742825607064-1.91742825607064
59.29.25064017660044-0.0506401766004418
610.79.630640176600441.06935982339956
711.29.870640176600441.32935982339956
810.79.950640176600440.749359823399557
910.411.3306401766004-0.930640176600441
1010.111.3506401766004-1.25064017660044
1111.411.11064017660040.289359823399559
1211.510.65064017660040.849359823399558
1312.29.754050772626942.44594922737306
1411.99.988532008830021.91146799116998
1512.39.988532008830022.31146799116998
1612.49.788532008830022.61146799116998
171312.45568432671080.544315673289182
1813.212.83568432671080.364315673289181
191313.0756843267108-0.0756843267108186
2012.713.1556843267108-0.455684326710819
2114.214.5356843267108-0.335684326710818
2215.214.55568432671080.644315673289182
231514.31568432671080.684315673289182
2414.113.85568432671080.244315673289181
251412.95909492273731.04090507726269
2613.813.19357615894040.606423841059599
2713.313.19357615894040.106423841059602
2813.112.99357615894040.106423841059602
2912.712.7267880794702-0.0267880794701999
3013.513.10678807947020.3932119205298
3114.313.34678807947020.953211920529801
321513.42678807947021.5732119205298
331514.80678807947020.193211920529802
3414.514.8267880794702-0.326788079470198
3513.714.5867880794702-0.8867880794702
3613.114.1267880794702-1.0267880794702
3713.113.2301986754967-0.130198675496692
3813.413.4646799116998-0.0646799116997822
3912.913.4646799116998-0.564679911699779
4012.913.2646799116998-0.364679911699778
4112.612.9978918322296-0.39789183222958
4212.313.3778918322296-1.07789183222958
4312.313.6178918322296-1.31789183222958
4412.813.6978918322296-0.897891832229579
4515.815.07789183222960.722108167770421
4616.215.09789183222961.10210816777042
4715.814.85789183222960.94210816777042
4815.314.39789183222960.90210816777042
4914.913.50130242825611.39869757174393
5014.413.73578366445920.664216335540837
5113.613.7357836644592-0.135783664459160
5213.113.5357836644592-0.43578366445916
5313.213.2689955849890-0.0689955849889616
5412.913.6489955849890-0.74899558498896
551313.8889955849890-0.88899558498896
561313.9689955849890-0.968995584988961
5715.715.34899558498900.351004415011039
5815.215.3689955849890-0.168995584988961
5914.115.1289955849890-1.02899558498896
6013.714.6689955849890-0.968995584988962
6113.613.7724061810155-0.172406181015454


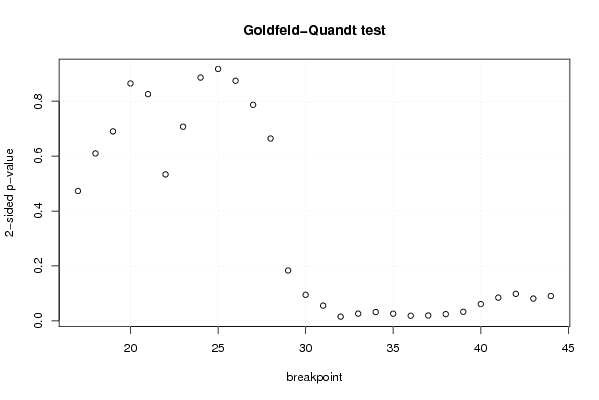
Goldfeld-Quandt test for Heteroskedasticity
p-valuesAlternative Hypothesis
breakpoint indexgreater2-sidedless
170.7635041156137870.4729917687724260.236495884386213
180.6950722916501990.6098554166996030.304927708349801
190.6549353221968710.6901293556062580.345064677803129
200.5676891574907290.8646216850185430.432310842509271
210.5870202668033550.825959466393290.412979733196645
220.7332800928549890.5334398142900210.266719907145011
230.6463807735516080.7072384528967850.353619226448392
240.5569330119322590.8861339761354820.443066988067741
250.4588082697576340.9176165395152680.541191730242366
260.4373345130670440.8746690261340890.562665486932955
270.6065417242006720.7869165515986570.393458275799328
280.6679221249889140.6641557500221720.332077875011086
290.9082528272288620.1834943455422760.0917471727711378
300.952531839504490.09493632099102040.0474681604955102
310.972278615114060.05544276977187890.0277213848859395
320.9923928954242430.01521420915151320.00760710457575659
330.986919214025160.02616157194967780.0130807859748389
340.984060789628140.03187842074371920.0159392103718596
350.9870222093783450.02595558124331070.0129777906216554
360.9907197823367130.01856043532657370.00928021766328685
370.9903261070170350.01934778596593090.00967389298296546
380.9877759683681530.02444806326369350.0122240316318467
390.9835437249439830.03291255011203470.0164562750560173
400.9694618580202570.06107628395948570.0305381419797428
410.95776787402110.08446425195780040.0422321259789002
420.950824534590190.09835093081962140.0491754654098107
430.959443745883780.08111250823244060.0405562541162203
440.9547939699868520.09041206002629540.0452060300131477

\begin{tabular}{lllllllll}
\hline
Goldfeld-Quandt test for Heteroskedasticity \tabularnewline
p-values & Alternative Hypothesis \tabularnewline
breakpoint index & greater & 2-sided & less \tabularnewline
17 & 0.763504115613787 & 0.472991768772426 & 0.236495884386213 \tabularnewline
18 & 0.695072291650199 & 0.609855416699603 & 0.304927708349801 \tabularnewline
19 & 0.654935322196871 & 0.690129355606258 & 0.345064677803129 \tabularnewline
20 & 0.567689157490729 & 0.864621685018543 & 0.432310842509271 \tabularnewline
21 & 0.587020266803355 & 0.82595946639329 & 0.412979733196645 \tabularnewline
22 & 0.733280092854989 & 0.533439814290021 & 0.266719907145011 \tabularnewline
23 & 0.646380773551608 & 0.707238452896785 & 0.353619226448392 \tabularnewline
24 & 0.556933011932259 & 0.886133976135482 & 0.443066988067741 \tabularnewline
25 & 0.458808269757634 & 0.917616539515268 & 0.541191730242366 \tabularnewline
26 & 0.437334513067044 & 0.874669026134089 & 0.562665486932955 \tabularnewline
27 & 0.606541724200672 & 0.786916551598657 & 0.393458275799328 \tabularnewline
28 & 0.667922124988914 & 0.664155750022172 & 0.332077875011086 \tabularnewline
29 & 0.908252827228862 & 0.183494345542276 & 0.0917471727711378 \tabularnewline
30 & 0.95253183950449 & 0.0949363209910204 & 0.0474681604955102 \tabularnewline
31 & 0.97227861511406 & 0.0554427697718789 & 0.0277213848859395 \tabularnewline
32 & 0.992392895424243 & 0.0152142091515132 & 0.00760710457575659 \tabularnewline
33 & 0.98691921402516 & 0.0261615719496778 & 0.0130807859748389 \tabularnewline
34 & 0.98406078962814 & 0.0318784207437192 & 0.0159392103718596 \tabularnewline
35 & 0.987022209378345 & 0.0259555812433107 & 0.0129777906216554 \tabularnewline
36 & 0.990719782336713 & 0.0185604353265737 & 0.00928021766328685 \tabularnewline
37 & 0.990326107017035 & 0.0193477859659309 & 0.00967389298296546 \tabularnewline
38 & 0.987775968368153 & 0.0244480632636935 & 0.0122240316318467 \tabularnewline
39 & 0.983543724943983 & 0.0329125501120347 & 0.0164562750560173 \tabularnewline
40 & 0.969461858020257 & 0.0610762839594857 & 0.0305381419797428 \tabularnewline
41 & 0.9577678740211 & 0.0844642519578004 & 0.0422321259789002 \tabularnewline
42 & 0.95082453459019 & 0.0983509308196214 & 0.0491754654098107 \tabularnewline
43 & 0.95944374588378 & 0.0811125082324406 & 0.0405562541162203 \tabularnewline
44 & 0.954793969986852 & 0.0904120600262954 & 0.0452060300131477 \tabularnewline
\hline
\end{tabular}
%Source: https://freestatistics.org/blog/index.php?pk=25856&T=5

[TABLE]
[ROW][C]Goldfeld-Quandt test for Heteroskedasticity[/C][/ROW]
[ROW][C]p-values[/C][C]Alternative Hypothesis[/C][/ROW]
[ROW][C]breakpoint index[/C][C]greater[/C][C]2-sided[/C][C]less[/C][/ROW]
[ROW][C]17[/C][C]0.763504115613787[/C][C]0.472991768772426[/C][C]0.236495884386213[/C][/ROW]
[ROW][C]18[/C][C]0.695072291650199[/C][C]0.609855416699603[/C][C]0.304927708349801[/C][/ROW]
[ROW][C]19[/C][C]0.654935322196871[/C][C]0.690129355606258[/C][C]0.345064677803129[/C][/ROW]
[ROW][C]20[/C][C]0.567689157490729[/C][C]0.864621685018543[/C][C]0.432310842509271[/C][/ROW]
[ROW][C]21[/C][C]0.587020266803355[/C][C]0.82595946639329[/C][C]0.412979733196645[/C][/ROW]
[ROW][C]22[/C][C]0.733280092854989[/C][C]0.533439814290021[/C][C]0.266719907145011[/C][/ROW]
[ROW][C]23[/C][C]0.646380773551608[/C][C]0.707238452896785[/C][C]0.353619226448392[/C][/ROW]
[ROW][C]24[/C][C]0.556933011932259[/C][C]0.886133976135482[/C][C]0.443066988067741[/C][/ROW]
[ROW][C]25[/C][C]0.458808269757634[/C][C]0.917616539515268[/C][C]0.541191730242366[/C][/ROW]
[ROW][C]26[/C][C]0.437334513067044[/C][C]0.874669026134089[/C][C]0.562665486932955[/C][/ROW]
[ROW][C]27[/C][C]0.606541724200672[/C][C]0.786916551598657[/C][C]0.393458275799328[/C][/ROW]
[ROW][C]28[/C][C]0.667922124988914[/C][C]0.664155750022172[/C][C]0.332077875011086[/C][/ROW]
[ROW][C]29[/C][C]0.908252827228862[/C][C]0.183494345542276[/C][C]0.0917471727711378[/C][/ROW]
[ROW][C]30[/C][C]0.95253183950449[/C][C]0.0949363209910204[/C][C]0.0474681604955102[/C][/ROW]
[ROW][C]31[/C][C]0.97227861511406[/C][C]0.0554427697718789[/C][C]0.0277213848859395[/C][/ROW]
[ROW][C]32[/C][C]0.992392895424243[/C][C]0.0152142091515132[/C][C]0.00760710457575659[/C][/ROW]
[ROW][C]33[/C][C]0.98691921402516[/C][C]0.0261615719496778[/C][C]0.0130807859748389[/C][/ROW]
[ROW][C]34[/C][C]0.98406078962814[/C][C]0.0318784207437192[/C][C]0.0159392103718596[/C][/ROW]
[ROW][C]35[/C][C]0.987022209378345[/C][C]0.0259555812433107[/C][C]0.0129777906216554[/C][/ROW]
[ROW][C]36[/C][C]0.990719782336713[/C][C]0.0185604353265737[/C][C]0.00928021766328685[/C][/ROW]
[ROW][C]37[/C][C]0.990326107017035[/C][C]0.0193477859659309[/C][C]0.00967389298296546[/C][/ROW]
[ROW][C]38[/C][C]0.987775968368153[/C][C]0.0244480632636935[/C][C]0.0122240316318467[/C][/ROW]
[ROW][C]39[/C][C]0.983543724943983[/C][C]0.0329125501120347[/C][C]0.0164562750560173[/C][/ROW]
[ROW][C]40[/C][C]0.969461858020257[/C][C]0.0610762839594857[/C][C]0.0305381419797428[/C][/ROW]
[ROW][C]41[/C][C]0.9577678740211[/C][C]0.0844642519578004[/C][C]0.0422321259789002[/C][/ROW]
[ROW][C]42[/C][C]0.95082453459019[/C][C]0.0983509308196214[/C][C]0.0491754654098107[/C][/ROW]
[ROW][C]43[/C][C]0.95944374588378[/C][C]0.0811125082324406[/C][C]0.0405562541162203[/C][/ROW]
[ROW][C]44[/C][C]0.954793969986852[/C][C]0.0904120600262954[/C][C]0.0452060300131477[/C][/ROW]
[/TABLE]
Source: https://freestatistics.org/blog/index.php?pk=25856&T=5

Globally Unique Identifier (entire table): ba.freestatistics.org/blog/index.php?pk=25856&T=5

As an alternative you can also use a QR Code:  

The GUIDs for individual cells are displayed in the table below:

Goldfeld-Quandt test for Heteroskedasticity
p-valuesAlternative Hypothesis
breakpoint indexgreater2-sidedless
170.7635041156137870.4729917687724260.236495884386213
180.6950722916501990.6098554166996030.304927708349801
190.6549353221968710.6901293556062580.345064677803129
200.5676891574907290.8646216850185430.432310842509271
210.5870202668033550.825959466393290.412979733196645
220.7332800928549890.5334398142900210.266719907145011
230.6463807735516080.7072384528967850.353619226448392
240.5569330119322590.8861339761354820.443066988067741
250.4588082697576340.9176165395152680.541191730242366
260.4373345130670440.8746690261340890.562665486932955
270.6065417242006720.7869165515986570.393458275799328
280.6679221249889140.6641557500221720.332077875011086
290.9082528272288620.1834943455422760.0917471727711378
300.952531839504490.09493632099102040.0474681604955102
310.972278615114060.05544276977187890.0277213848859395
320.9923928954242430.01521420915151320.00760710457575659
330.986919214025160.02616157194967780.0130807859748389
340.984060789628140.03187842074371920.0159392103718596
350.9870222093783450.02595558124331070.0129777906216554
360.9907197823367130.01856043532657370.00928021766328685
370.9903261070170350.01934778596593090.00967389298296546
380.9877759683681530.02444806326369350.0122240316318467
390.9835437249439830.03291255011203470.0164562750560173
400.9694618580202570.06107628395948570.0305381419797428
410.95776787402110.08446425195780040.0422321259789002
420.950824534590190.09835093081962140.0491754654098107
430.959443745883780.08111250823244060.0405562541162203
440.9547939699868520.09041206002629540.0452060300131477


Meta Analysis of Goldfeld-Quandt test for Heteroskedasticity
Description# significant tests% significant testsOK/NOK
1% type I error level00OK
5% type I error level80.285714285714286NOK
10% type I error level150.535714285714286NOK

\begin{tabular}{lllllllll}
\hline
Meta Analysis of Goldfeld-Quandt test for Heteroskedasticity \tabularnewline
Description & # significant tests & % significant tests & OK/NOK \tabularnewline
1% type I error level & 0 & 0 & OK \tabularnewline
5% type I error level & 8 & 0.285714285714286 & NOK \tabularnewline
10% type I error level & 15 & 0.535714285714286 & NOK \tabularnewline
\hline
\end{tabular}
%Source: https://freestatistics.org/blog/index.php?pk=25856&T=6

[TABLE]
[ROW][C]Meta Analysis of Goldfeld-Quandt test for Heteroskedasticity[/C][/ROW]
[ROW][C]Description[/C][C]# significant tests[/C][C]% significant tests[/C][C]OK/NOK[/C][/ROW]
[ROW][C]1% type I error level[/C][C]0[/C][C]0[/C][C]OK[/C][/ROW]
[ROW][C]5% type I error level[/C][C]8[/C][C]0.285714285714286[/C][C]NOK[/C][/ROW]
[ROW][C]10% type I error level[/C][C]15[/C][C]0.535714285714286[/C][C]NOK[/C][/ROW]
[/TABLE]
Source: https://freestatistics.org/blog/index.php?pk=25856&T=6

Globally Unique Identifier (entire table): ba.freestatistics.org/blog/index.php?pk=25856&T=6

As an alternative you can also use a QR Code:  

The GUIDs for individual cells are displayed in the table below:

Meta Analysis of Goldfeld-Quandt test for Heteroskedasticity
Description# significant tests% significant testsOK/NOK
1% type I error level00OK
5% type I error level80.285714285714286NOK
10% type I error level150.535714285714286NOK


Parameters (Session):
par1 = 1 ; par2 = Include Monthly Dummies ; par3 = Linear Trend ;
Parameters (R input):
par1 = 1 ; par2 = Include Monthly Dummies ; par3 = Linear Trend ;
R code (references can be found in the software module):
library(lattice)
library(lmtest)
n25 <- 25 #minimum number of obs. for Goldfeld-Quandt test
par1 <- as.numeric(par1)
x <- t(y)
k <- length(x[1,])
n <- length(x[,1])
x1 <- cbind(x[,par1], x[,1:k!=par1])
mycolnames <- c(colnames(x)[par1], colnames(x)[1:k!=par1])
colnames(x1) <- mycolnames #colnames(x)[par1]
x <- x1
if (par3 == 'First Differences'){
x2 <- array(0, dim=c(n-1,k), dimnames=list(1:(n-1), paste('(1-B)',colnames(x),sep='')))
for (i in 1:n-1) {
for (j in 1:k) {
x2[i,j] <- x[i+1,j] - x[i,j]
}
}
x <- x2
}
if (par2 == 'Include Monthly Dummies'){
x2 <- array(0, dim=c(n,11), dimnames=list(1:n, paste('M', seq(1:11), sep ='')))
for (i in 1:11){
x2[seq(i,n,12),i] <- 1
}
x <- cbind(x, x2)
}
if (par2 == 'Include Quarterly Dummies'){
x2 <- array(0, dim=c(n,3), dimnames=list(1:n, paste('Q', seq(1:3), sep ='')))
for (i in 1:3){
x2[seq(i,n,4),i] <- 1
}
x <- cbind(x, x2)
}
k <- length(x[1,])
if (par3 == 'Linear Trend'){
x <- cbind(x, c(1:n))
colnames(x)[k+1] <- 't'
}
x
k <- length(x[1,])
df <- as.data.frame(x)
(mylm <- lm(df))
(mysum <- summary(mylm))
if (n > n25) {
kp3 <- k + 3
nmkm3 <- n - k - 3
gqarr <- array(NA, dim=c(nmkm3-kp3+1,3))
numgqtests <- 0
numsignificant1 <- 0
numsignificant5 <- 0
numsignificant10 <- 0
for (mypoint in kp3:nmkm3) {
j <- 0
numgqtests <- numgqtests + 1
for (myalt in c('greater', 'two.sided', 'less')) {
j <- j + 1
gqarr[mypoint-kp3+1,j] <- gqtest(mylm, point=mypoint, alternative=myalt)$p.value
}
if (gqarr[mypoint-kp3+1,2] < 0.01) numsignificant1 <- numsignificant1 + 1
if (gqarr[mypoint-kp3+1,2] < 0.05) numsignificant5 <- numsignificant5 + 1
if (gqarr[mypoint-kp3+1,2] < 0.10) numsignificant10 <- numsignificant10 + 1
}
gqarr
}
bitmap(file='test0.png')
plot(x[,1], type='l', main='Actuals and Interpolation', ylab='value of Actuals and Interpolation (dots)', xlab='time or index')
points(x[,1]-mysum$resid)
grid()
dev.off()
bitmap(file='test1.png')
plot(mysum$resid, type='b', pch=19, main='Residuals', ylab='value of Residuals', xlab='time or index')
grid()
dev.off()
bitmap(file='test2.png')
hist(mysum$resid, main='Residual Histogram', xlab='values of Residuals')
grid()
dev.off()
bitmap(file='test3.png')
densityplot(~mysum$resid,col='black',main='Residual Density Plot', xlab='values of Residuals')
dev.off()
bitmap(file='test4.png')
qqnorm(mysum$resid, main='Residual Normal Q-Q Plot')
qqline(mysum$resid)
grid()
dev.off()
(myerror <- as.ts(mysum$resid))
bitmap(file='test5.png')
dum <- cbind(lag(myerror,k=1),myerror)
dum
dum1 <- dum[2:length(myerror),]
dum1
z <- as.data.frame(dum1)
z
plot(z,main=paste('Residual Lag plot, lowess, and regression line'), ylab='values of Residuals', xlab='lagged values of Residuals')
lines(lowess(z))
abline(lm(z))
grid()
dev.off()
bitmap(file='test6.png')
acf(mysum$resid, lag.max=length(mysum$resid)/2, main='Residual Autocorrelation Function')
grid()
dev.off()
bitmap(file='test7.png')
pacf(mysum$resid, lag.max=length(mysum$resid)/2, main='Residual Partial Autocorrelation Function')
grid()
dev.off()
bitmap(file='test8.png')
opar <- par(mfrow = c(2,2), oma = c(0, 0, 1.1, 0))
plot(mylm, las = 1, sub='Residual Diagnostics')
par(opar)
dev.off()
if (n > n25) {
bitmap(file='test9.png')
plot(kp3:nmkm3,gqarr[,2], main='Goldfeld-Quandt test',ylab='2-sided p-value',xlab='breakpoint')
grid()
dev.off()
}
load(file='createtable')
a<-table.start()
a<-table.row.start(a)
a<-table.element(a, 'Multiple Linear Regression - Estimated Regression Equation', 1, TRUE)
a<-table.row.end(a)
myeq <- colnames(x)[1]
myeq <- paste(myeq, '[t] = ', sep='')
for (i in 1:k){
if (mysum$coefficients[i,1] > 0) myeq <- paste(myeq, '+', '')
myeq <- paste(myeq, mysum$coefficients[i,1], sep=' ')
if (rownames(mysum$coefficients)[i] != '(Intercept)') {
myeq <- paste(myeq, rownames(mysum$coefficients)[i], sep='')
if (rownames(mysum$coefficients)[i] != 't') myeq <- paste(myeq, '[t]', sep='')
}
}
myeq <- paste(myeq, ' + e[t]')
a<-table.row.start(a)
a<-table.element(a, myeq)
a<-table.row.end(a)
a<-table.end(a)
table.save(a,file='mytable1.tab')
a<-table.start()
a<-table.row.start(a)
a<-table.element(a,hyperlink('ols1.htm','Multiple Linear Regression - Ordinary Least Squares',''), 6, TRUE)
a<-table.row.end(a)
a<-table.row.start(a)
a<-table.element(a,'Variable',header=TRUE)
a<-table.element(a,'Parameter',header=TRUE)
a<-table.element(a,'S.D.',header=TRUE)
a<-table.element(a,'T-STAT
H0: parameter = 0',header=TRUE)
a<-table.element(a,'2-tail p-value',header=TRUE)
a<-table.element(a,'1-tail p-value',header=TRUE)
a<-table.row.end(a)
for (i in 1:k){
a<-table.row.start(a)
a<-table.element(a,rownames(mysum$coefficients)[i],header=TRUE)
a<-table.element(a,mysum$coefficients[i,1])
a<-table.element(a, round(mysum$coefficients[i,2],6))
a<-table.element(a, round(mysum$coefficients[i,3],4))
a<-table.element(a, round(mysum$coefficients[i,4],6))
a<-table.element(a, round(mysum$coefficients[i,4]/2,6))
a<-table.row.end(a)
}
a<-table.end(a)
table.save(a,file='mytable2.tab')
a<-table.start()
a<-table.row.start(a)
a<-table.element(a, 'Multiple Linear Regression - Regression Statistics', 2, TRUE)
a<-table.row.end(a)
a<-table.row.start(a)
a<-table.element(a, 'Multiple R',1,TRUE)
a<-table.element(a, sqrt(mysum$r.squared))
a<-table.row.end(a)
a<-table.row.start(a)
a<-table.element(a, 'R-squared',1,TRUE)
a<-table.element(a, mysum$r.squared)
a<-table.row.end(a)
a<-table.row.start(a)
a<-table.element(a, 'Adjusted R-squared',1,TRUE)
a<-table.element(a, mysum$adj.r.squared)
a<-table.row.end(a)
a<-table.row.start(a)
a<-table.element(a, 'F-TEST (value)',1,TRUE)
a<-table.element(a, mysum$fstatistic[1])
a<-table.row.end(a)
a<-table.row.start(a)
a<-table.element(a, 'F-TEST (DF numerator)',1,TRUE)
a<-table.element(a, mysum$fstatistic[2])
a<-table.row.end(a)
a<-table.row.start(a)
a<-table.element(a, 'F-TEST (DF denominator)',1,TRUE)
a<-table.element(a, mysum$fstatistic[3])
a<-table.row.end(a)
a<-table.row.start(a)
a<-table.element(a, 'p-value',1,TRUE)
a<-table.element(a, 1-pf(mysum$fstatistic[1],mysum$fstatistic[2],mysum$fstatistic[3]))
a<-table.row.end(a)
a<-table.row.start(a)
a<-table.element(a, 'Multiple Linear Regression - Residual Statistics', 2, TRUE)
a<-table.row.end(a)
a<-table.row.start(a)
a<-table.element(a, 'Residual Standard Deviation',1,TRUE)
a<-table.element(a, mysum$sigma)
a<-table.row.end(a)
a<-table.row.start(a)
a<-table.element(a, 'Sum Squared Residuals',1,TRUE)
a<-table.element(a, sum(myerror*myerror))
a<-table.row.end(a)
a<-table.end(a)
table.save(a,file='mytable3.tab')
a<-table.start()
a<-table.row.start(a)
a<-table.element(a, 'Multiple Linear Regression - Actuals, Interpolation, and Residuals', 4, TRUE)
a<-table.row.end(a)
a<-table.row.start(a)
a<-table.element(a, 'Time or Index', 1, TRUE)
a<-table.element(a, 'Actuals', 1, TRUE)
a<-table.element(a, 'Interpolation
Forecast', 1, TRUE)
a<-table.element(a, 'Residuals
Prediction Error', 1, TRUE)
a<-table.row.end(a)
for (i in 1:n) {
a<-table.row.start(a)
a<-table.element(a,i, 1, TRUE)
a<-table.element(a,x[i])
a<-table.element(a,x[i]-mysum$resid[i])
a<-table.element(a,mysum$resid[i])
a<-table.row.end(a)
}
a<-table.end(a)
table.save(a,file='mytable4.tab')
if (n > n25) {
a<-table.start()
a<-table.row.start(a)
a<-table.element(a,'Goldfeld-Quandt test for Heteroskedasticity',4,TRUE)
a<-table.row.end(a)
a<-table.row.start(a)
a<-table.element(a,'p-values',header=TRUE)
a<-table.element(a,'Alternative Hypothesis',3,header=TRUE)
a<-table.row.end(a)
a<-table.row.start(a)
a<-table.element(a,'breakpoint index',header=TRUE)
a<-table.element(a,'greater',header=TRUE)
a<-table.element(a,'2-sided',header=TRUE)
a<-table.element(a,'less',header=TRUE)
a<-table.row.end(a)
for (mypoint in kp3:nmkm3) {
a<-table.row.start(a)
a<-table.element(a,mypoint,header=TRUE)
a<-table.element(a,gqarr[mypoint-kp3+1,1])
a<-table.element(a,gqarr[mypoint-kp3+1,2])
a<-table.element(a,gqarr[mypoint-kp3+1,3])
a<-table.row.end(a)
}
a<-table.end(a)
table.save(a,file='mytable5.tab')
a<-table.start()
a<-table.row.start(a)
a<-table.element(a,'Meta Analysis of Goldfeld-Quandt test for Heteroskedasticity',4,TRUE)
a<-table.row.end(a)
a<-table.row.start(a)
a<-table.element(a,'Description',header=TRUE)
a<-table.element(a,'# significant tests',header=TRUE)
a<-table.element(a,'% significant tests',header=TRUE)
a<-table.element(a,'OK/NOK',header=TRUE)
a<-table.row.end(a)
a<-table.row.start(a)
a<-table.element(a,'1% type I error level',header=TRUE)
a<-table.element(a,numsignificant1)
a<-table.element(a,numsignificant1/numgqtests)
if (numsignificant1/numgqtests < 0.01) dum <- 'OK' else dum <- 'NOK'
a<-table.element(a,dum)
a<-table.row.end(a)
a<-table.row.start(a)
a<-table.element(a,'5% type I error level',header=TRUE)
a<-table.element(a,numsignificant5)
a<-table.element(a,numsignificant5/numgqtests)
if (numsignificant5/numgqtests < 0.05) dum <- 'OK' else dum <- 'NOK'
a<-table.element(a,dum)
a<-table.row.end(a)
a<-table.row.start(a)
a<-table.element(a,'10% type I error level',header=TRUE)
a<-table.element(a,numsignificant10)
a<-table.element(a,numsignificant10/numgqtests)
if (numsignificant10/numgqtests < 0.1) dum <- 'OK' else dum <- 'NOK'
a<-table.element(a,dum)
a<-table.row.end(a)
a<-table.end(a)
table.save(a,file='mytable6.tab')
}